Japan Pavilion The UN Climate Change Conference COP


- Slides: 10
Japan Pavilion, The UN Climate Change Conference COP 25, 2 -13 December 2019, Madrid, Spain Interpretation of Carbon Cycle with Model Analysis and expectations from Satellite Observation P. K. Patra 1 , T. Hajima 1, R. Saito 2, N. Chandra 1, M. Kawamiya 1 1 RIGC, Japan Agency for Marine-Earth Science and Technology (JAMSTEC), Yokohama 2 Disaster Risk Reduction and Environ. SBU, Kokusai Kogyo Co. , Ltd. , Tokyo, Japan ERTDF #2 -1701, #2 -1802 Ministry of Environment, Govt. of Japan
Introduction The recent trends in global climate change is attributed mainly to an increase in carbon dioxide (CO 2) emissions due to the consumption of fossil fuels About 50% of CO 2 emissions due to fossil fuels are removed from atmosphere by land ocean
Atmospheric observations to support Paris target, by estimation of regional sources and sinks of GHGs Now we are at a new era of remote sensing measurement of greenhouse gases; GOSAT since 2009, OCO-2 since 2014, Trop. OMI, GOSAT-2, OCO-3 … We use in situ data from SIO/UCSD, GMD/NOAA, JMA, NIES, CSIRO, European agencies etc. These data are at very high precision and often multispecies, helping separate anthropogenic vs natural sources at global scale, but are sparse in spatial coverage Thanks to the large number of colleagues for sharing data freely with periodic updates (WDCGG/Obs. Pack)
Hajima et al. , 2019, GMDD MIROC-ES 2 L Schematic: Biogeochemical processes Schematic: Component models Climate model “MIROC 5. 2 / 6” C cycle CO 2 exchange Anthropogenic N /N Fertilizer CO 2 exchange 2 CO 2 emission 2 O /Deposition (N 2)/N Deposition 2 O /Fixation Physics “MATSIRO” Iron transport CO 2 uptake Combustion Deposition / dissolution Dust Emission “MIROC-AGCM” Physics “COCO” Fe cycle /Fixation Physics Aerosol “SPRINTARS” C cycle N cycle River discharge N limitation on growth Fe limitation on growth Simulated Historical Carbon and Nitrogen cycles Biological fixation Biogeochem. “OECO-v 2” Fertilizer Biogeochem. “VISIT-e” Deposition River Net Uptake N 2 O LUC & Other gases Net Uptake River N 2 emission 2. 8 ox 2. 8 o, Atmosphere: About 40 layers o o Ocean: About 1 x 1. 62 layers Land: About 2. 8 ox 2. 8 o, 6 layers Denitrification Land Ocean
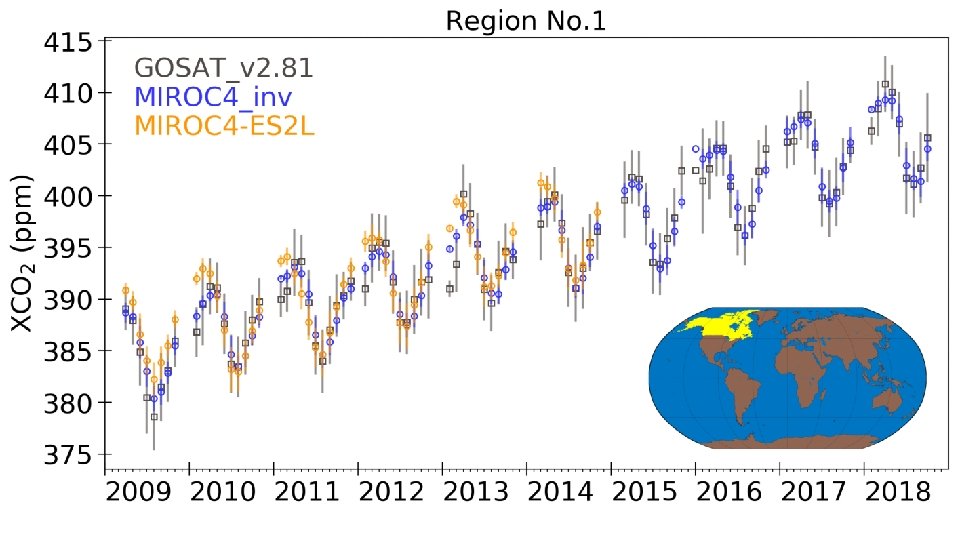
c. MIROC 4_Inv – GOSAT d. MIROC_ES 2 L – GOSAT e. MIROC 4_Inv – OCO 2 Consistency between atmospheric data and ESM fluxes
Comparison of GOSAT, MIROC 4 -Inversion and MIROC-ESM
Conclusions • We have developed an atmospheric chemistry transport model that is suitable for modelling long-lived GHGs in the Earth’s atmosphere • JAMSTEC’s global products of CO 2 (, CH 4 and N 2 O) fluxes are available through the GCP’s periodic update on budget assessments • The top-down estimations of the major GHGs budget would be generally ready for the Global Stocktake, under the Paris Agreement • Performance of earth system model MIROC-ES 2 L for simulating global and regional carbon is found to be satisfactory using XCO 2 data and inverse model results using in situ data • The remote sensing XCO 2 observations are now of sufficient accuracy for improved regional carbon budgeting and process-level understanding of the carbon cycle
Regional carbon budget 11 Biosphere models 8 Inversion models RECCAP reference Kondo, Patra, et al. , GCB, 2019 GCP annual budgets (Le Quere et al. , ESSD)