January 2022 Todays Title CW VectorsVelocity Time Graphs


 = change in velocity (m/s) time take (s) v=")
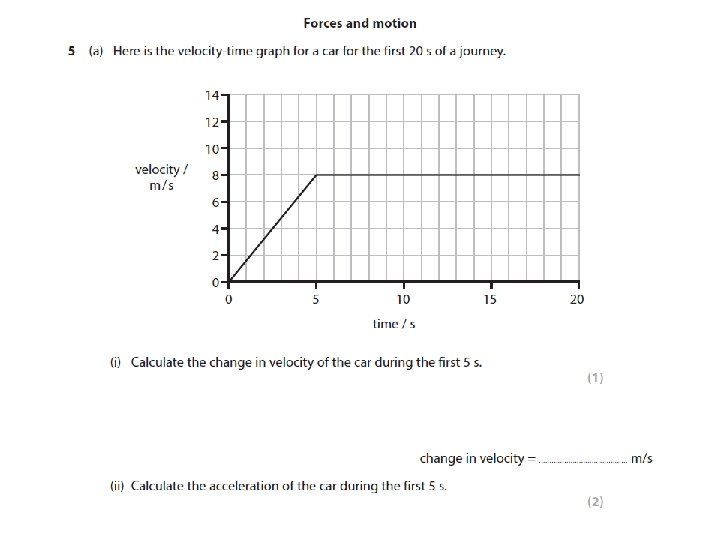
 t Example question: A car accelerates in 5")


 distance time")
 distance time")


- Slides: 34
January 2022 Today’s Title: CW: Vectors-Velocity Time Graphs Learning Question: How can we use graphs to calculate velocity? Starter – describe what is happening in this graph: distance time
Acceleration • Acceleration is how quickly speed in a certain direction is changing. • What word have you learned that could replace the phrase “speed in a certain direction”? • Velocity
Question 1 • How are velocity and acceleration connected? • Acceleration is the change in velocity per second. It is calculated from the equation acceleration = change in velocity/time taken.
Acceleration • Acceleration can be a change in: – Speed; – Direction; – Or speed and direction • Acceleration can be described as a vector quantity because it has a magnitude (size) and direction • Remember, acceleration does not always mean getting faster, it is a change, so it can mean getting slower too.
Question 2 • Explain why acceleration is a vector quantity. • A: Because velocity is a vector quantity; because acceleration has a direction as well as a size.
Acceleration equation Acceleration (m/s 2) = change in velocity (m/s) time take (s) v= velocity at the end a = (v – u) t u= velocity at the start v-u = means working out the change in velocity The unit of acceleration is m/s 2 NOT to be confused with velocity, which is m/s
Acceleration a = (v – u) t Example question: A car accelerates in 5 s from 25 m/s to 35 m/s. What is its change in velocity? 35 – 25 = 10 m/s What is its acceleration? 10 m/s = 2 m/s 2 5 s
Question 3 • Space. Ship Two accelerates from 0 m/s to 2100 m/s vertically upwards in 90 seconds. What is its acceleration? • A: 2100 – 0 = 2100 • 2100 / 90 = • 23. 3 m/s 2
Question 4 A car travels along a straight road at 40 m/s. The driver brakes and brings the car to a halt in 8 seconds. What is the car’s acceleration? A: 0 – 40 = -40 (because the car is slowing down) -40 / 8 = – 5 m/s 2
Question 5 A train is travelling at 35 m/s. Coming into a station, it slows down with an acceleration of 0. 5 m/s 2. How much time does it take to stop? A: a = 0. 5 m/s 2 (v – u) = (0 -35) = -35 m/s 0. 5 m/s 2 = -35 m/s ÷ t 35 m/s ÷ 0. 5 m/s 2 =70 s a = (v – u) t
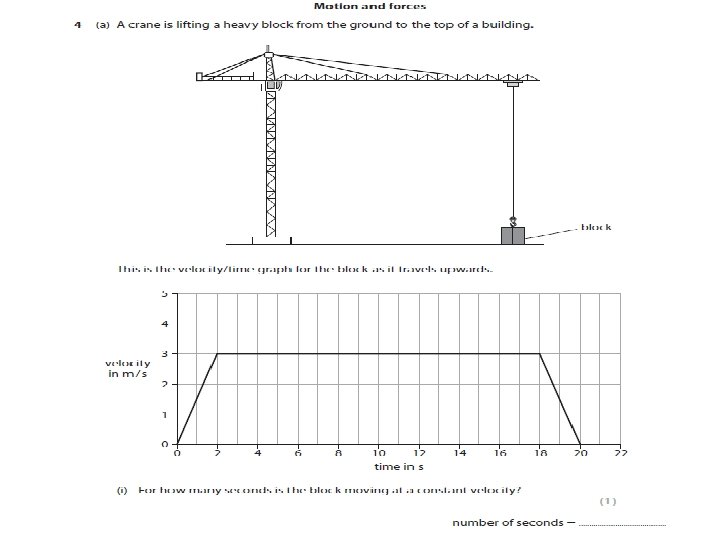
Velocity-time graphs • When an object is moving with a constant velocity, the line on the graph is horizontal. • When an object is moving with a constant acceleration, the line on the graph is straight, but sloped. • The steeper the line, the greater the acceleration of the object.
Get yourself a white board!!
Can you plot our results? distance time
No movement? distance time
No movement distance time
Constant speed? distance time
Constant speed distance time
Constant speed distance The gradient of this graph gives the speed time
Constant speed distance How would the graph look different for a faster constant speed? time
Constant speed fast distance time
Constant speed distance fast How would the graph look different for a slower constant speed? time
Constant speed fast distance slow time
Constant speed distance fast The gradient of the graph gives the speed slow time
Getting faster? (accelerating) distance time
Getting faster (accelerating) distance time
Examples distance time
A car accelerating from stop and then hitting a wall distance time
A car accelerating from stop and then hitting a wall distance time
Calculations using a velocity-time graph What was the acceleration to this point? 5 -0 / 25 = 0. 5 km/min 2
Calculating distance – higher tier • The distance travelled can be calculated from the graph, too. The area under the graph is equal to the distance travelled. Study this velocity-time graph.
Higher Tier The area • The area under the line in a velocity-time graph represents the distance travelled. To find the distance travelled in the graph above, you need to find the area of the light-blue triangle and the dark-blue rectangle. Area of light-blue triangle – The width of the triangle is 4 seconds and the height is 8 metres per second. To find the area, you use the equation: – area of triangle = 1⁄2 × base × height – so the area of the light-blue triangle is 1⁄2 × 8 × 4 = 16 m Area of dark-blue rectangle – The width of the rectangle is 6 seconds and the height is 8 metres per second. So the area is 8 × 6 = 48 m. Area under the whole graph – The area of the light-blue triangle plus the area of the dark-blue rectangle is: – 16 + 48 = 64 m. – This is the total area under the distance-time graph. This area represents the distance covered.