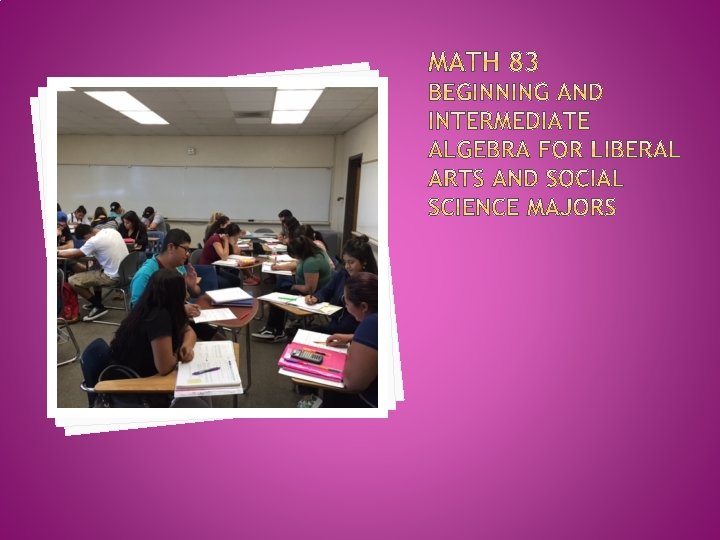
Janet Lechuga Lynn Marecek Lisa Mc KowanBourguignon George

Janet Lechuga Lynn Marecek Lisa Mc. Kowan-Bourguignon George Sweeney Santa Ana College Mathematics Department October 8, 2015

List 3 things you want to know about SAC Math Redesign.

� In Fall 2014, SAC had: � 26, 728 credit students 5, 156 Full Time Students, 20, 452 Part-Time Students � 41% females, 59% males � 54% are Latino, 8. 5% are Asian, 16. 5% White � 54% are first-generation college students � 78% of all full-time students receive the BOG � 3055 incoming freshmen students

� Incoming Freshmen � 51. 4% registered in Basic Skills classes � 20. 6% enrolled in Basic Skills Math (47. 64% pass rate) � 33. 9% enrolled in Basic Skills English (60% pass rate) � Basic Skills Completion �Math 41. 1% �English 37. 6%

� Share with you the exciting SAC Math Redesign project �Why Redesign? �History of the project �Details �Data � Encourage � Answer you to consider Math Redesign your questions about Math Redesign


� Too many students begin the developmental sequence and then never finish. �Do � 2 � 3 the Math Assume 70% pass rate/80% retention to the next course developmental courses and 1 college level 0. 70 x 0. 80 x 0. 70 = 21. 9% success developmental courses and 1 college level 0. 70 x 0. 80 x 0. 70 = 12. 3% success
 N Transfer-Ready Transfer Ready % 1566 602 38.")
Fall 2013 -Spring 2015 (All Cohorts) N Transfer-Ready Transfer Ready % 1566 602 38. 44% Basic Skills Complete 240 BSC % 15. 32% The chances of a student who begins in the developmental sequence at SAC completing a transfer level course are very low. They are especially low if the student begins three or more levels below transfer level math.

� Math 060 Students Tracked To Math 080/081 Within One Year Tracked to Math 080 Tracked to Success Math 060 Success Enrollment (grade Enrollment A, B, C, P) Fall 2013 467 72 48 239 N=1015 Spring 2014 418 61 33 160 N=820 Fall 2014 387 53 27 165 N=786 � Math 060 Elementary Algebra � Math 080/081 Intermediate Algebra Math 081 Success (grade A, B, C, P) 148 103 106 Total Success 19% (196/1015) 17% (136/820) 17% (133/786)

� Math 060 Students Tracked To Math 080/081 Within Two Years Tracked to Math 080/081 Math 060 Total Success Enrollment Success (grade A, B, C, P) Fall 2010 N=976 434 528 285 29% 285/976 Fall 2011 N=996 511 574 277 27% 277/996 � Math 060 Elementary Algebra � Math 080/081 Intermediate Algebra

� Respond to the data: What would you do next? ?

 the. NCAT. org �independent, not-for-profit organization")
� The National Center for Academic Transformation (NCAT) the. NCAT. org �independent, not-for-profit organization �provides leadership in using information technology to redesign learning environments to produce better learning outcomes for students to reduce costs to the institution �uses sound research practices
, funded by the Pew Charitable Trusts, 1999 –")
� Program in Course Redesign (PCR), funded by the Pew Charitable Trusts, 1999 – 2003 � Roadmap to Redesign (R 2 R), funded by FIPSE, 2003 – 2006 � Colleagues Committed to Redesign (C 2 R), funded by FIPSE, 2006 – 2009 � Changing the Equation funded by the Gates Foundation, 2010 – 2013 � the. NCAT. org

� Followed NCAT template to structure the process � Four Years of Work �Department Redesign Meetings monthly for 2. 5 hours �Committee meetings

� Five Principles of Successful Course Redesign �Redesign the whole course �Encourage �Provide active learning students with individualized assistance �Build in ongoing assessment and prompt (automated) feedback �Ensure sufficient time on task and monitor student progress

� Goals Year 1 2011 -2012 �Decide whether to redesign which course/s we will redesign what the model needs to include �Clarify our priorities for the redesign the pedagogical values of the department �Build consensus among the department faculty for the redesign plan

� What are the issues/concerns in our developmental math program that need to be addressed? � Low success rates � Low retention rates � Too long to transfer level � Overlap of material � Too much curriculum in a course � Lack of quantitative and logical thinking � Unnecessary topics in curriculum � Attendance � Poor attitudes � Weak study skills � Poor prerequisite skills � Unwillingness of students to do homework

� What are the issues/concerns in our developmental math program that need to be addressed? � Low success rates � Low retention rates � Too long to transfer Redesign the Course level � Overlap of material � Too much curriculum in a course � Lack of quantitative and logical thinking � Unnecessary topics in curriculum � Attendance � Poor attitudes � Weak study skills � Poor prerequisite skills � Unwillingness of students Restructure Curriculum Redesign the Course to do homework

� Two Pathways � BSTEM-Business, Science, Technology, Engineering, Math � SLAM -Statistics and Liberal Arts Math � Two New 6 Unit Courses � BSTEM-Math 084 � SLAM -Math 083 � Acceleration achieved by: � Better pre-placement test preparation � Math 060/081 combined into a 6 unit 1 semester course for each pathway BSTEM Business and Science, Technology, Engineering and Math SLAM Statistics and Liberal Arts Math

�Logic Model �Course Sequence Flow Chart

� Math 083 Academic/Course Content � Math 084 Academic/Course Content � Assessment and Outreach � Grants/ Title V � Curriculum/Articulation/Registration � Model Development � Technology/Hardware � Instructional Services � Training

� Goals Year 2 2012 -2013 �Decide what topics/objectives must be included in each course. which model best fits the needs of our students, the values of our faculty, and our facilities. the software and textbook needs of these courses/models. �Create timelines and task lists for each committee that will lead to full implementation.

�Model for each course will include: �Integration of Technology Some time in a computer(i. Pad) classroom with teacher Some time at home/ Math Center �Consistency across course sections Same core course in software Same course reference sheet Department final �Student Assistants in the classroom

�Model for each course will include: �Mastery �Study learning Skill Development �More critical thinking development �More conceptual development �Student interaction/group work

�Goals Year 3 2013 -2014 �Seek Administrative Support �Create Campus Task Force Inform other departments, etc. as to what we are doing Identify issues that must be addressed Develop solutions to the issues �Apply for a Title V grant �Select Software �Guide courses through curriculum �Create Software courses �Create Supplementary curriculum

� Goals �Keep Year 4 2014 -2015 focused on goals and previous decisions �Successfully Pilot 083, 084 �Implement Assessment Plan �Develop Training Plan �Establish Computer Classrooms �Secure funding �Outreach �Continue collaboration with other campus teams

� Pilot �Fall Classes ’ 14 2 sections Math 83 3 sections Math 84 �Intersession 1 section Math 84 �Spring ’ 15 (4 weeks) ’ 15 5 sections Math 83 5 sections Math 84

Assessment Plan for Math 83/Math 84 � Fall, Spring Semester Pilot comparisons � Course Success � Final Exam Comparison � Longitudinal Comparisons � Persistence � Basics � Skills Completion Ongoing In-Course Formative Assessment � Assignment Completion vs. Test Performance � Hours vs. Test Performance � Surveys � Enrollment assessment

� Training Modules �A----Philosophy of Redesign. This training is for both 083/084 instructors � B----Pedagogy and Classroom Practices. Math 083 B and Math 084 B. � C----Technology � of Redesign. Math 083 C and Math 084 C. To teach: � Math 083 � Math 084 Instructor must complete training modules: A, 083 B, 083 C A, 084 B, 084 C.

� Redesign � 6 Classrooms classrooms Booked all day/night �Amenities i. Pads White Boards Printer Apple TV Mediation

�Title V � One year of preparation � Not funded � BSI, Student Equity, etc. �Planning Support �Personnel �Classrooms (6) �Student Support Student tutors in the classroom � Total Funds over $250, 000 in 2014 -2015.

�BSI, Student Equity, etc. �Planning Support FIG –Monthly Faculty Planning Meetings for ’ 13 -’ 14 FIG- Pilot Faculty Weekly Meetings for ’ 14 -’ 15 �Personnel Redesign Coordinator Math 083 Coordinator Math 084 Coordinator Assessment Coordinator Software Coordinator

� Information to students about: the new classes, Math 083, Math 084 how to choose the best option for them personally the importance of the placement test � How was information disseminated? �SAUSD Task Force �Outreach at the high schools �Early Decision �Math N 48 classes �Flyers �Posters

�Math Placement Test Worksheet �Math Pathway Decision Chart

� The impact is huge: �Every Department �Curriculum �Articulation �Admissions/Records �Counseling �Freshman Experience �EOPS �DSPS

� Articulation with CSUs, UCs � What happens if a student wants to change pathways? � Supplemental instruction.

�Goals 2016 Year 5 �Successful 2015 - full implementation of 083, 084 �Implement Assessment Plan �Develop Supplementary Instruction Plan �Develop Plan for 083 to BSTEM pathway �Websites � Math � 32 sections � Math � 18 83 84 sections

Do you have any questions ?

� Consistency across sections � Common course documents and assessments � Teacher is facilitator of learning not the deliverer � Taught in an i. Pad classroom � Use online learning system with personalized homework � Student takes responsibility for own learning � Student Aides in each class

� Classroom �Present time will be used to: Mini-lectures in response to student needs �Work in groups and foster student interaction �Work on i. Pad math assignment �Develop study skills �Develop critical thinking skills �Develop conceptual understanding �Provide support for students

 � Homework Structure �")
� Course Reference sheet � Syllabus (personalized for each class) � Homework Structure � Time Allocation Model � Semester Schedule � First Day Plan and Talking Points � Welcome Email

�Class is 3 hours and 5 minutes � 0: 00 -0: 30 Class discussion/problem solving � 0: 30 -1: 20 Group work � 1: 20 -1: 40 Break and pass out i. Pads � 1: 40 -3: 00 Individual Work � 3: 00 -3: 05 Collect i. Pads � These are Guidelines only-each day is different!

� Example problems chosen �based on needs of the specific class �with item analysis of assignments in My. Labs. Plus � Students �respond to instructor raised questions �guide the instructor through problems �go over common mistakes or obstacles � Instructor �models proper mathematical form �ties together concepts and offers tips to avoid common mistakes

�Students �are engaged �eager to show what they learned �see how their work should be organized �see how to use proper mathematical form �see connections between objectives and concepts �feel ready for problem solving together in groups after this brief review

� Students work together in small groups/pairs on problems, usually at the whiteboards � The whole class is working on the same set of problems � Each group cannot erase a problem until the work is checked by the instructor or assistant.

� Students � are actively engaged � develop critical thinking skills � gain confidence in their abilities � take turns explaining the process to each other and thus gain a deeper understanding of the material � make connections with each other � learn the benefit of study groups � hold each other accountable � begin to connect with the instructor and assistant � see instructor as a coach who is “in their corner” � see assistant as a role model and mentor

� Students � work online on assignments in My. Labs. Plus � work on Study Skills in Strategies For Success workbook. � receive individual help from instructor and assistant. � Instructor � meets one on one with students, especially those that are falling behind or struggling to provide support. � Discussion topics include: Strengths of the student Challenges the student faces, including their personal lives Study skills that the student needs to further develop Resources available to the student Student progress in the class Major of study and career path

� Students �are actively engaged. �get help on exactly what they personally need � see instructor as their ally �learn about resources on campus to help them succeed �receive support and mentoring � Relationships between students and instructor/assistant become stronger

� The Teacher is the facilitator of learning not the deliverer. They are there to guide the students on their educational journey. � The students are empowered to take responsibility for their own learning and ownership of their education � The students feel a strong connection to their classmates, their school, the instructor and the assistant � Students are succeeding at higher rates!

�Class is 3 hours and 5 minutes � 0: 00 -0: 30 Review and Reinforce Concepts � 0: 30 -1: 40 Active Learning (Group Work) � 1: 40 -2: 00 Break � 2: 00 -3: 00 ALEKS � 3: 00 -3: 05 Collect i. Pads

� Previous § Homework Discuss one or two challenging homework questions � Respond to ALEKS Reports Model proper mathematical format § Practice algebra skills in groups (at desks or at the board) § � Reinforce § Previous Activity Objectives Mini follow up activity

� Students work through contextual situations Work in groups (both at their desks or at the board) �Given time to struggle and figure it out § � Students �present problems to the class or to their group �Put group’s answers on the board � Class discussion of answers
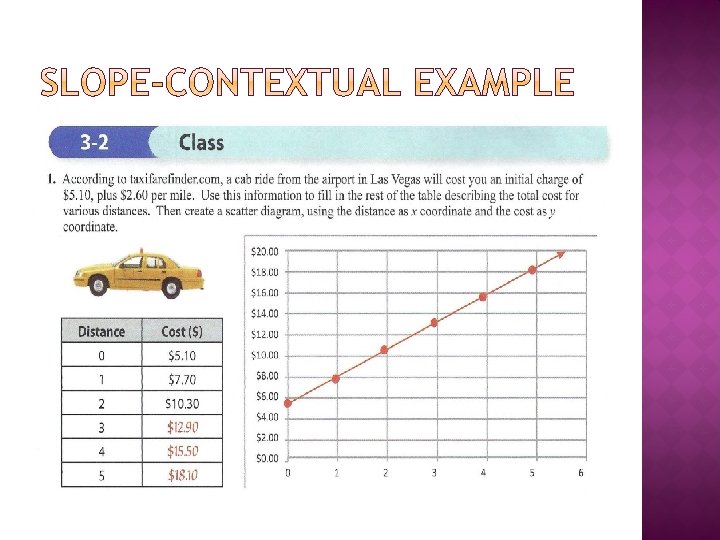

1. How much more will you pay for a 3 mile ride than for a 2 mile ride? $12. 90 - $10. 30 = $2. 60 2. How much more will you pay for a 5 mile ride than a 2 mile ride? Explain why that makes sense based on your answer to Question 1. $18. 10 - $10. 30 = $7. 80. The answer to question 1 shows that you’re paying $2. 60 per mile. So for a 3 mile ride, you would pay 3($2. 60) = $7. 80

3. Pick any two points on the graph that you drew, and subtract the second coordinates. Then divide the result by the difference of the first coordinate. What does the result represent about the cab ride? Using the points (5, 18. 10) and (2, 10. 30), we get 2. 60 This is the cost per mile of the cab ride. In dividing the difference of the two costs by the difference of the two distances in question 3, you found the rate of change of the cost as distance changes. When applied to the graph of a line, we call this number the Slope of the line.
 �ALEKS creates an individualized homework plan Student only")
� Initial Adaptive Assessment (First Day) �ALEKS creates an individualized homework plan Student only works on what he or she is ready to learn Less frustration Students work at their own pace, but have deadlines to keep them on track Practice algebraic concepts learned in the activities Learn new algebra skills Built in support. �Mastery learning and constant re-assessment Knowledge check after every 20 topics learned

� ALEKS In the Classroom �Students work on i. Pads �Student-Instructor Conferences o o o Get to know your students Discuss grades Guide students through a self-assessment In what area are you still struggling? § How do you feel _____ went? § What are some things you're noticing? § What are some steps you might take to improve this work? § o o o Refer students to campus resources Help students problem solve Students know you care

� ALEKS � Paper and pencil handouts and assessments � Study Skills Worksheets

� Paper �Daily o o and Pencil follow up assignments Applications Reflections �Weekly �Exam quizzes Reviews �Exams

�Study Skills Worksheets �Study Skill worksheets with the following benefits: These worksheets encourage students to: � Be actively engaged � Self-reflect � Gain valuable insights � Take ownership over their learning and success Offer great insight into what the student is dealing with Great conversation starters Helps you connect with your students Require very little class time and are easy to grade.

� What are the results? � What is the impact? � For who is it making the greatest impact?

Course Success and Retention Comparison. Spring 2015 n Completion Pass No Pass Math 081 483 77. 2% 52. 6% 24. 6% Math 083 168 79. 3% 64. 6% 14. 6% Math 084 160 77. 5% 47. 5% 30% Math 328 083/084 Combined 78. 3% 56. 4% 22. 2%

� Traditional and Redesign Comparison final exam study was conducted �Redesign students Underperformed 4 of the 20 items Outperformed 11 of the 20 items � Significantly-more than 5% of students

Item Total Exam 1 2 3 4 5 6 7 8 9 10 11 12 13 14 15 16 17 18 19 20 Overall Math 081 Percentage 67% Math 084 Percentage 69% 78% 88% 69% 45% 61% 17% 60% 61% 61% 84% 22% 61% 83% 50% 65% 52% 87% 71% 47% 61. 4% 83% 88% 77% 39% 78% 65% 48% 61% 86% 68% 51% 64% 57% 81% 68% 95% 79% 62% 69. 4% Topic Multiplication of Complex Numbers Rational Exponents Compound Inequalities Rational Expressions Difference of Cubes Logarithmic Equations Equation of line parallel to given Domain of a Rational Expression Graph of Quadratic Function Quadratic Inequality Evaluate Quadratic Function Simplifying Cube Roots Long Division Complex Fractions Rationalize Denominator Logarithm Properties Inverse Functions Evaluate Square Root Function Radical Equation Completing the Square

� Transfer �except course success is higher trigonometry. � Persistence � 64% for successful Redesigned Math � 25% for traditional pathway � Basic � 18% Skills Completion for Redesign � 9% for traditional pathway
 Non. Successful 33%")
Math 083/084 Math 081 Course Successful Liberal Arts Math 67% (6) Non. Successful 33% (3) 57% (16) Non. Successful 43% (11) Algebra 67% (6) 33% (3) 54% (13) 46% (11) Trigonometry 36% (4) 64% (7) 74% (17) 26% (6) Math for Prospective Teachers 100% (2) 0% Statistics 71% (12) 29% (5) 45% (15) 55% (18) Overall 62. 5% (30) 37. 5%(18) 58% (63) 42% (46)

Fall 2014 n Completed Intermediate Algebra Persisted to Transfer Successful transfer completion Persistence Rate Transfer Completion Rate Math 081 688 429 109 63 25% 9. 2% 75 48 30 64% 18% Math 167 083/084

� More than double the number of students completing basic skills math � In 2 years, over 3 times as many students will have completed basic skills vs. the traditional curriculum
 N Transfer-Ready 1566 602 Transfer Ready % 38.")
Fall 2013 -Spring 2015 (All Cohorts) N Transfer-Ready 1566 602 Transfer Ready % 38. 44% Basic Skills Complete 240 BSC % 15. 32%

Cohort Successful Basic Skills completion of Completion transfer course Rate Traditional Pathway 4238 480 11. 3% Redesigned Pathway 4238 1456 34. 4% Estimates for the redesigned pathway presuppose a 70% retention rate and a maximum of 3 course repetitions.

� Similar Ethnic Profiles � Women take Math 083 in higher proportion � Success Profiles vary greatly when taking race into consideration

Spring 2015 Current Algebra Sequence Math 083 Math 084 Math 083/084 Native American 50% (2) No data Asian 73. 3% (30) 60% (5) 100% (7) 83. 3% (12) African American 80% (5) 80%(5) No data 80% (5) Filipino 50% (8) 100% (1) 20% 42. 8% (4) Latino 49. 5% (386) 63. 9% (133) 44. 8% (125) 54. 7% (258) Multiple Ethnicity 100% (4) 50% (2) 33% (3) 40%(5) Pacific Islander 33. 3% (3) 50% (2) No data 50% (2) White (non. Latino) 64. 1% (39) 72. 7% (11) 50%(14) 60% (25)
 67. 9%(53)")
Math 081 Math 083 Math 084 Math 083/084 Male 54. 5% (232) 67. 9%(53) 46. 7% (75) 55. 5% (128) Female 51% (261) 63% (111) 47. 6% (84) 56. 4%(195)

90, 00% 80, 00% 70, 00% 60, 00% 50, 00% Traditional Pathway 40, 00% Redesign 30, 00% 20, 00% 10, 00% African American Native American Asian Latino Multi-Ethnic Pacific Islander White

� In Basic Skills Completion-Math, Latinos are disproportionately impacted � 80% of Basic Skills math students are Latino �Best practices for Latino students Clearly articulated pathways Eliminating attrition Increasing student-student, student-instructor interaction Increasing feedback �Shrinks the gaps to Basic Skills and Degree and Certificate Completion

� Janet Lechuga � Math 83 � Lechuga_janet@sac. edu � Lynn Marecek � Redesign Coordinator � Marecek_lynn@sac. edu � Lisa Mc. Kowan-Bourguignon � Math 84 � Mc. Kowan_lisa@sac. edu � George Sweeney � Redesign Assessment Coordinator � Sweeney_George@sac. edu
- Slides: 80