
JAKOBSHAVN ISBRAE GLACIER RETREAT IN GREENLAND FR 3262
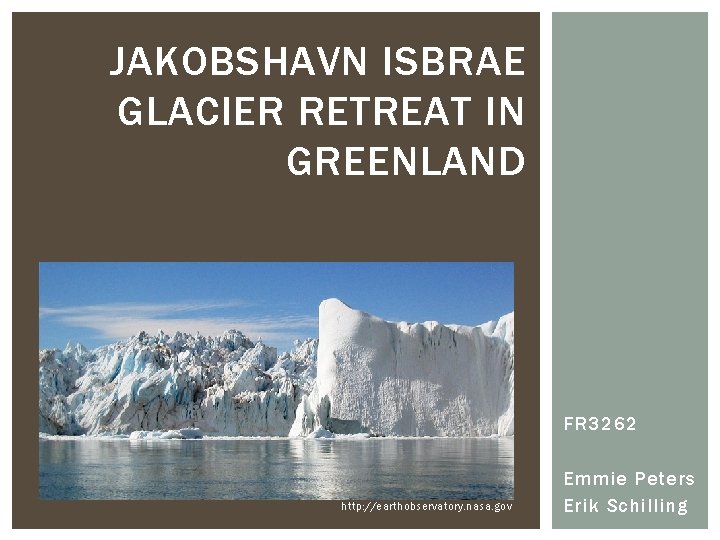
JAKOBSHAVN ISBRAE GLACIER RETREAT IN GREENLAND FR 3262 http: //earthobservatory. nasa. gov Emmie Peters Erik Schilling
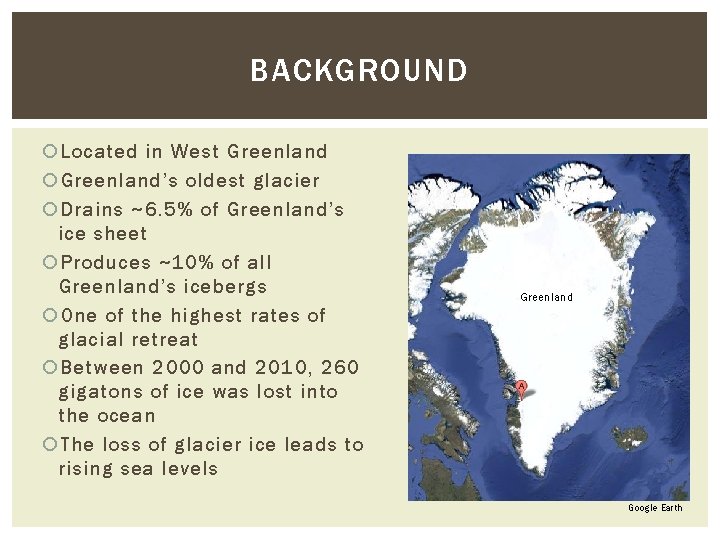
BACKGROUND Located in West Greenland’s oldest glacier Drains ~6. 5% of Greenland’s ice sheet Produces ~10% of all Greenland’s icebergs One of the highest rates of glacial retreat Between 2000 and 2010, 260 gigatons of ice was lost into the ocean The loss of glacier ice leads to rising sea levels Greenland Google Earth
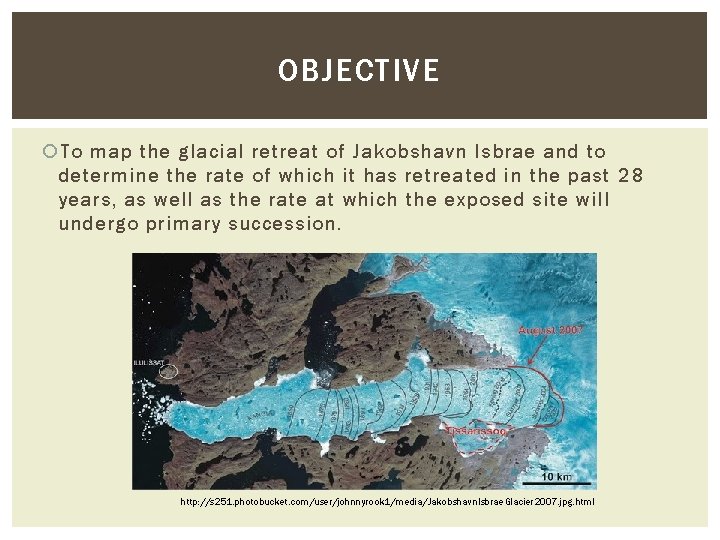
OBJECTIVE To map the glacial retreat of Jakobshavn Isbrae and to determine the rate of which it has retreated in the past 28 years, as well as the rate at which the exposed site will undergo primary succession. http: //s 251. photobucket. com/user/johnnyrook 1/media/Jakobshavn. Isbrae. Glacier 2007. jpg. html
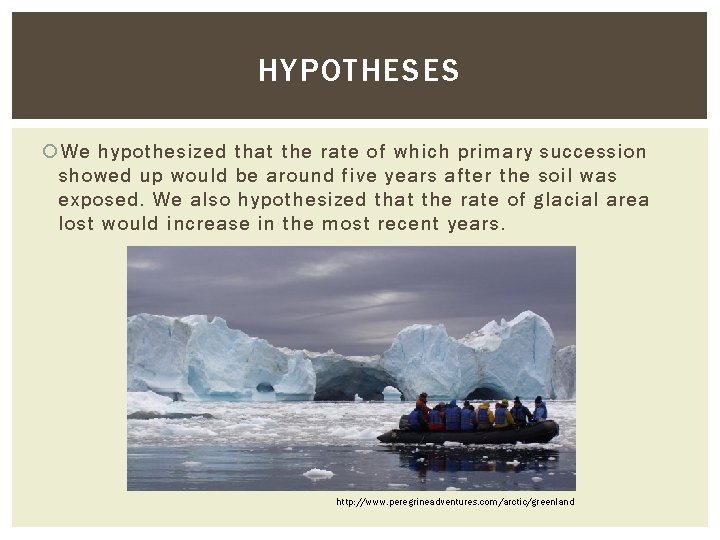
HYPOTHESES We hypothesized that the rate of which primary succession showed up would be around five years after the soil was exposed. We also hypothesized that the rate of glacial area lost would increase in the most recent years. http: //www. peregrineadventures. com/arctic/greenland
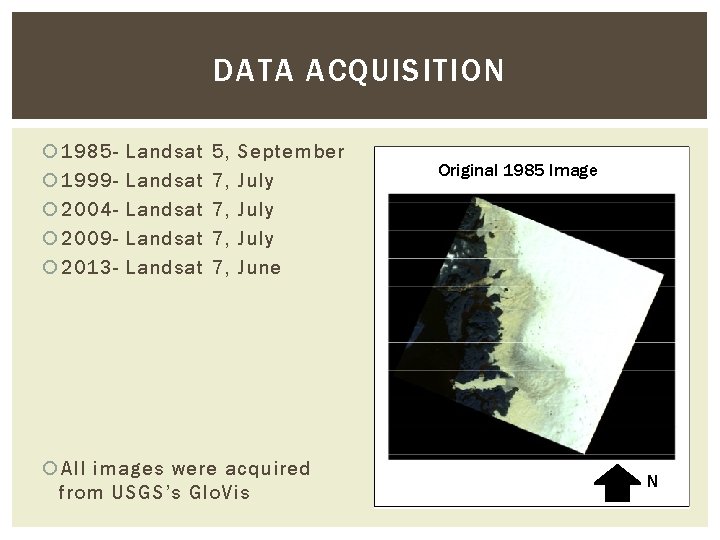
DATA ACQUISITION 1985 1999 2004 2009 2013 - Landsat Landsat 5, 7, 7, September July June All images were acquired from USGS’s Glo. Vis Original 1985 Image N
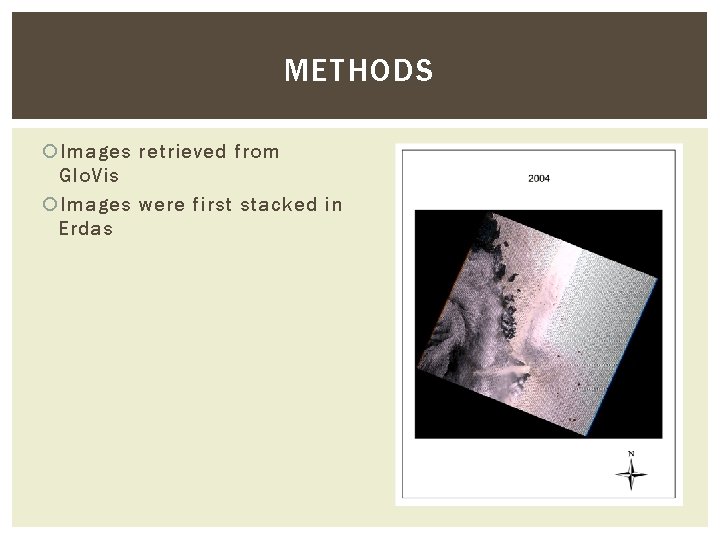
METHODS Images retrieved from Glo. Vis Images were first stacked in Erdas
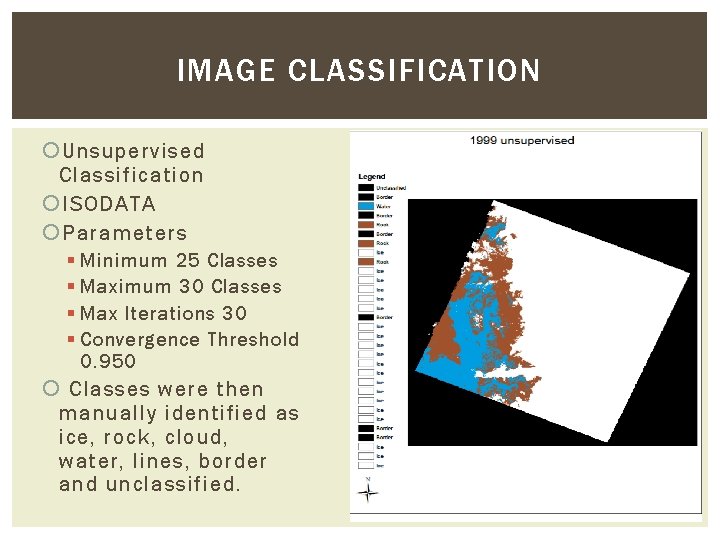
IMAGE CLASSIFICATION Unsupervised Classification ISODATA Parameters § Minimum 25 Classes § Maximum 30 Classes § Max Iterations 30 § Convergence Threshold 0. 950 Classes were then manually identified as ice, rock, cloud, water, lines, border and unclassified.
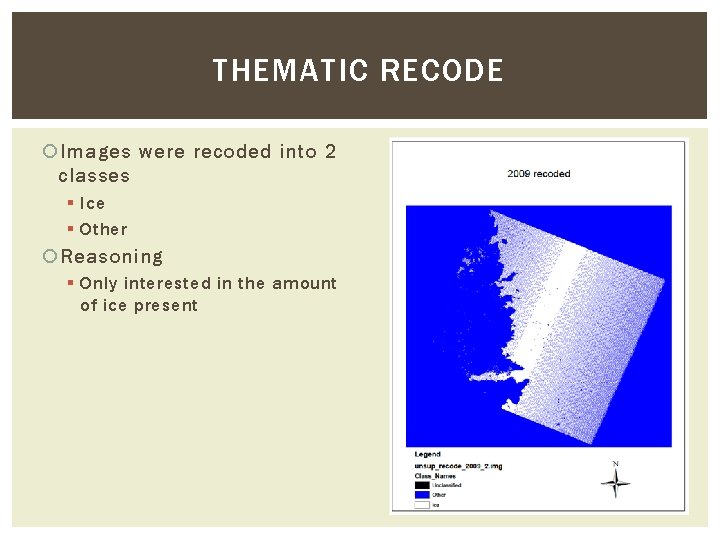
THEMATIC RECODE Images were recoded into 2 classes § Ice § Other Reasoning § Only interested in the amount of ice present
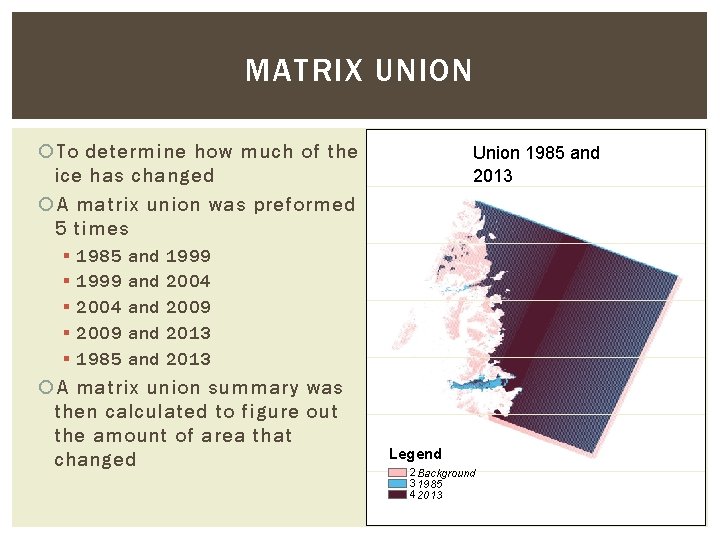
MATRIX UNION To determine how much of the ice has changed A matrix union was preformed 5 times § § § 1985 1999 2004 2009 1985 and and and Union 1985 and 2013 1999 2004 2009 2013 A matrix union summary was then calculated to figure out the amount of area that changed Legend 2 Background 3 1985 4 2013
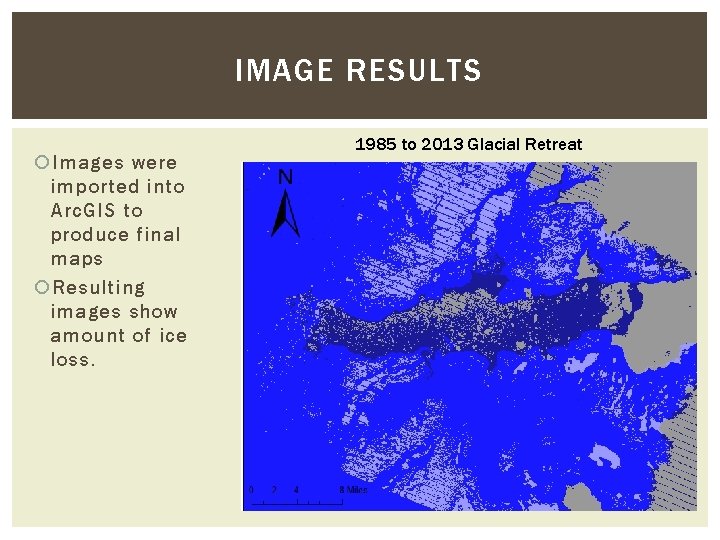
IMAGE RESULTS Images were imported into Arc. GIS to produce final maps Resulting images show amount of ice loss. 1985 to 2013 Glacial Retreat
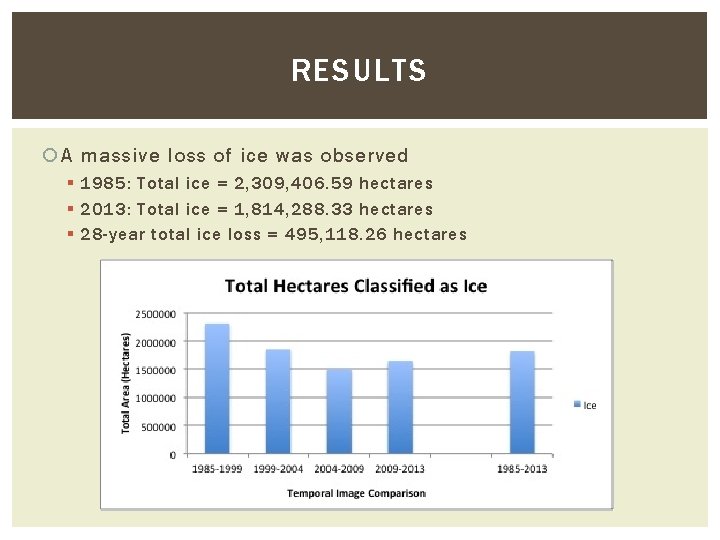
RESULTS A massive loss of ice was observed § 1985: Total ice = 2, 309, 406. 59 hectares § 2013: Total ice = 1, 814, 288. 33 hectares § 28 -year total ice loss = 495, 118. 26 hectares
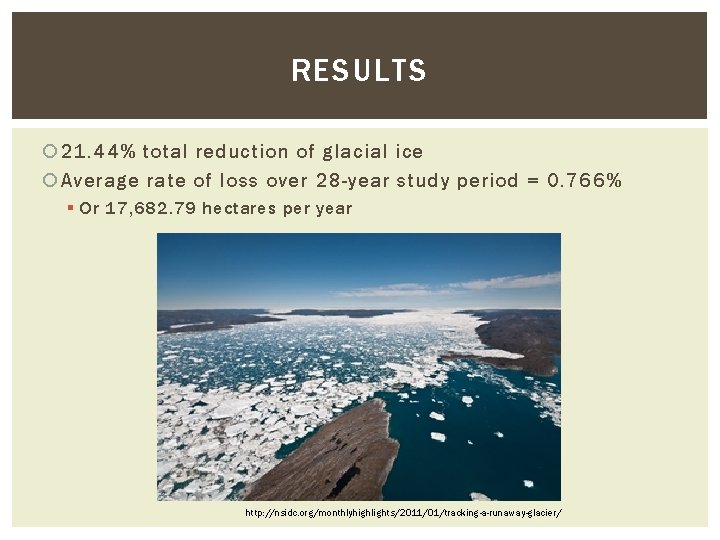
RESULTS 21. 44% total reduction of glacial ice Average rate of loss over 28 -year study period = 0. 766% § Or 17, 682. 79 hectares per year http: //nsidc. org/monthlyhighlights/2011/01/tracking-a-runaway-glacier/
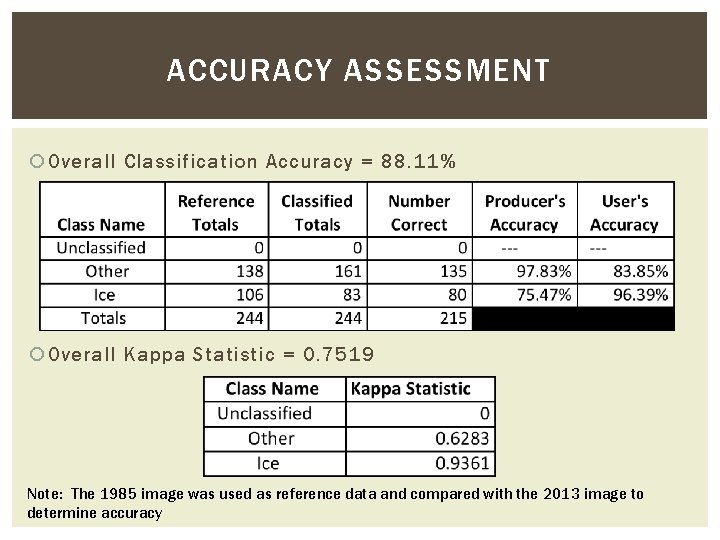
ACCURACY ASSESSMENT Overall Classification Accuracy = 88. 11% Overall Kappa Statistic = 0. 7519 Note: The 1985 image was used as reference data and compared with the 2013 image to determine accuracy
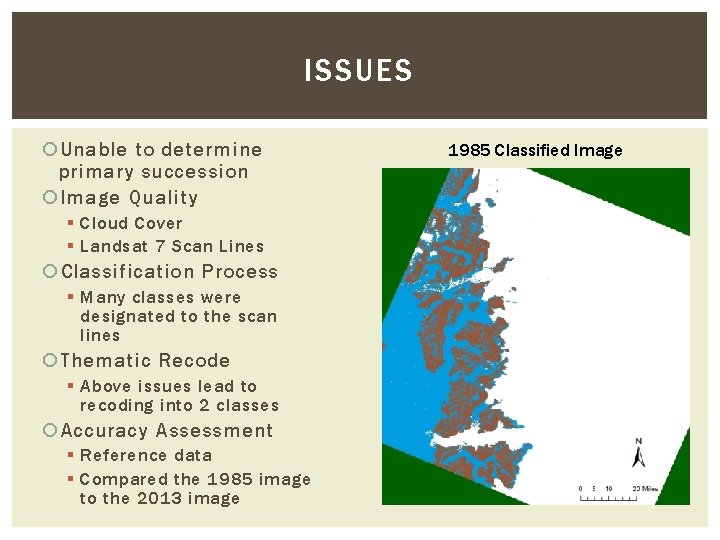
ISSUES Unable to determine primary succession Image Quality § Cloud Cover § Landsat 7 Scan Lines Classification Process § Many classes were designated to the scan lines Thematic Recode § Above issues lead to recoding into 2 classes Accuracy Assessment § Reference data § Compared the 1985 image to the 2013 image 1985 Classified Image
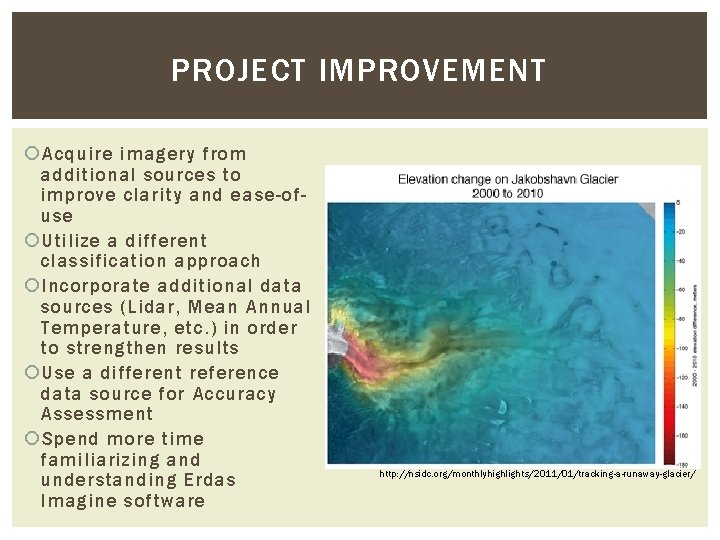
PROJECT IMPROVEMENT Acquire imagery from additional sources to improve clarity and ease-ofuse Utilize a different classification approach Incorporate additional data sources (Lidar, Mean Annual Temperature, etc. ) in order to strengthen results Use a different reference data source for Accuracy Assessment Spend more time familiarizing and understanding Erdas Imagine software http: //nsidc. org/monthlyhighlights/2011/01/tracking-a-runaway-glacier/
Thank You. http: //detlaphiltdic. blogspot. com/2010/07/huge-chunk-of-ice-breaks-off-of-glacier. html QUESTIONS?
- Slides: 16