Jagger IndustrialStrength Performance Testing Preface Report Performance Testing







- Slides: 38

Jagger Industrial-Strength Performance Testing

Preface

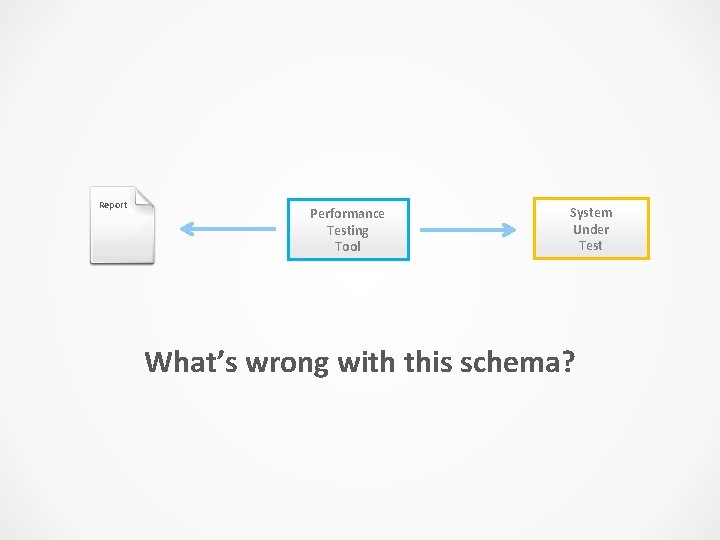
Report Performance Testing Tool System Under Test What’s wrong with this schema?

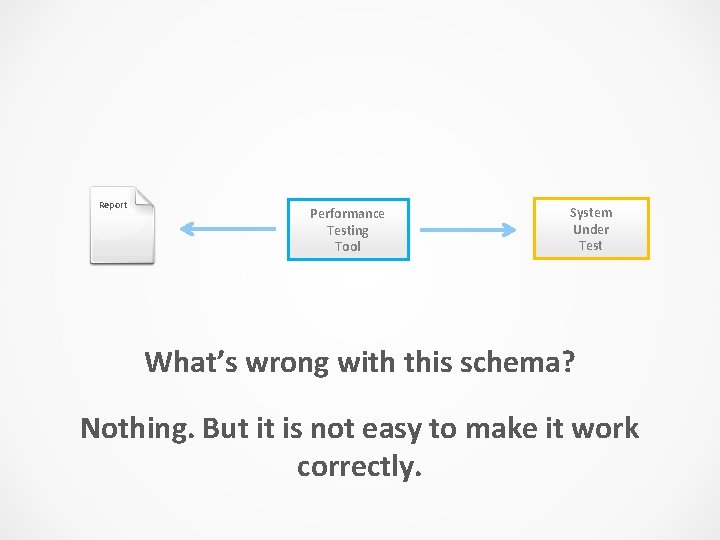
Report Performance Testing Tool System Under Test What’s wrong with this schema? Nothing. But it is not easy to make it work correctly.

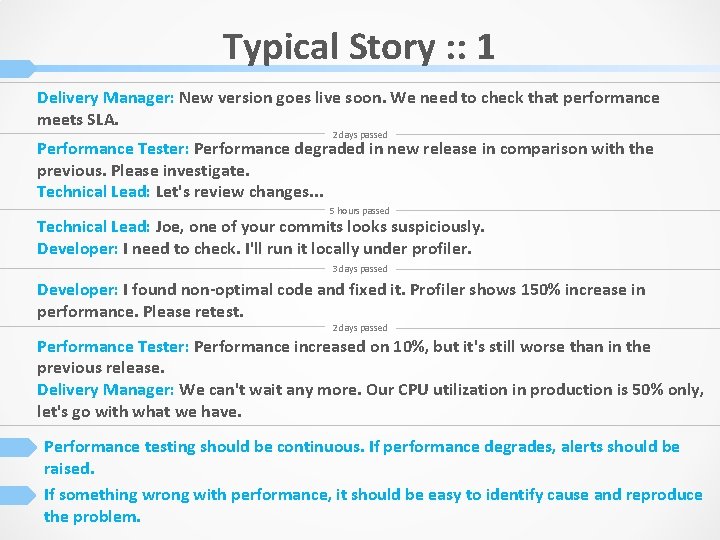
Typical Story : : 1 Delivery Manager: New version goes live soon. We need to check that performance meets SLA. 2 days passed Performance Tester: Performance degraded in new release in comparison with the previous. Please investigate. Technical Lead: Let's review changes. . . 5 hours passed Technical Lead: Joe, one of your commits looks suspiciously. Developer: I need to check. I'll run it locally under profiler. 3 days passed Developer: I found non-optimal code and fixed it. Profiler shows 150% increase in performance. Please retest. 2 days passed Performance Tester: Performance increased on 10%, but it's still worse than in the previous release. Delivery Manager: We can't wait any more. Our CPU utilization in production is 50% only, let's go with what we have. Performance testing should be continuous. If performance degrades, alerts should be raised. If something wrong with performance, it should be easy to identify cause and reproduce the problem.

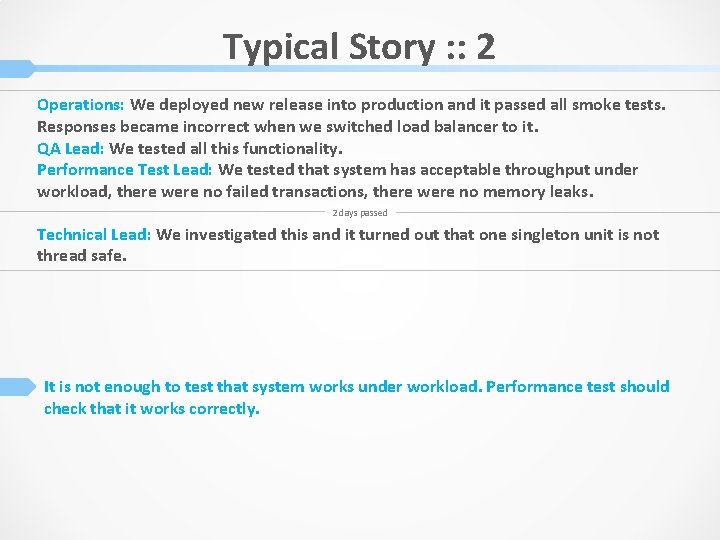
Typical Story : : 2 Operations: We deployed new release into production and it passed all smoke tests. Responses became incorrect when we switched load balancer to it. QA Lead: We tested all this functionality. Performance Test Lead: We tested that system has acceptable throughput under workload, there were no failed transactions, there were no memory leaks. 2 days passed Technical Lead: We investigated this and it turned out that one singleton unit is not thread safe. It is not enough to test that system works under workload. Performance test should check that it works correctly.

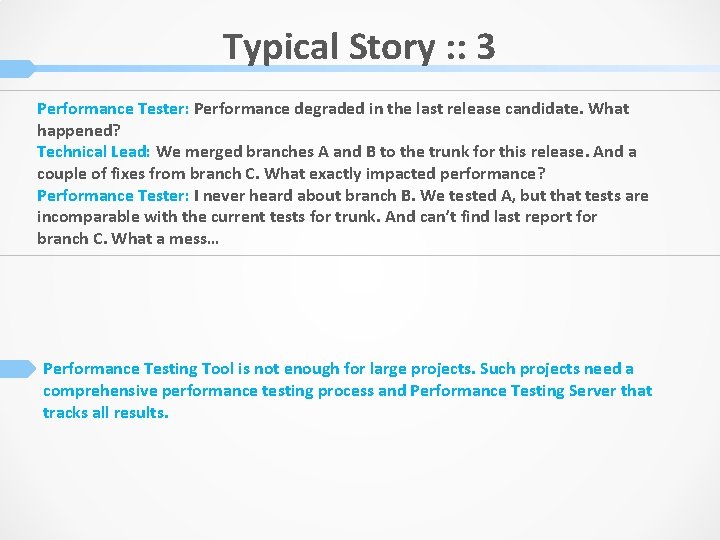
Typical Story : : 3 Performance Tester: Performance degraded in the last release candidate. What happened? Technical Lead: We merged branches A and B to the trunk for this release. And a couple of fixes from branch C. What exactly impacted performance? Performance Tester: I never heard about branch B. We tested A, but that tests are incomparable with the current tests for trunk. And can’t find last report for branch C. What a mess… Performance Testing Tool is not enough for large projects. Such projects need a comprehensive performance testing process and Performance Testing Server that tracks all results.

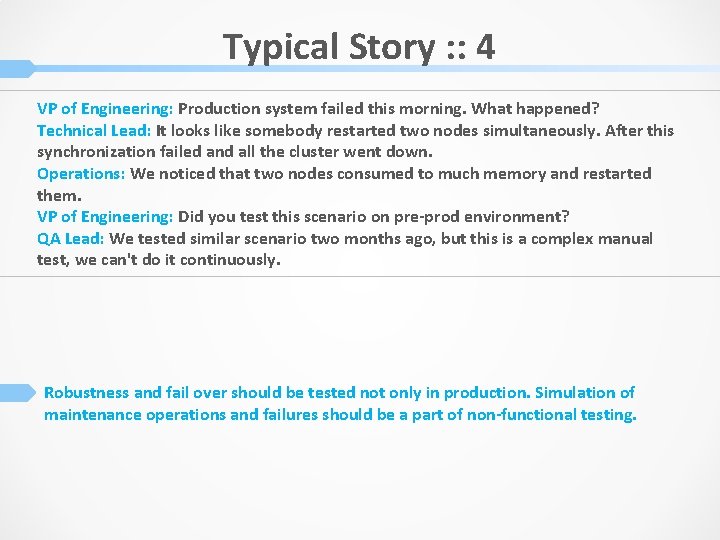
Typical Story : : 4 VP of Engineering: Production system failed this morning. What happened? Technical Lead: It looks like somebody restarted two nodes simultaneously. After this synchronization failed and all the cluster went down. Operations: We noticed that two nodes consumed to much memory and restarted them. VP of Engineering: Did you test this scenario on pre-prod environment? QA Lead: We tested similar scenario two months ago, but this is a complex manual test, we can't do it continuously. Robustness and fail over should be tested not only in production. Simulation of maintenance operations and failures should be a part of non-functional testing.

Jagger Overview

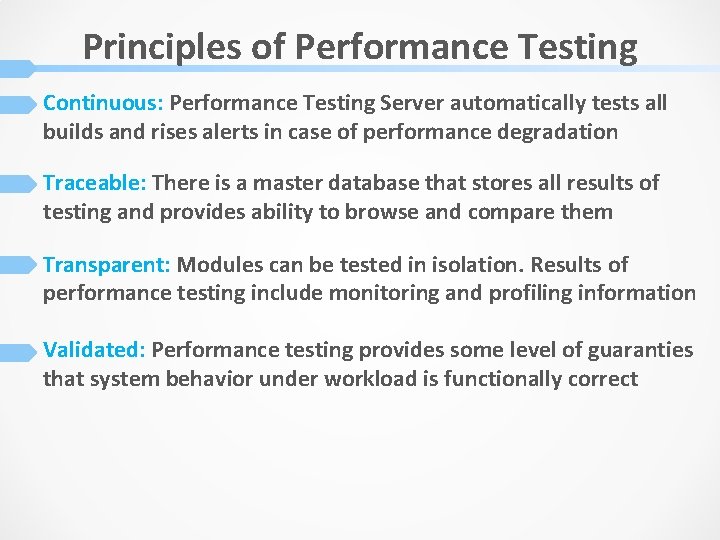
Principles of Performance Testing Continuous: Performance Testing Server automatically tests all builds and rises alerts in case of performance degradation Traceable: There is a master database that stores all results of testing and provides ability to browse and compare them Transparent: Modules can be tested in isolation. Results of performance testing include monitoring and profiling information Validated: Performance testing provides some level of guaranties that system behavior under workload is functionally correct

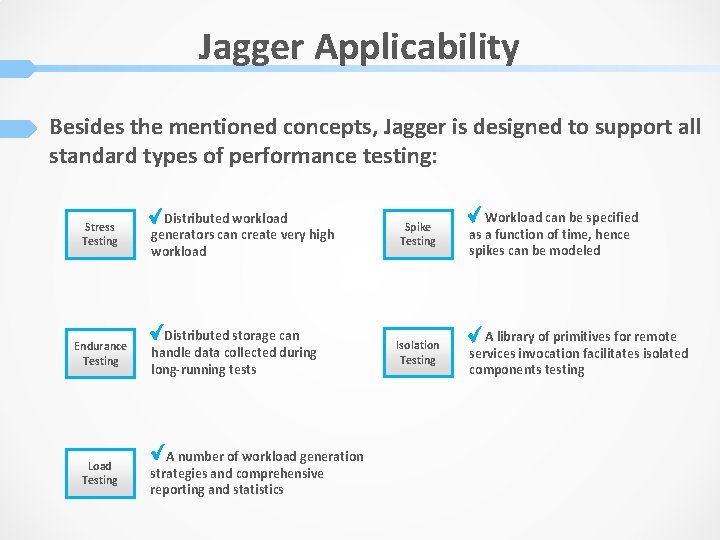
Jagger Applicability Besides the mentioned concepts, Jagger is designed to support all standard types of performance testing: Stress Testing Endurance Testing Load Testing Distributed workload generators can create very high workload Distributed storage can handle data collected during long-running tests A number of workload generation strategies and comprehensive reporting and statistics Spike Testing Isolation Testing Workload can be specified as a function of time, hence spikes can be modeled A library of primitives for remote services invocation facilitates isolated components testing

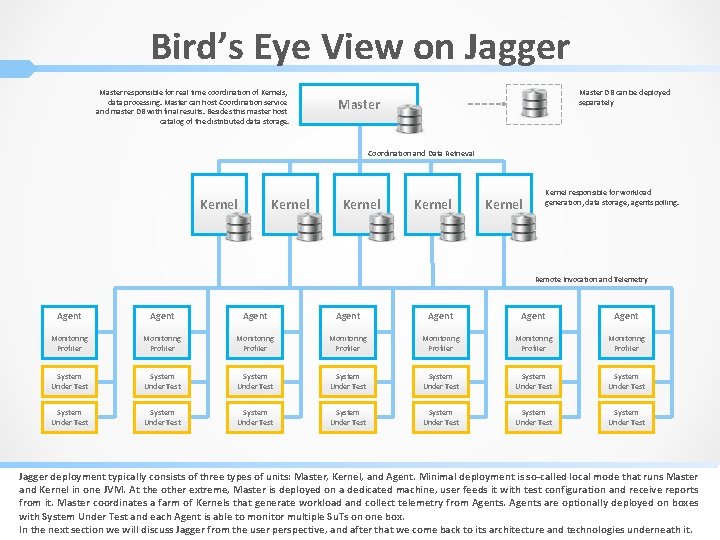
Bird’s Eye View on Jagger Master responsible for real time coordination of Kernels, data processing. Master can host Coordination service and master DB with final results. Besides this master host catalog of the distributed data storage. Master DB can be deployed separately Master Coordination and Data Retrieval Kernel Kernel responsible for workload generation, data storage, agents polling. Remote Invocation and Telemetry Agent Agent Monitoring Profiler Monitoring Profiler System Under Test System Under Test System Under Test System Under Test Jagger deployment typically consists of three types of units: Master, Kernel, and Agent. Minimal deployment is so-called local mode that runs Master and Kernel in one JVM. At the other extreme, Master is deployed on a dedicated machine, user feeds it with test configuration and receive reports from it. Master coordinates a farm of Kernels that generate workload and collect telemetry from Agents are optionally deployed on boxes with System Under Test and each Agent is able to monitor multiple Su. Ts on one box. In the next section we will discuss Jagger from the user perspective, and after that we come back to its architecture and technologies underneath it.

Features

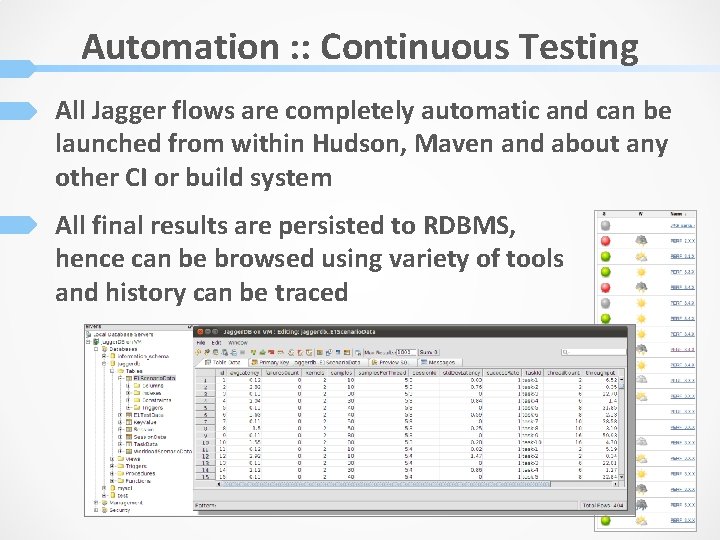
Automation : : Continuous Testing All Jagger flows are completely automatic and can be launched from within Hudson, Maven and about any other CI or build system All final results are persisted to RDBMS, hence can be browsed using variety of tools and history can be traced

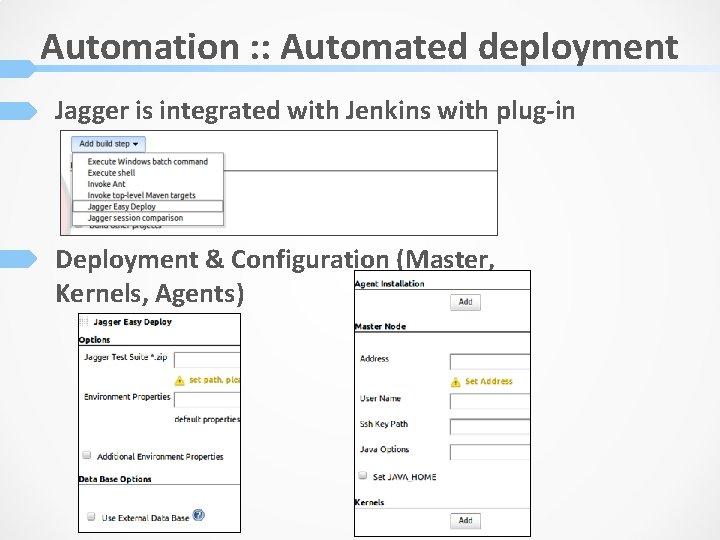
Automation : : Automated deployment Jagger is integrated with Jenkins with plug-in Deployment & Configuration (Master, Kernels, Agents)

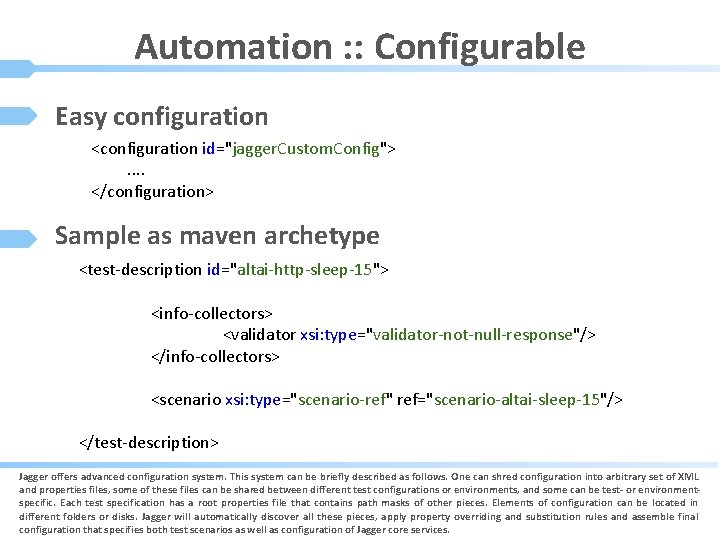
Automation : : Configurable Easy configuration <configuration id="jagger. Custom. Config">. . </configuration> Sample as maven archetype <test-description id="altai-http-sleep-15"> <info-collectors> <validator xsi: type="validator-not-null-response"/> </info-collectors> <scenario xsi: type="scenario-ref" ref="scenario-altai-sleep-15"/> </test-description> Jagger offers advanced configuration system. This system can be briefly described as follows. One can shred configuration into arbitrary set of XML and properties files, some of these files can be shared between different test configurations or environments, and some can be test- or environmentspecific. Each test specification has a root properties file that contains path masks of other pieces. Elements of configuration can be located in different folders or disks. Jagger will automatically discover all these pieces, apply property overriding and substitution rules and assemble final configuration that specifies both test scenarios as well as configuration of Jagger core services.

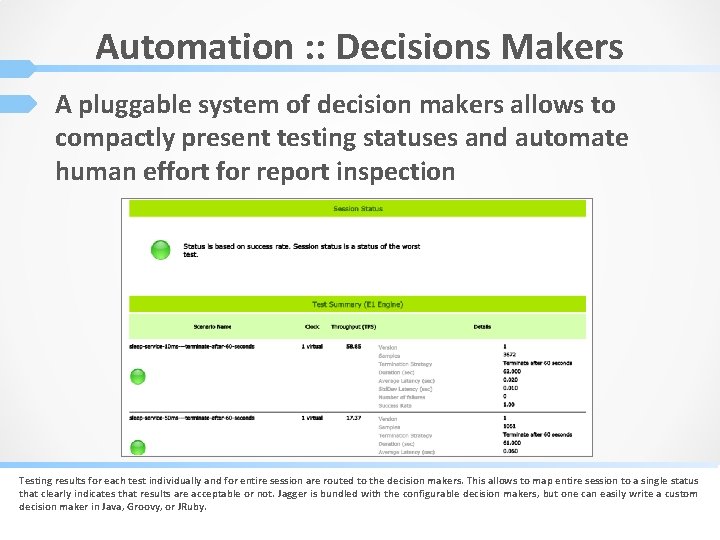
Automation : : Decisions Makers A pluggable system of decision makers allows to compactly present testing statuses and automate human effort for report inspection Testing results for each test individually and for entire session are routed to the decision makers. This allows to map entire session to a single status that clearly indicates that results are acceptable or not. Jagger is bundled with the configurable decision makers, but one can easily write a custom decision maker in Java, Groovy, or JRuby.

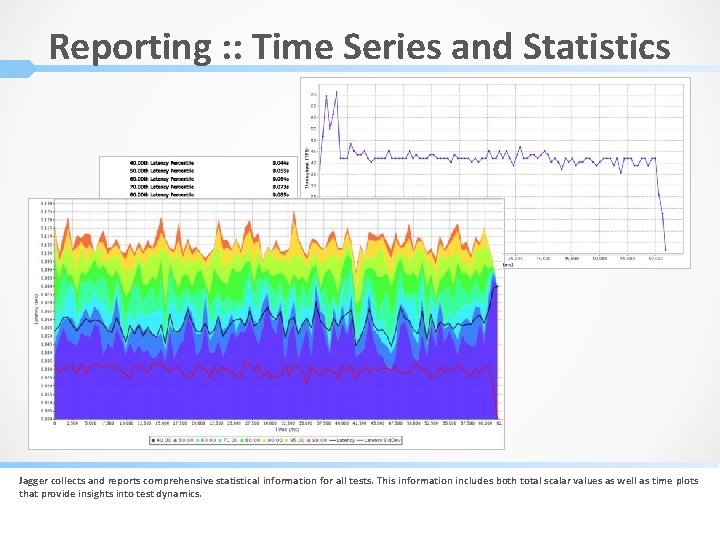
Reporting : : Time Series and Statistics Jagger collects and reports comprehensive statistical information for all tests. This information includes both total scalar values as well as time plots that provide insights into test dynamics.

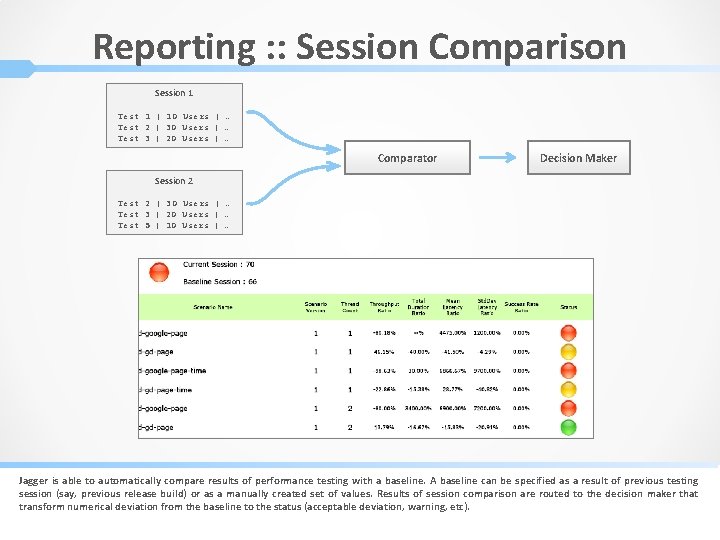
Reporting : : Session Comparison Session 1 Test 1 | 10 Users | … Test 2 | 30 Users | … Test 3 | 20 Users | … Comparator Decision Maker Session 2 Test 2 | 30 Users | … Test 3 | 20 Users | … Test 5 | 10 Users | … Jagger is able to automatically compare results of performance testing with a baseline. A baseline can be specified as a result of previous testing session (say, previous release build) or as a manually created set of values. Results of session comparison are routed to the decision maker that transform numerical deviation from the baseline to the status (acceptable deviation, warning, etc).

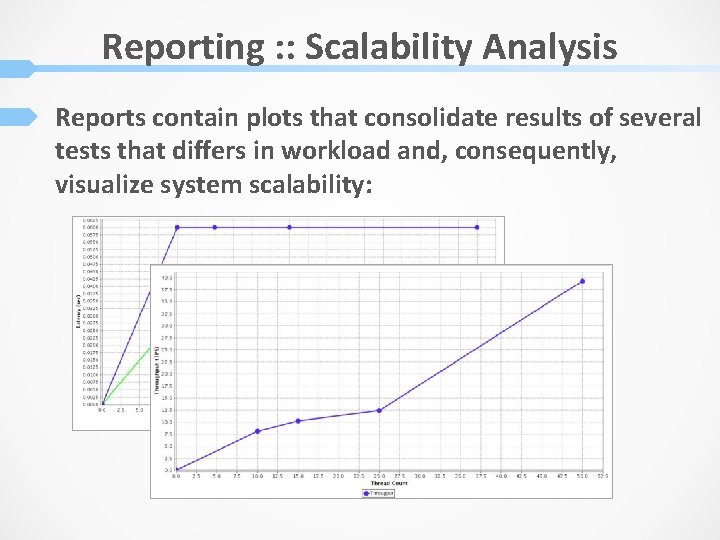
Reporting : : Scalability Analysis Reports contain plots that consolidate results of several tests that differs in workload and, consequently, visualize system scalability:

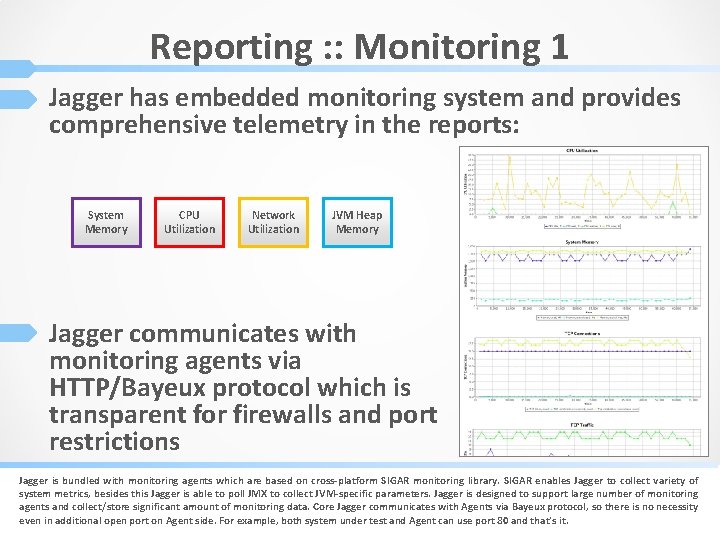
Reporting : : Monitoring 1 Jagger has embedded monitoring system and provides comprehensive telemetry in the reports: System Memory CPU Utilization Network Utilization JVM Heap Memory Jagger communicates with monitoring agents via HTTP/Bayeux protocol which is transparent for firewalls and port restrictions Jagger is bundled with monitoring agents which are based on cross-platform SIGAR monitoring library. SIGAR enables Jagger to collect variety of system metrics, besides this Jagger is able to poll JMX to collect JVM-specific parameters. Jagger is designed to support large number of monitoring agents and collect/store significant amount of monitoring data. Core Jagger communicates with Agents via Bayeux protocol, so there is no necessity even in additional open port on Agent side. For example, both system under test and Agent can use port 80 and that’s it.

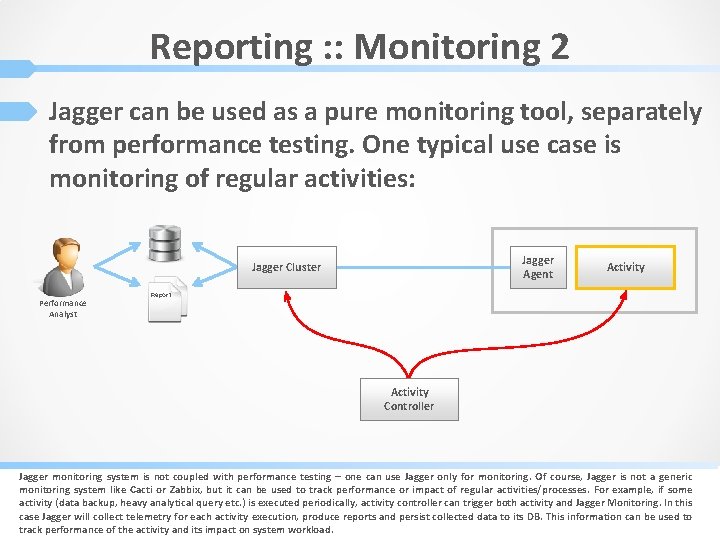
Reporting : : Monitoring 2 Jagger can be used as a pure monitoring tool, separately from performance testing. One typical use case is monitoring of regular activities: Jagger Agent Jagger Cluster Performance Analyst Activity Report Activity Controller Jagger monitoring system is not coupled with performance testing – one can use Jagger only for monitoring. Of course, Jagger is not a generic monitoring system like Cacti or Zabbix, but it can be used to track performance or impact of regular activities/processes. For example, if some activity (data backup, heavy analytical query etc. ) is executed periodically, activity controller can trigger both activity and Jagger Monitoring. In this case Jagger will collect telemetry for each activity execution, produce reports and persist collected data to its DB. This information can be used to track performance of the activity and its impact on system workload.

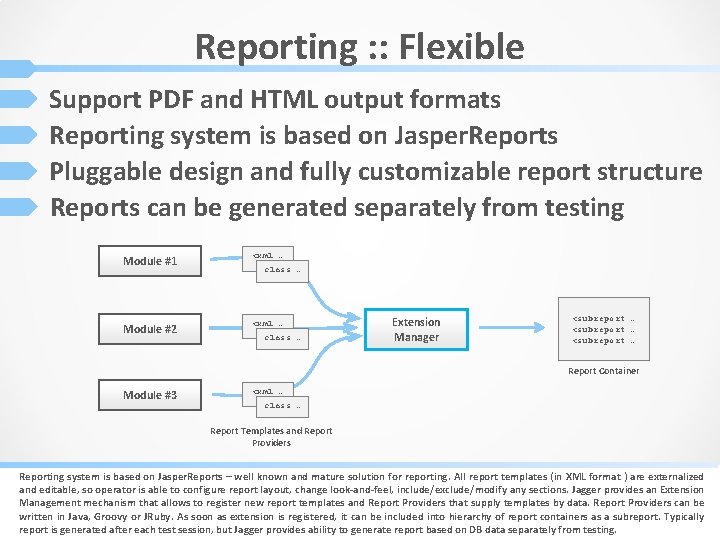
Reporting : : Flexible Support PDF and HTML output formats Reporting system is based on Jasper. Reports Pluggable design and fully customizable report structure Reports can be generated separately from testing Module #1 <xml … Module #2 <xml … class … Extension Manager <subreport … Report Container Module #3 <xml … class … Report Templates and Report Providers Reporting system is based on Jasper. Reports – well known and mature solution for reporting. All report templates (in XML format ) are externalized and editable, so operator is able to configure report layout, change look-and-feel, include/exclude/modify any sections. Jagger provides an Extension Management mechanism that allows to register new report templates and Report Providers that supply templates by data. Report Providers can be written in Java, Groovy or JRuby. As soon as extension is registered, it can be included into hierarchy of report containers as a subreport. Typically report is generated after each test session, but Jagger provides ability to generate report based on DB data separately from testing.

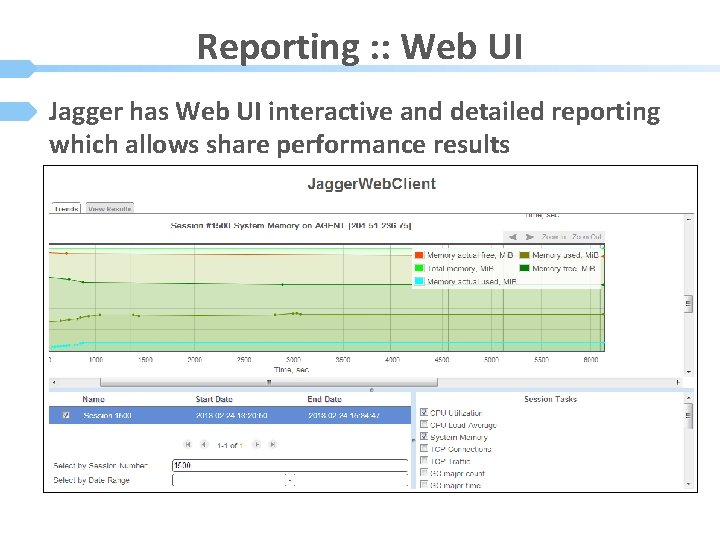
Reporting : : Web UI Jagger has Web UI interactive and detailed reporting which allows share performance results

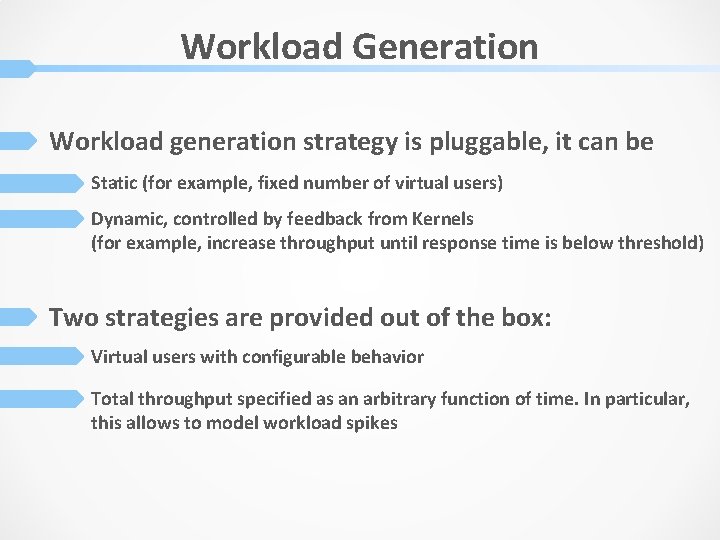
Workload Generation Workload generation strategy is pluggable, it can be Static (for example, fixed number of virtual users) Dynamic, controlled by feedback from Kernels (for example, increase throughput until response time is below threshold) Two strategies are provided out of the box: Virtual users with configurable behavior Total throughput specified as an arbitrary function of time. In particular, this allows to model workload spikes

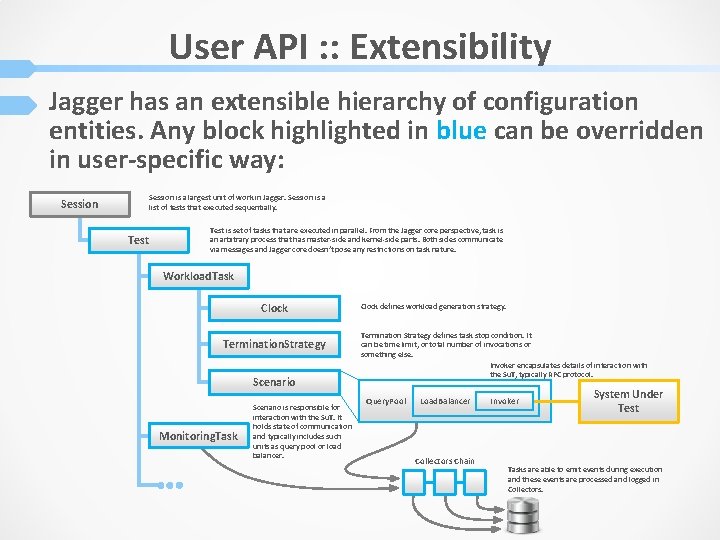
User API : : Extensibility Jagger has an extensible hierarchy of configuration entities. Any block highlighted in blue can be overridden in user-specific way: Session is a largest unit of work in Jagger. Session is a list of tests that executed sequentially. Session Test is set of tasks that are executed in parallel. From the Jagger core perspective, task is an arbitrary process that has master-side and kernel-side parts. Both sides communicate via messages and Jagger core doesn’t pose any restrictions on task nature. Workload. Task Clock Termination. Strategy Scenario Monitoring. Task Scenario is responsible for interaction with the Su. T. It holds state of communication and typically includes such units as query pool or load balancer. Clock defines workload generation strategy. Termination Strategy defines task stop condition. It can be time limit, or total number of invocations or something else. Invoker encapsulates details of interaction with the Su. T, typically RPC protocol. Query. Pool Load. Balancer Collectors Chain Invoker System Under Test Tasks are able to emit events during execution and these events are processed and logged in Collectors.

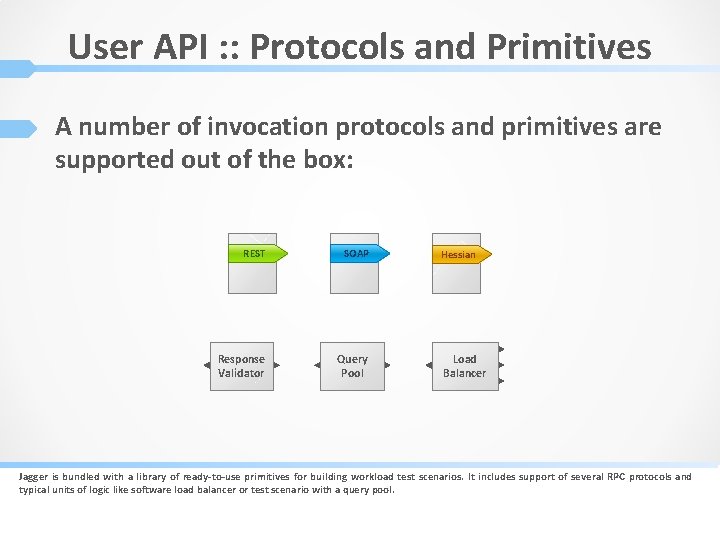
User API : : Protocols and Primitives A number of invocation protocols and primitives are supported out of the box: REST SOAP Response Validator Query Pool Hessian Load Balancer Jagger is bundled with a library of ready-to-use primitives for building workload test scenarios. It includes support of several RPC protocols and typical units of logic like software load balancer or test scenario with a query pool.

User API : : Validation Jagger provide ability to validate responses of System Under Test in two ways: An invocation listener can be added to perform custom checks If query pool is known before test, Jagger can automatically collect responses for each query in single-user fashion before test and then check that system returns the same responses under workload.

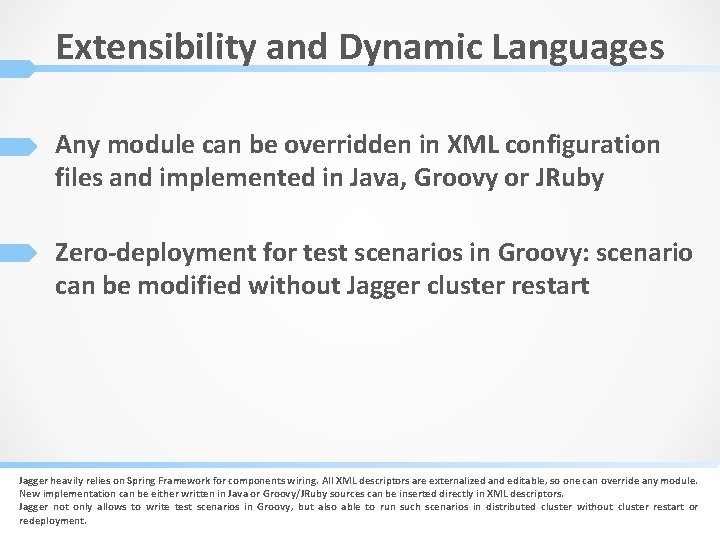
Extensibility and Dynamic Languages Any module can be overridden in XML configuration files and implemented in Java, Groovy or JRuby Zero-deployment for test scenarios in Groovy: scenario can be modified without Jagger cluster restart Jagger heavily relies on Spring Framework for components wiring. All XML descriptors are externalized and editable, so one can override any module. New implementation can be either written in Java or Groovy/JRuby sources can be inserted directly in XML descriptors. Jagger not only allows to write test scenarios in Groovy, but also able to run such scenarios in distributed cluster without cluster restart or redeployment.

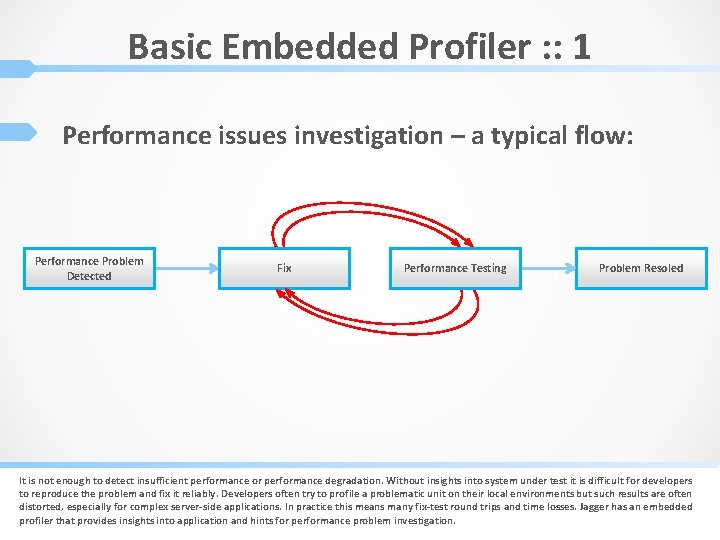
Basic Embedded Profiler : : 1 Performance issues investigation – a typical flow: Performance Problem Detected Fix Performance Testing Problem Resoled It is not enough to detect insufficient performance or performance degradation. Without insights into system under test it is difficult for developers to reproduce the problem and fix it reliably. Developers often try to profile a problematic unit on their local environments but such results are often distorted, especially for complex server-side applications. In practice this means many fix-test round trips and time losses. Jagger has an embedded profiler that provides insights into application and hints for performance problem investigation.

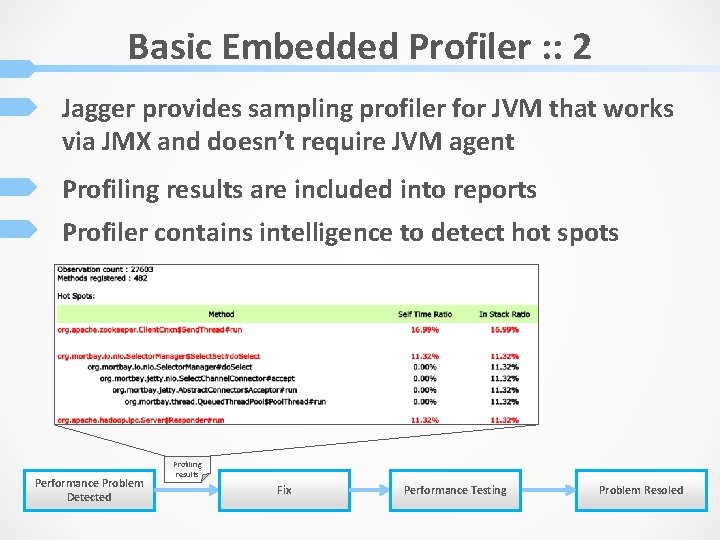
Basic Embedded Profiler : : 2 Jagger provides sampling profiler for JVM that works via JMX and doesn’t require JVM agent Profiling results are included into reports Profiler contains intelligence to detect hot spots Performance Problem Detected Profiling results Fix Performance Testing Problem Resoled

Distributed Platform Workload generation is distributed. Master continuously polls Kernels statuses and adjust workload if necessary. Data storage is distributed. This provides both scalability and write performance due to data locality. Monitoring Agents are supervised by Kernels, so high number of systems can be monitored without bottleneck in a single receiver of monitoring information.

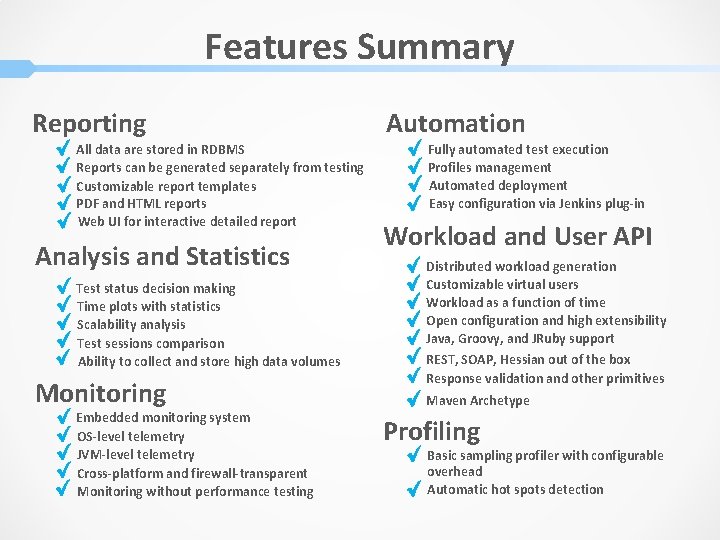
Features Summary Reporting All data are stored in RDBMS Reports can be generated separately from testing Customizable report templates PDF and HTML reports Web UI for interactive detailed report Analysis and Statistics Test status decision making Time plots with statistics Scalability analysis Test sessions comparison Ability to collect and store high data volumes Monitoring Embedded monitoring system OS-level telemetry JVM-level telemetry Cross-platform and firewall-transparent Monitoring without performance testing Automation Fully automated test execution Profiles management Automated deployment Easy configuration via Jenkins plug-in Workload and User API Distributed workload generation Customizable virtual users Workload as a function of time Open configuration and high extensibility Java, Groovy, and JRuby support REST, SOAP, Hessian out of the box Response validation and other primitives Maven Archetype Profiling Basic sampling profiler with configurable overhead Automatic hot spots detection

Jagger Roadmap

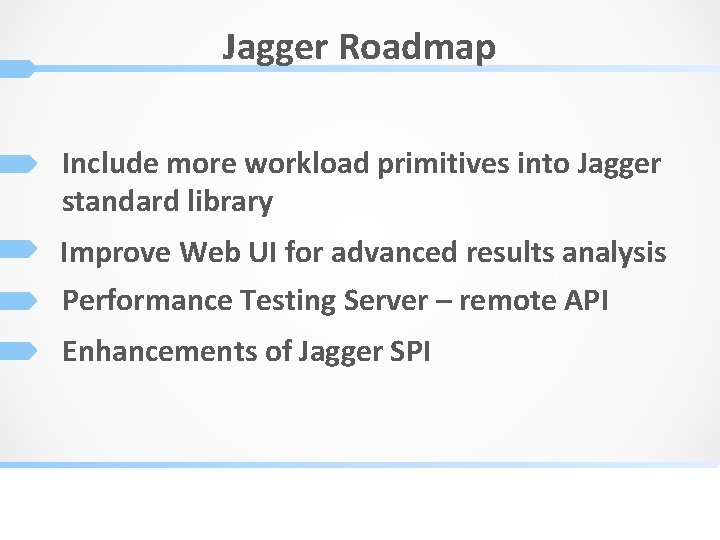
Jagger Roadmap Include more workload primitives into Jagger standard library Improve Web UI for advanced results analysis Performance Testing Server – remote API Enhancements of Jagger SPI

Join Jagger

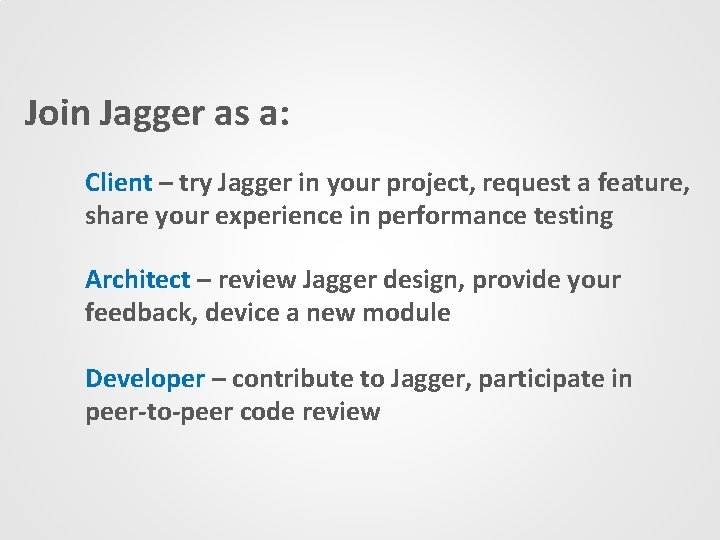
Join Jagger as a: Client – try Jagger in your project, request a feature, share your experience in performance testing Architect – review Jagger design, provide your feedback, device a new module Developer – contribute to Jagger, participate in peer-to-peer code review

Contact Us jagger@griddynamics. com Distribution and Documentation https: //jagger. griddynamics. net/