
Jacek Wallusch Introduction to Econometrics Lecture 4 Count

- Slides: 13
Jacek Wallusch _________________ Introduction to Econometrics Lecture 4: Count Data Models
definitions Count Data ______________________________________________ Count 1. to name numbers in regular order; 2. to have a specified value [a touchdown counts for six points]*; Integer 1. anything complete in itself; entity; 2. any positice or negative whole number or zero; It. E: 4 Webster’s New World College Dictionary * That’s Webster as well!!!
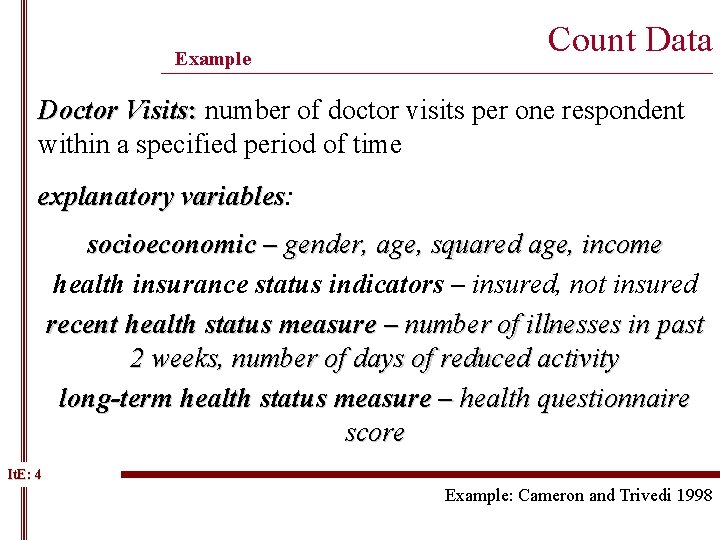
Example Count Data ______________________________________________ Doctor Visits: number of doctor visits per one respondent within a specified period of time explanatory variables: variables socioeconomic – gender, age, squared age, income health insurance status indicators – insured, not insured recent health status measure – number of illnesses in past 2 weeks, number of days of reduced activity long-term health status measure – health questionnaire score It. E: 4 Example: Cameron and Trivedi 1998
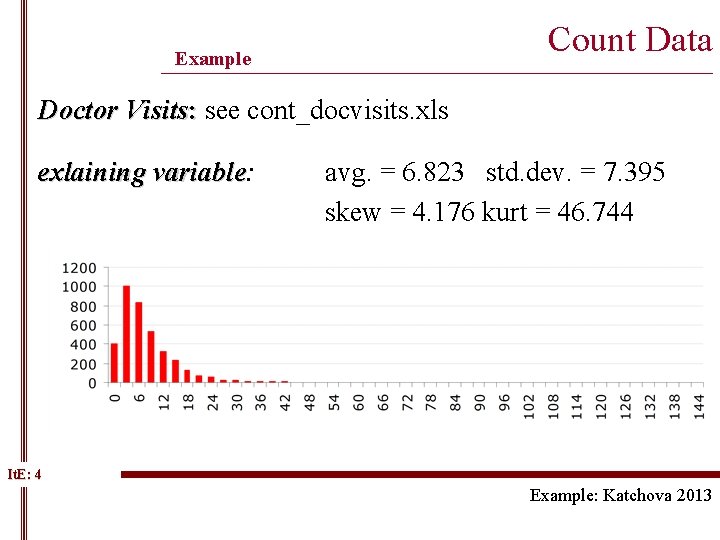
Count Data Example ______________________________________________ Doctor Visits: see cont_docvisits. xls exlaining variable: variable avg. = 6. 823 std. dev. = 7. 395 skew = 4. 176 kurt = 46. 744 It. E: 4 Example: Katchova 2013
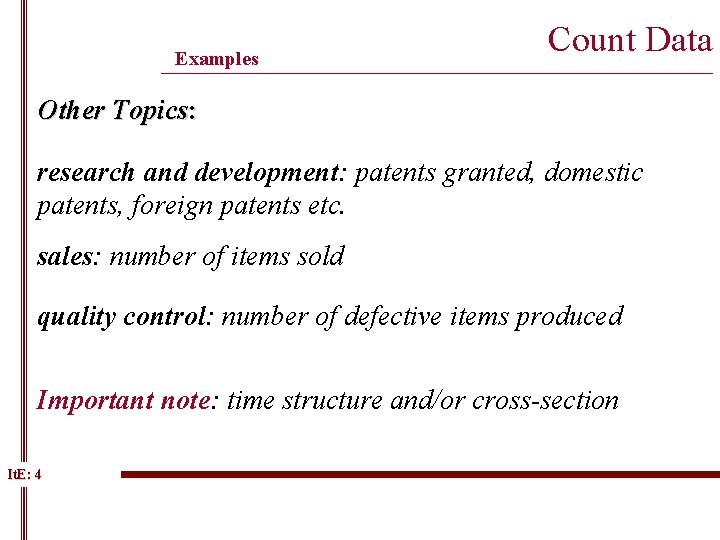
Examples Count Data ______________________________________________ Other Topics: research and development: patents granted, domestic patents, foreign patents etc. sales: number of items sold quality control: number of defective items produced Important note: time structure and/or cross-section It. E: 4
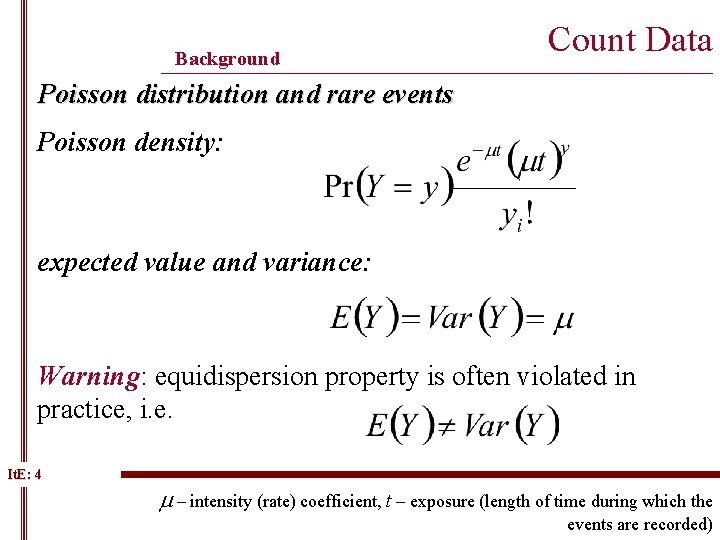
Background Count Data ______________________________________________ Poisson distribution and rare events Poisson density: expected value and variance: Warning: equidispersion property is often violated in practice, i. e. It. E: 4 m – intensity (rate) coefficient, t – exposure (length of time during which the events are recorded)
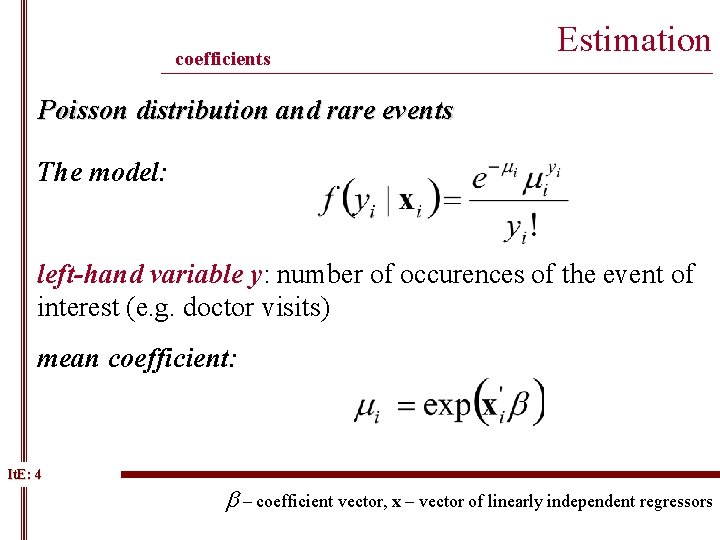
coefficients Estimation ______________________________________________ Poisson distribution and rare events The model: left-hand variable y: number of occurences of the event of interest (e. g. doctor visits) mean coefficient: It. E: 4 b – coefficient vector, x – vector of linearly independent regressors
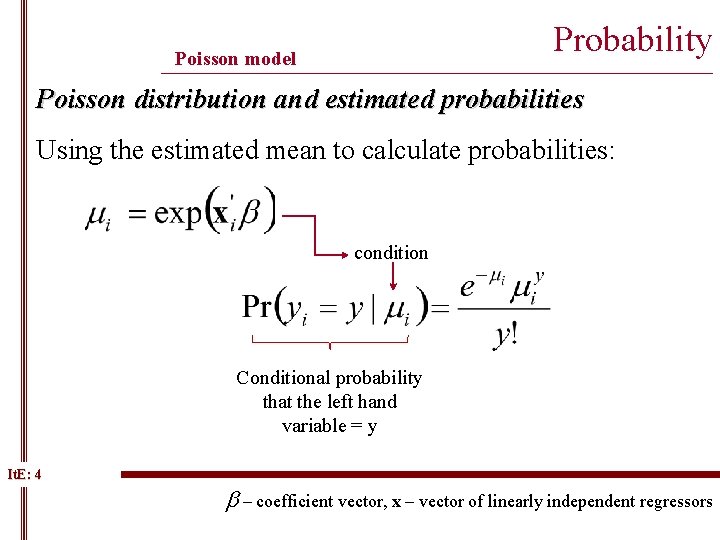
Probability Poisson model ______________________________________________ Poisson distribution and estimated probabilities Using the estimated mean to calculate probabilities: condition Conditional probability that the left hand variable = y It. E: 4 b – coefficient vector, x – vector of linearly independent regressors
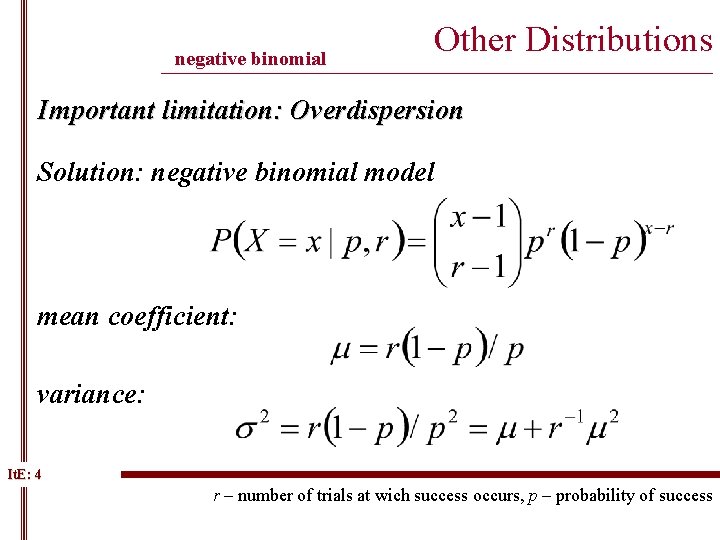
negative binomial Other Distributions ______________________________________________ Important limitation: Overdispersion Solution: negative binomial model mean coefficient: variance: It. E: 4 r – number of trials at wich success occurs, p – probability of success
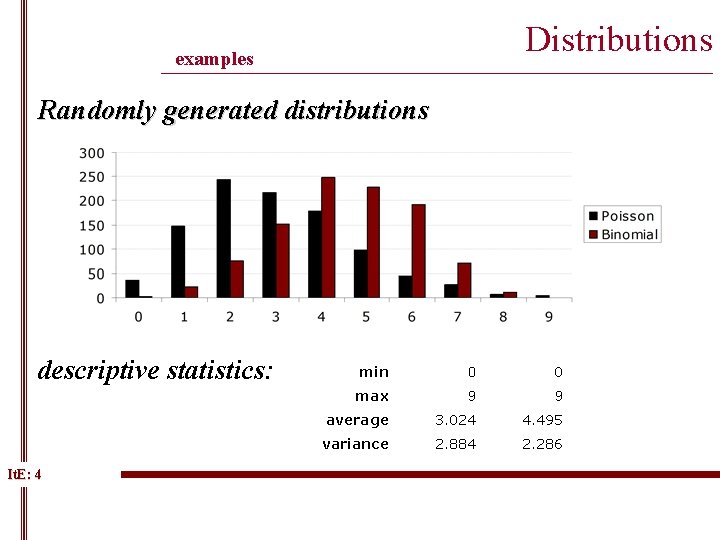
Distributions examples ______________________________________________ Randomly generated distributions descriptive statistics: It. E: 4 min 0 0 max 9 9 average 3. 024 4. 495 variance 2. 884 2. 286
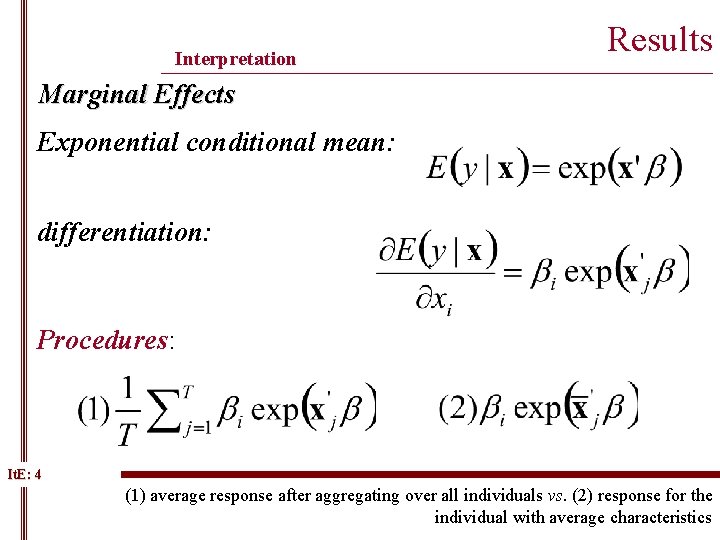
Interpretation Results ______________________________________________ Marginal Effects Exponential conditional mean: differentiation: Procedures: It. E: 4 (1) average response after aggregating over all individuals vs. (2) response for the individual with average characteristics
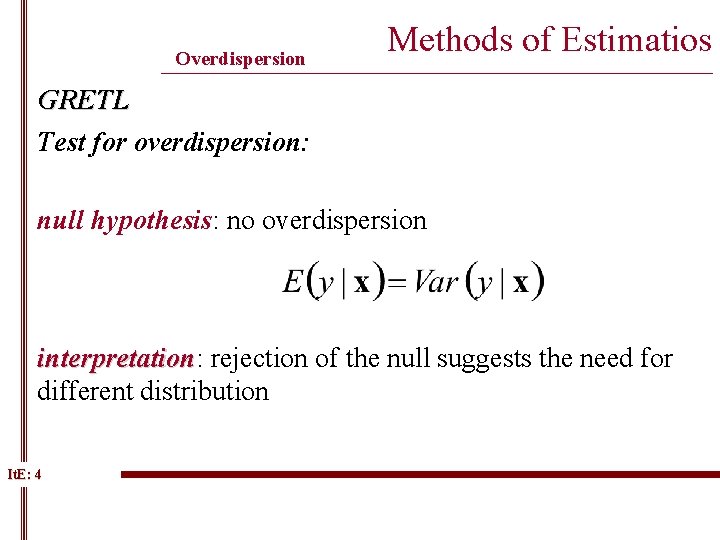
Overdispersion Methods of Estimatios ______________________________________________ GRETL Test for overdispersion: null hypothesis: no overdispersion interpretation: interpretation rejection of the null suggests the need for different distribution It. E: 4
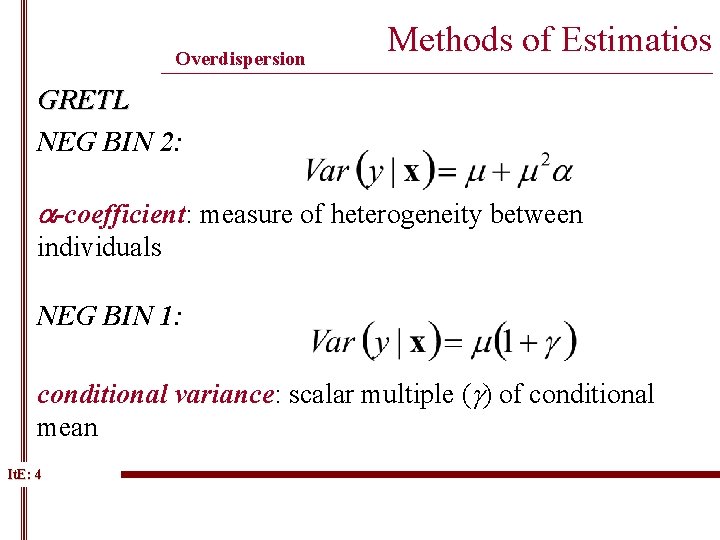
Overdispersion Methods of Estimatios ______________________________________________ GRETL NEG BIN 2: a-coefficient: measure of heterogeneity between individuals NEG BIN 1: conditional variance: scalar multiple (g) of conditional mean It. E: 4