
ITTEHAD CHEMICALS LIMITED Reaching New Heights Corporate Briefing
ITTEHAD CHEMICALS LIMITED Reaching New Heights. . Corporate Briefing For the Period Ended 31 March 2019.
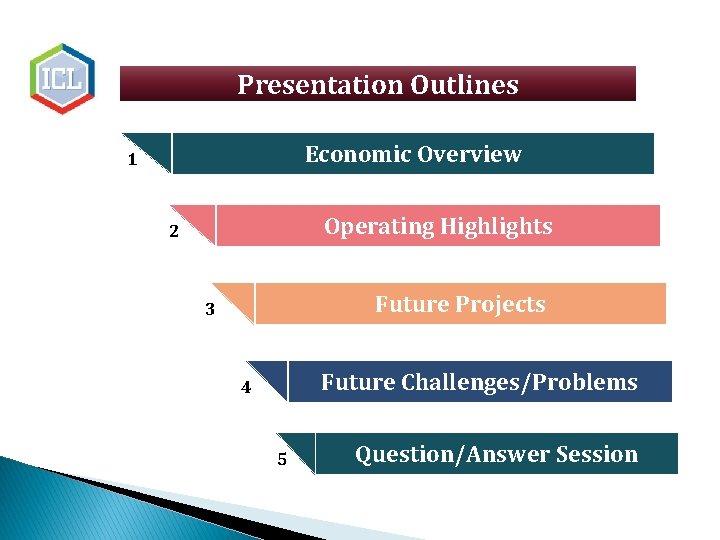
Presentation Outlines Economic Overview 1 Operating Highlights 2 Future Projects 3 Future Challenges/Problems 4 5 Question/Answer Session
Economic Overview
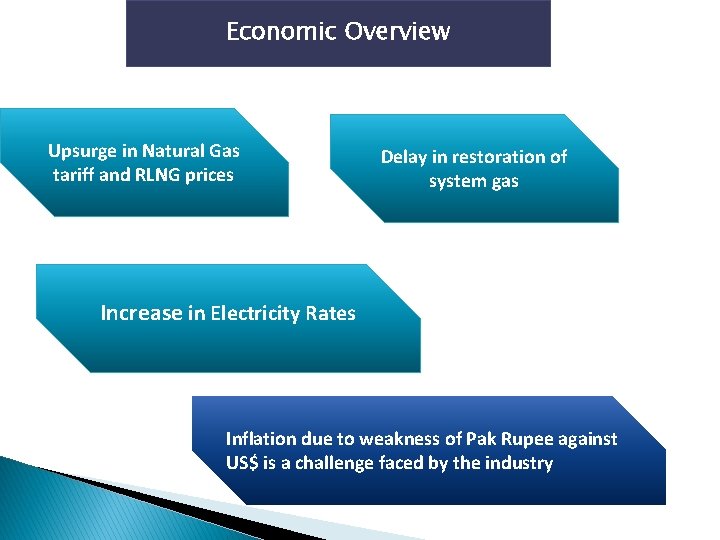
Economic Overview Upsurge in Natural Gas tariff and RLNG prices Delay in restoration of system gas Increase in Electricity Rates Inflation due to weakness of Pak Rupee against US$ is a challenge faced by the industry
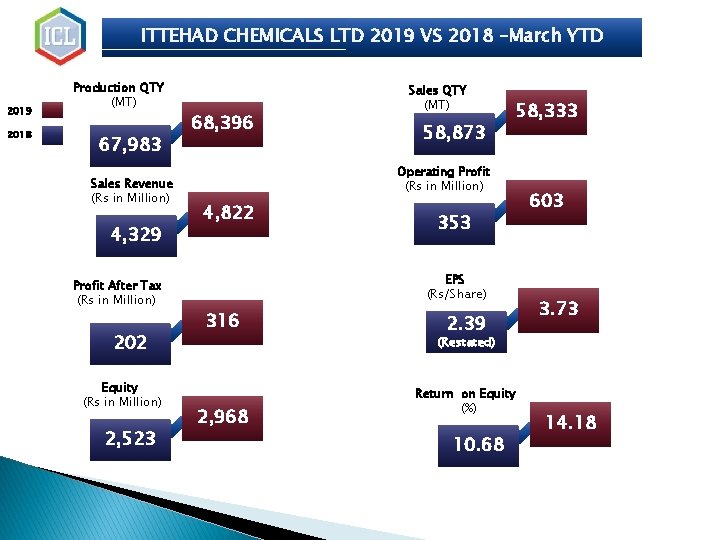
ITTEHAD CHEMICALS LTD 2019 VS 2018 –March YTD 2019 2018 Production QTY (MT) 67, 983 Sales Revenue (Rs in Million) 4, 329 Profit After Tax (Rs in Million) 202 Equity (Rs in Million) 2, 523 68, 396 Sales QTY (MT) 58, 873 58, 333 Operating Profit (Rs in Million) 4, 822 353 EPS (Rs/Share) 316 2, 968 2. 39 603 3. 73 (Restated) Return on Equity (%) 10. 68 14. 18
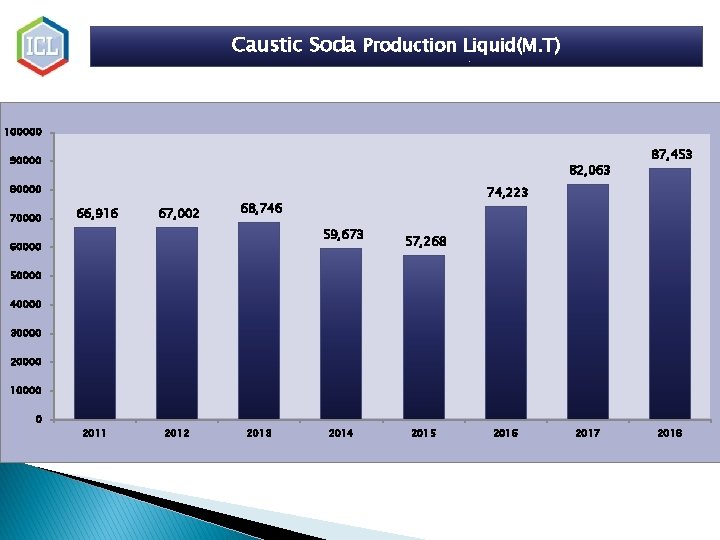
Caustic Soda Production Liquid(M. T) 100000 90000 82, 063 80000 70000 66, 916 67, 002 74, 223 68, 746 59, 673 60000 87, 453 57, 268 50000 40000 30000 20000 10000 0 2011 2012 2013 2014 2015 2016 2017 2018
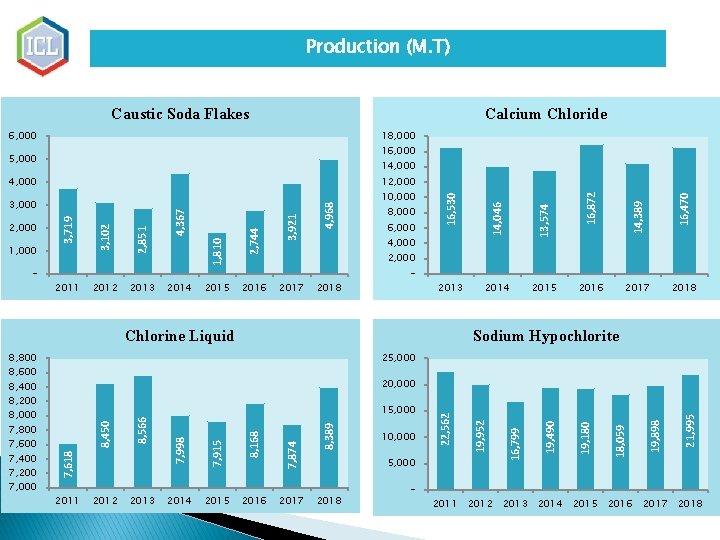
Production (M. T) Caustic Soda Flakes Calcium Chloride 6, 000 18, 000 16, 000 5, 000 14, 000 2015 2016 16, 470 14, 389 2015 2, 000 2017 2018 - 2013 Chlorine Liquid 2016 2017 2018 Sodium Hypochlorite 25, 000 2012 2013 2016 2017 2018 - 21, 995 19, 898 18, 059 19, 180 19, 490 16, 799 5, 000 19, 952 10, 000 22, 562 8, 389 2015 7, 874 2014 8, 168 7, 915 2011 15, 000 7, 998 8, 566 8, 450 20, 000 7, 618 8, 800 8, 600 8, 400 8, 200 8, 000 7, 800 7, 600 7, 400 7, 200 7, 000 2014 4, 000 16, 872 6, 000 16, 530 8, 000 13, 574 2014 4, 968 2013 3, 921 2012 10, 000 14, 046 2011 1, 810 - 2, 851 1, 000 3, 102 2, 000 3, 719 3, 000 2, 744 12, 000 4, 367 4, 000 2011 2012 2013 2014 2015 2016 2017 2018
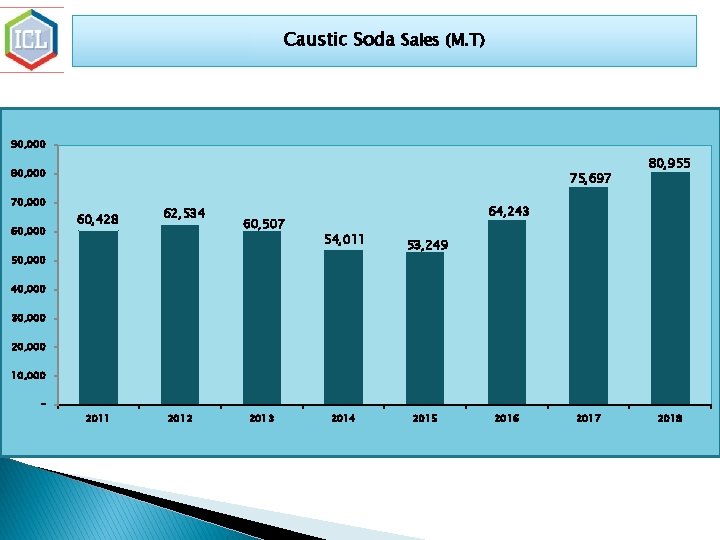
Caustic Soda Sales (M. T) 90, 000 80, 000 75, 697 70, 000 60, 428 62, 534 60, 507 80, 955 64, 243 54, 011 50, 000 53, 249 40, 000 30, 000 20, 000 10, 000 - 2011 2012 2013 2014 2015 2016 2017 2018
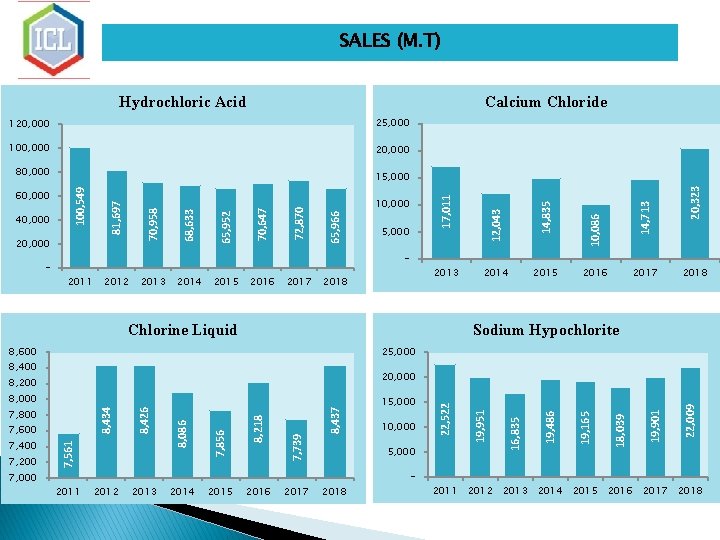
SALES (M. T) Hydrochloric Acid Calcium Chloride 120, 000 25, 000 100, 000 20, 000 80, 000 2011 2012 2013 2014 2015 2016 2017 2013 2018 Chlorine Liquid 2017 20, 323 14, 713 10, 086 2018 2011 2012 2013 2014 2015 2016 2017 2018 - 22, 009 19, 901 18, 039 5, 000 19, 165 10, 000 19, 486 15, 000 16, 835 8, 437 7, 739 8, 218 7, 856 7, 561 7, 600 8, 086 8, 434 7, 800 8, 426 8, 000 22, 522 20, 000 8, 200 7, 000 2015 25, 000 8, 400 7, 200 2014 Sodium Hypochlorite 8, 600 7, 400 14, 835 5, 000 12, 043 17, 011 65, 966 72, 870 70, 647 10, 000 19, 951 - 65, 952 20, 000 68, 633 70, 958 81, 697 40, 000 100, 549 60, 000 15, 000 2011 2012 2013 2014 2015 2016 2017 2018
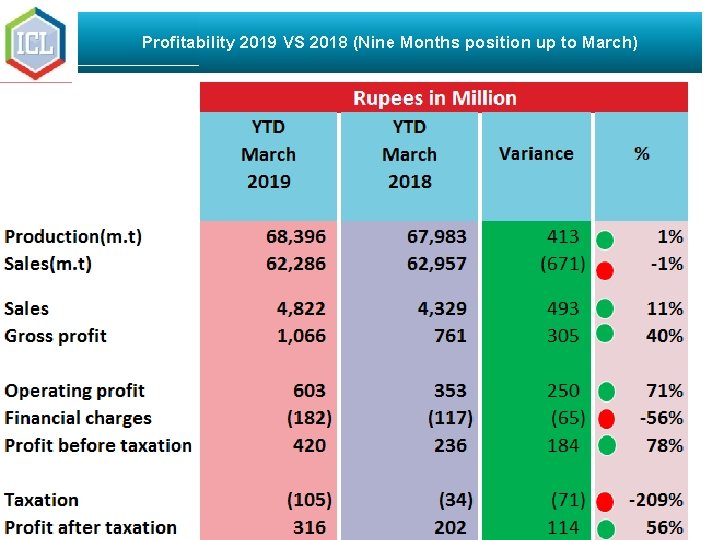
Profitability 2019 VS 2018 (Nine Months position up to March)
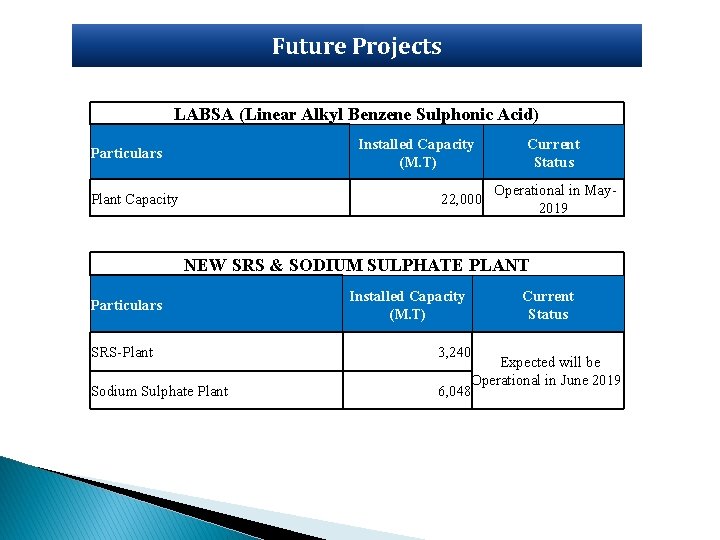
Future Projects LABSA (Linear Alkyl Benzene Sulphonic Acid) Installed Capacity (M. T) Particulars Plant Capacity 22, 000 Current Status Operational in May 2019 NEW SRS & SODIUM SULPHATE PLANT Particulars SRS-Plant Sodium Sulphate Plant Installed Capacity (M. T) 3, 240 Current Status Expected will be Operational in June 2019. 6, 048
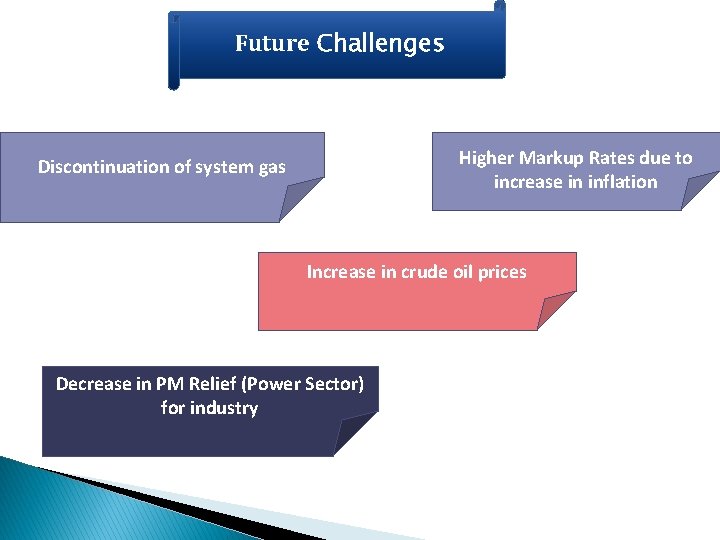
Future Challenges Higher Markup Rates due to increase in inflation Discontinuation of system gas Increase in crude oil prices Decrease in PM Relief (Power Sector) for industry
- Slides: 12