
ITK Performance Visualization UNC COMP 523 Projects Matt

- Slides: 8
ITK Performance Visualization UNC COMP 523 Projects Matt Mc. Cormick, Ph. D, Kitware, Inc January 16 th, 2019
The Insight Toolkit (ITK) • The Insight Segmentation and Registration Toolkit (ITK) is an open-source, freely available, cross-platform system for N-dimensional image analysis • Extensive suite of algorithms for processing, registering, segmenting, analyzing, and quantifying scientific data. • https: //itk. org/
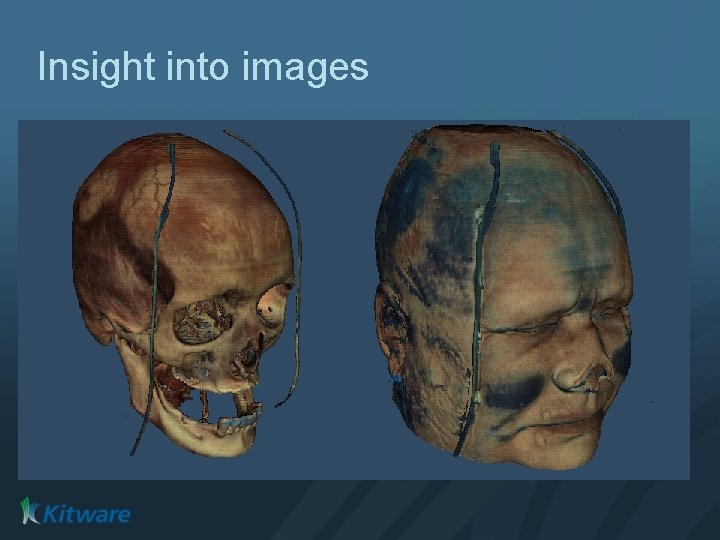
Insight into images
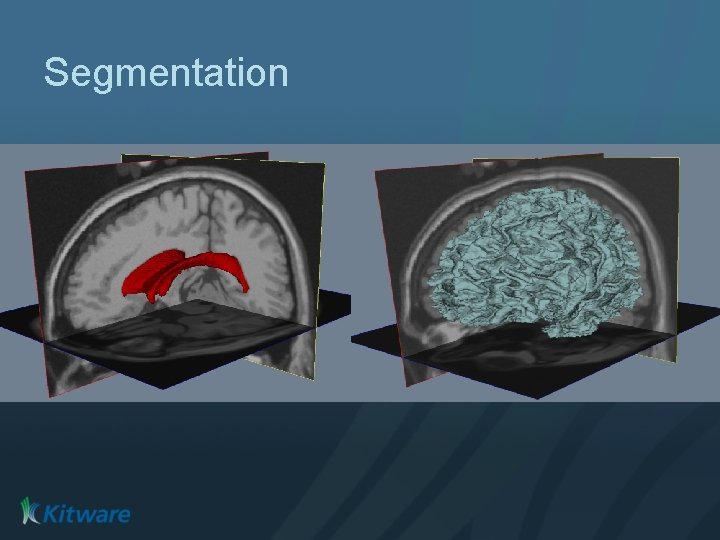
Segmentation
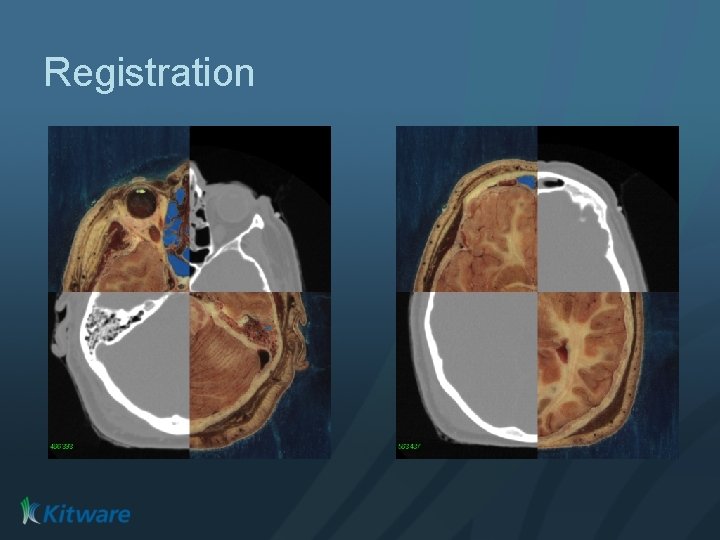
Registration
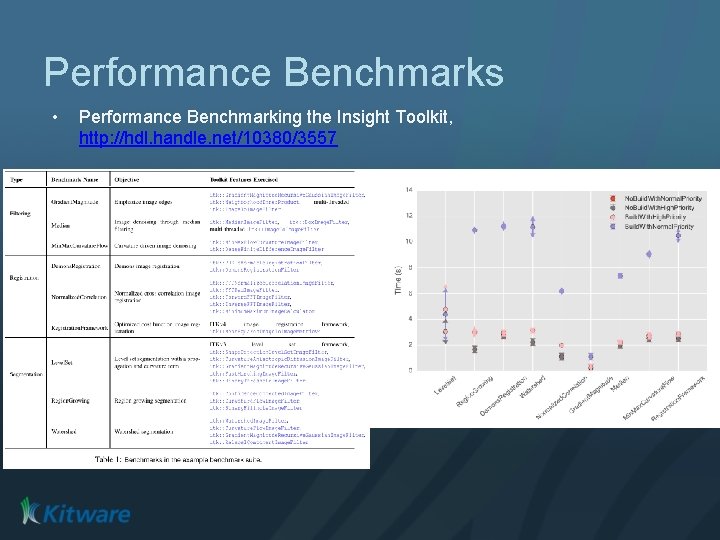
Performance Benchmarks • Performance Benchmarking the Insight Toolkit, http: //hdl. handle. net/10380/3557
Questions to answer • Over the project's history, when did commits introduce a performance regression / improvement? • How does a proposed change affect performance? • How does performance change across platforms? • How does performance change with build settings? • How does performance scale with the number of threads used?
The Challenge • Develop an interactive visualization tool to understand ITK performance • • • Develop a JAMStack (client-side Java. Script) web application Deploys on free, static website hosting services Has regression testing • • Use the performance benchmarks: https: //github. com/Insight. Software. Consortium/ITKPerformance. Benchmarking Read from benchmark outputs stored in JSON: https: //data. kitware. com/#collection/57 b 5 c 9 e 58 d 777 f 126827 f 5 a 1/folder/5 af 50 c 818 d 777 f 0685798 5 e 3 Example visualizations: https: //github. com/jhlegarreta/ITKPerformance. Plot • • View modes: Historical, Commit-to-Commit, Thread Scalability Selection of: metric, system, compiler flags, operating system, threads •