
Istat e Xplorer Michele Ferrara Stefano De Francisci
- Slides: 10
Istat. e. Xplorer Michele Ferrara, Stefano De Francisci, Antonio Pitrone ISTAT - Italian National Institute of Statistics Division of Users’ Needs, Integration and Territory
Istat. e. Xplorer project Pick and choose a data visualization toolkit Trial of the Statistics e. Xplorer GAV (Geo. Analytics Visualization) Workshop with NCVA (National Center for Visual Analytics - Linköping University) We picked up knowledge on how customize Statistics e. Xplorer
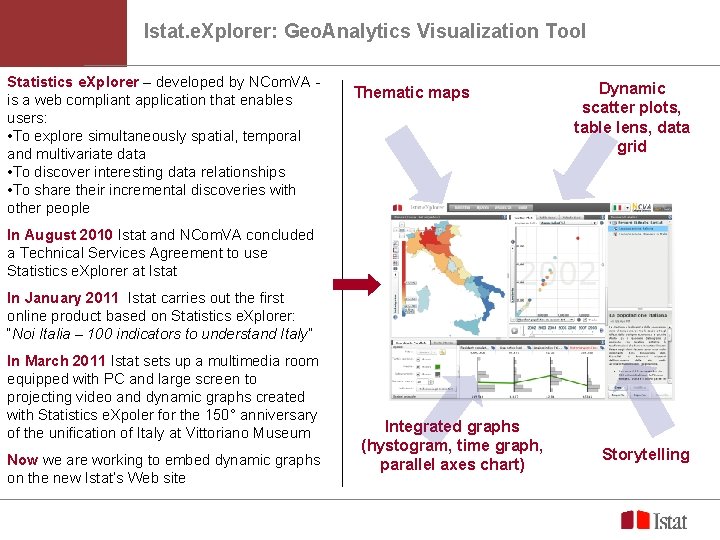
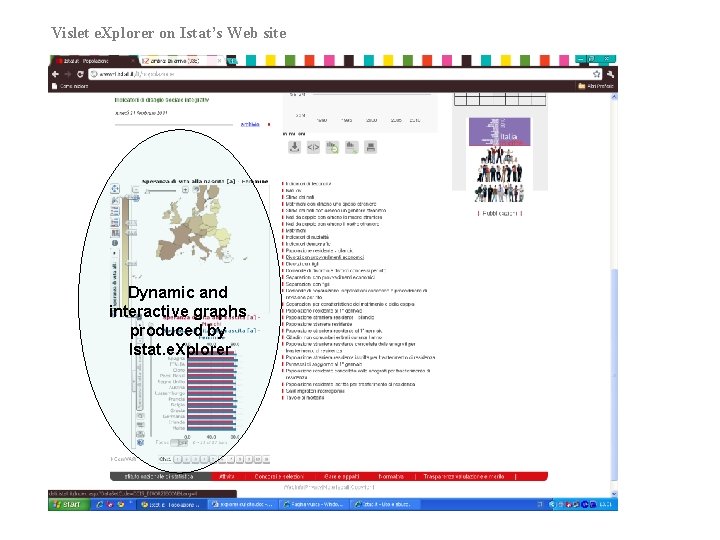
Istat. e. Xplorer: Geo. Analytics Visualization Tool Statistics e. Xplorer – developed by NCom. VA is a web compliant application that enables users: • To explore simultaneously spatial, temporal and multivariate data • To discover interesting data relationships • To share their incremental discoveries with other people Thematic maps Dynamic scatter plots, table lens, data grid In August 2010 Istat and NCom. VA concluded a Technical Services Agreement to use Statistics e. Xplorer at Istat In January 2011 Istat carries out the first online product based on Statistics e. Xplorer: “Noi Italia – 100 indicators to understand Italy” In March 2011 Istat sets up a multimedia room equipped with PC and large screen to projecting video and dynamic graphs created with Statistics e. Xpoler for the 150° anniversary of the unification of Italy at Vittoriano Museum Now we are working to embed dynamic graphs on the new Istat’s Web site 3 Integrated graphs (hystogram, time graph, parallel axes chart) Storytelling
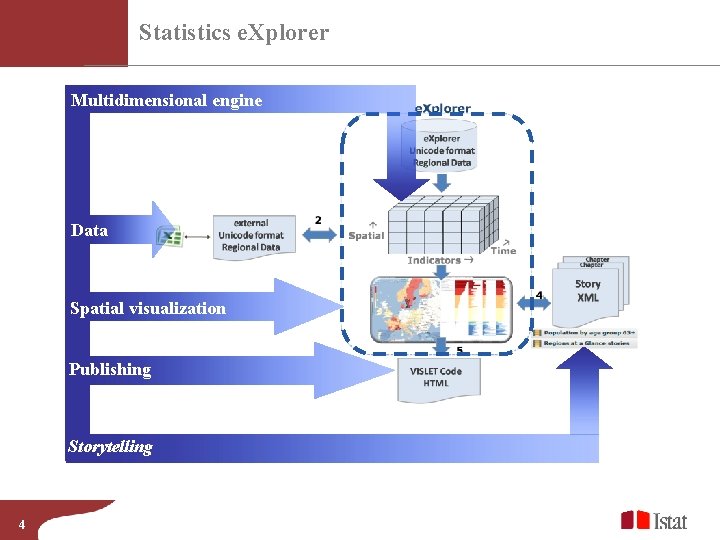
Statistics e. Xplorer Multidimensional engine Data Spatial visualization Publishing Storytelling 4
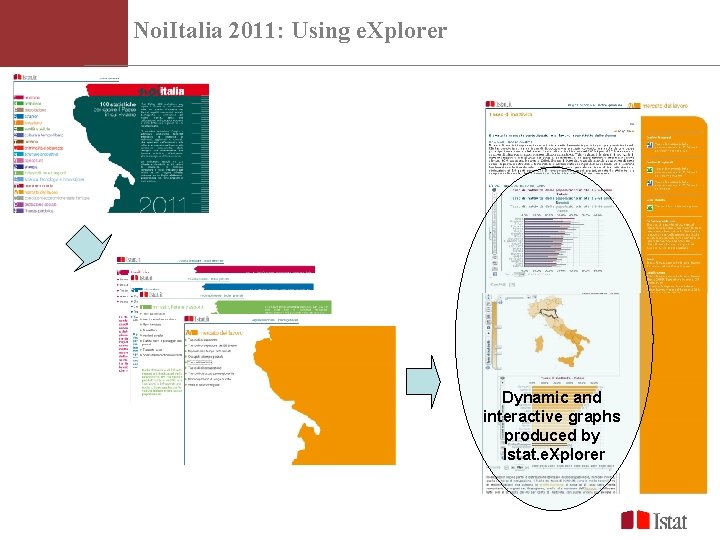
Noi. Italia 2011: Using e. Xplorer Dynamic and interactive graphs produced by Istat. e. Xplorer 5
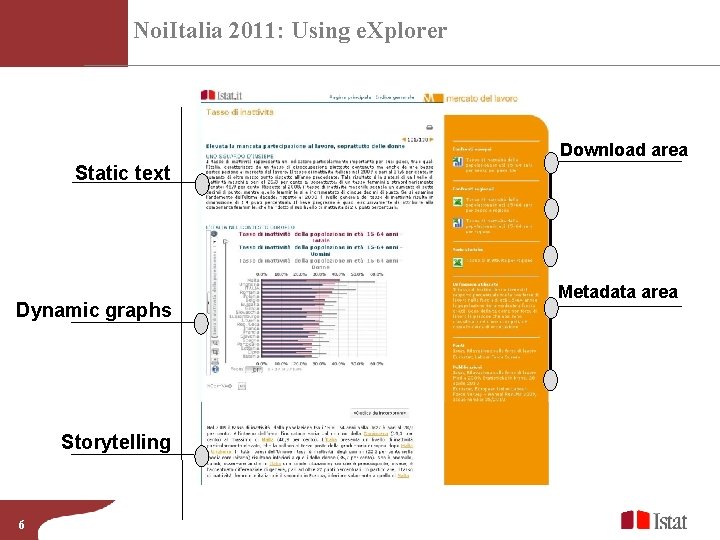
Noi. Italia 2011: Using e. Xplorer Download area Static text Dynamic graphs Storytelling 6 Metadata area
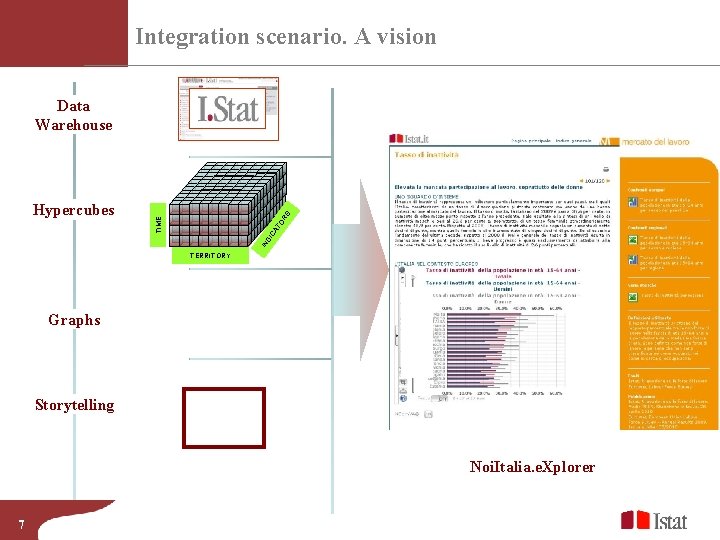
Integration scenario. A vision IN DI CA T TIME Hypercubes OR S Data Warehouse TERRITORY Graphs Storytelling Noi. Italia. e. Xplorer 7
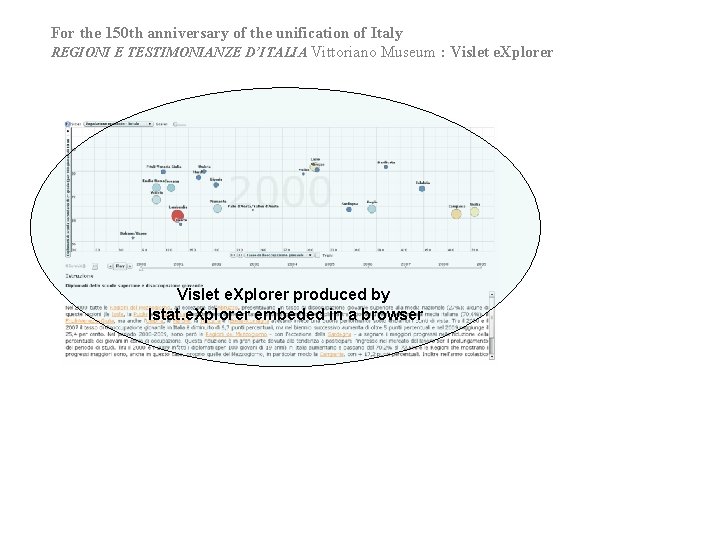
For the 150 th anniversary of the unification of Italy REGIONI E TESTIMONIANZE D’ITALIA Vittoriano Museum : Vislet e. Xplorer produced by Istat. e. Xplorer embeded in a browser
Vislet e. Xplorer on Istat’s Web site Dynamic and interactive graphs produced by Istat. e. Xplorer
• Next goal To develop Istat. e. Xplorer as the corporate Geo. Analytics. Visualization environment AND To implement the SDMX interface (developed by Ncom. VA & OECD) for providing a direct feed of data from I. Stat to Istat. e. Xplorer