ISO 9001 and ISO 14001 in brief ISO

ISO 9001 and ISO 14001 in brief ISO 9001 and ISO 14001 are among ISO's most well known standards ever. They are implemented by more than a million organizations in some 175 countries. ISO 9001 helps organizations to implement quality management. ISO 14001 helps organizations to implement environmental management.

Quality management ISO 9001 is for quality management. Quality refers to all those features of a product (or service) which are required by the customer. Quality management means what the organization does to ensure that its products or services satisfy the customer's quality requirements and comply with any regulations applicable to those products or services.
 Quality management also means what the organization does to enhance")
Quality management (cont. ) Quality management also means what the organization does to enhance customer satisfaction, and achieve continual improvement of its performance.

Environmental management ISO 14001 is for environmental management. This means what the organization does to: minimize harmful effects on the environment caused by its activities, to conform to applicable regulatory requirements, and to achieve continual improvement of its environmental performance.

Generic standards ISO 9001 and ISO 14001 are generic standards. Generic means that the same standards can be applied: to any organization, large or small, whatever its product or service, in any sector of activity, and whether it is a business enterprise, a public administration, or a government department.
 Generic also signifies that no matter what the organization's scope")
Generic standards (cont. ) Generic also signifies that no matter what the organization's scope of activity if it wants to establish a quality management system, ISO 9001 gives the essential features or if it wants to establish an environmental management system, ISO 14001 gives the essential features.

Management systems Management system means what the organization does to manage its processes, or activities in order that its products or services meet the organization’s objectives, such as satisfying the customer's quality requirements, complying to regulations, or meeting environmental objectives

Management systems To be really efficient and effective, the organization can manage its way of doing things by systemizing it. Nothing important is left out. Everyone is clear about who is responsible for doing what, when, how, why and where. Management system standards provide the organization with an international, state-of-the-art model to follow.
 Large organizations, or ones with complicated processes, could not function")
Management systems (cont. ) Large organizations, or ones with complicated processes, could not function well without management systems. Companies in such fields as aerospace, automobiles, defence, or health care devices have been operating management systems for years. The ISO 9001 and ISO 14001 management system standards now make these successful practices available for all organizations.

Processes, not products Both ISO 9001 and ISO 14001 concern the way an organization goes about its work. They are not product standards. They are not service standards. They are process standards. They can be used by product manufacturers and service providers.
 Processes affect final products or services. ISO 9001 gives")
Processes, not products (cont. ) Processes affect final products or services. ISO 9001 gives the requirements for what the organization must do to manage processes affecting quality of its products and services. ISO 14001 gives the requirements for what the organization must do to manage processes affecting the impact of its activities on the environment.

Certification and registration Certification is known in some countries as registration. It means that an independent, external body has audited an organization's management system and verified that it conforms to the requirements specified in the standard (ISO 9001 or ISO 14001). ISO does not carry out certification and does not issue or approve certificates,

Accreditation is like certification of the certification body. It means the formal approval by a specialized body - an accreditation body - that a certification body is competent to carry out ISO 9001: 2008 or ISO 14001: 2004 certification in specified business sectors. Certificates issued by accredited certification bodies - and known as accredited certificates - may be perceived on the market as having increased credibility. ISO does not carry out or approve accreditations.

Certification not a requirement Certification is not a requirement of ISO 9001 or ISO 14001. The organization can implement and benefit from an ISO 9001 or ISO 14001 system without having it certified. The organization can implement them for the internal benefits without spending money on a certification programme.

Certification is a business decision Certification is a decision to be taken for business reasons: if it is a contractual, regulatory, or market requirement, If it meets customer preferences it is part of a risk management programme, or if it will motivate staff by setting a clear goal.

ISO does not certify ISO does not carry out ISO 9001 or ISO 14001 certification. ISO does not issue certificates. ISO does not accredit, approve or control the certification bodies. ISO develops standards and guides to encourage good practice in accreditation and certification.

The ISO 9000 family ISO 9001 is the standard that gives the requirements for a quality management system. ISO 9001: 2008 is the latest, improved version. It is the only standard in the ISO 9000 family that can be used for certification. There are 16 other standards in the family that can help an organization on specific aspects such as performance improvement, auditing, training…

The ISO 14000 family ISO 14001 is the standard that gives the requirements for an environmental management system. ISO 14001: 2004 is the latest, improved version. It is the only standard in the ISO 14000 family that can be used for certification. The ISO 14000 family includes 21 other standards that can help an organization specific aspects such as auditing, environmental labelling, life cycle analysis…

The ISO Survey
 The worldwide total of certificates to ISO 9001: 2001")
The ISO Survey (cont. ) The worldwide total of certificates to ISO 9001: 2001 at the end of 2007 was 951 486. This was increase of 6 % over 2006 when the total was 896 929 certificates. Certificates had been issued in 175 countries compared to 170 the previous year.
")
The ISO Survey (cont. )
 The worldwide total of ISO 14001 certificates at the")
The ISO Survey (cont. ) The worldwide total of ISO 14001 certificates at the end of 2007 was 154 572. This was an increase of 21 % over 2006 when the total was 128 211. Certificates had been issued in 148 countries compared to 140 the year before.

Benefits of ISO 9001 and ISO 14001 International, expert consensus on state-of-the-art practices for quality and environmental management. Common language for dealing with customers and suppliers worldwide in B 2 B. Increase efficiency and effectiveness. Model for continual improvement.
 Model for satisfying customers and")
Benefits of ISO 9001 and ISO 14001 (cont. ) Model for satisfying customers and other stakeholders. Build quality into products and services from design onwards. Address environmental concerns of customers and public, and comply with government regulations. Integrate with global economy.
 Sustainable business Unifying base for")
Benefits of ISO 9001 and ISO 14001 (cont. ) Sustainable business Unifying base for industry sectors Qualify suppliers for global supply chains Technical support for regulations
 Transfer of good practice to")
Benefits of ISO 9001 and ISO 14001 (cont. ) Transfer of good practice to developing countries Tools for new economic players Regional integration Facilitate rise of services

Total quality Management Meaning of Quality Total Quality Management Quality Improvement and Role of Employees Strategic Implications of TQM Six Sigma Copyright 2006 John Wiley & Sons, Inc. 3 -27
 TQM in Service Companies Cost of Quality Management and Productivity")
Lecture Outline (cont. ) TQM in Service Companies Cost of Quality Management and Productivity Identifying Quality Problems and Causes Quality Awards and Setting Quality Standards ISO 9000 Copyright 2006 John Wiley & Sons, Inc. 3 -28

Meaning of Quality § Webster’s Dictionary § degree of excellence of a thing § American Society for Quality § totality of features and characteristics that satisfy needs § Consumer’s and Producer’s Perspective Copyright 2006 John Wiley & Sons, Inc. 3 -29

Meaning of Quality: Consumer’s Perspective § Fitness for use § how well product or service does what it is supposed to § Quality of design § designing quality characteristics into a product or service § A Mercedes and a Ford are equally “fit for use, ” but with different design dimensions Copyright 2006 John Wiley & Sons, Inc. 3 -30

Dimensions of Quality: Manufactured Products § Performance § basic operating characteristics of a product; how well a car is handled or its gas mileage § Features § “extra” items added to basic features, such as a stereo CD or a leather interior in a car § Reliability § probability that a product will operate properly within an expected time frame; that is, a TV will work without repair for about seven years Copyright 2006 John Wiley & Sons, Inc. 3 -31
 Conformance § § degree to which a")
Dimensions of Quality: Manufactured Products (cont. ) Conformance § § degree to which a product meets pre–established standards Durability § § how long product lasts before replacement Serviceability § § ease of getting repairs, speed of repairs, courtesy and competence of repair person Copyright 2006 John Wiley & Sons, Inc. 3 -32
 § Aesthetics § how a product looks,")
Dimensions of Quality: Manufactured Products (cont. ) § Aesthetics § how a product looks, feels, sounds, smells, or tastes § Safety § assurance that customer will not suffer injury or harm from a product; an especially important consideration for automobiles § Perceptions § subjective perceptions based on brand name, advertising, and the like Copyright 2006 John Wiley & Sons, Inc. 3 -33

Dimensions of Quality: Service § Time and Timeliness § How long must a customer wait for service, and is it completed on time? § Is an overnight package delivered overnight? § Completeness: § Is everything customer asked for provided? § Is a mail order from a catalogue company complete when delivered? Copyright 2006 John Wiley & Sons, Inc. 3 -34
 § Courtesy: § How are customers treated by")
Dimensions of Quality: Service (cont. ) § Courtesy: § How are customers treated by employees? § Are catalogue phone operators nice and are their voices pleasant? § Consistency § Is the same level of service provided to each customer each time? § Is your newspaper delivered on time every morning? Copyright 2006 John Wiley & Sons, Inc. 3 -35
 § Accessibility and convenience § How easy is")
Dimensions of Quality: Service (cont. ) § Accessibility and convenience § How easy is it to obtain service? § Does a service representative answer you calls quickly? § Accuracy § Is the service performed right every time? § Is your bank or credit card statement correct every month? § Responsiveness § How well does the company react to unusual situations? § How well is a telephone operator able to respond to a customer’s questions? Copyright 2006 John Wiley & Sons, Inc. 3 -36

Meaning of Quality: Producer’s Perspective § Quality of Conformance § Making sure a product or service is produced according to design § if new tires do not conform to specifications, they wobble § if a hotel room is not clean when a guest checks in, the hotel is not functioning according to specifications of its design Copyright 2006 John Wiley & Sons, Inc. 3 -37

Meaning of Quality: A Final Perspective § Consumer’s and producer’s perspectives depend on each other § Consumer’s perspective: PRICE § Producer’s perspective: COST § Consumer’s view must dominate Copyright 2006 John Wiley & Sons, Inc. 3 -38

Meaning of Quality Production Producer’s Perspective Consumer’s Perspective Quality of Conformance Quality of Design • Conformance to specifications • Cost • Quality characteristics • Price Fitness for Consumer Use Copyright 2006 John Wiley & Sons, Inc. 3 -39 Marketing

Total Quality Management Commitment to quality throughout organization Principles of TQM Customer-oriented Leadership Strategic planning Employee responsibility Continuous improvement Cooperation Statistical methods Training and education Copyright 2006 John Wiley & Sons, Inc. 3 -40

Quality Gurus Walter Shewart In 1920 s, developed control charts Introduced the term “quality assurance” W. Edwards Deming Developed courses during World War II to teach statistical quality-control techniques to engineers and executives of companies that were military suppliers After the war, began teaching statistical quality control to Japanese companies Joseph M. Juran Followed Deming to Japan in 1954 Focused on strategic quality planning Copyright 2006 John Wiley & Sons, Inc. 3 -41
 § Armand V. Feigenbaum § In 1951, introduced concepts of")
Quality Gurus (cont. ) § Armand V. Feigenbaum § In 1951, introduced concepts of total quality control and continuous quality improvement § Philip Crosby § In 1979, emphasized that costs of poor quality far outweigh the cost of preventing poor quality § In 1984, defined absolutes of quality management— conformance to requirements, prevention, and “zero defects” § Kaoru Ishikawa § Promoted use of quality circles § Developed “fishbone” diagram § Emphasized importance of internal customer Copyright 2006 John Wiley & Sons, Inc. 3 -42

Deming’s 14 Points 1. 2. 3. 4. 5. Create constancy of purpose Adopt philosophy of prevention Cease mass inspection Select a few suppliers based on quality Constantly improve system and workers Copyright 2006 John Wiley & Sons, Inc. 3 -43
 Institute worker training 7. Instill leadership among supervisors 8.")
Deming’s 14 Points (cont. ) Institute worker training 7. Instill leadership among supervisors 8. Eliminate fear among employees 9. Eliminate barriers between departments 10. Eliminate slogans 6. Copyright 2006 John Wiley & Sons, Inc. 3 -44
 Remove numerical quotas 12. Enhance worker pride 13. Institute")
Deming’s 14 Points (cont. ) Remove numerical quotas 12. Enhance worker pride 13. Institute vigorous training and education programs 14. Develop a commitment from top management to implement above 13 points 11. Copyright 2006 John Wiley & Sons, Inc. 3 -45

Deming Wheel: PDCA Cycle Copyright 2006 John Wiley & Sons, Inc. 4. Act 1. Plan Institutionalize improvement; continue cycle. Identify problem and develop plan for improvement. 3. Study/Check 2. Do Assess plan; is it working? Implement plan on a test basis. 3 -46

TQM and… … Partnering a relationship between a company and its supplier based on mutual quality standards … Customers system must measure customer satisfaction … Information Technology infrastructure of hardware, networks, and software necessary to support a quality program Copyright 2006 John Wiley & Sons, Inc. 3 -47

Quality Improvement and Role of Employees Participative problem solving employees involved in quality management every employee has undergone extensive training to provide quality service to Disney’s guests Copyright 2006 John Wiley & Sons, Inc. 3 -48

Quality Circle Organization 8 -10 members Same area Supervisor/moderator Training Presentation Group processes Data collection Problem analysis Implementation Monitoring Problem Identification Solution Problem results List alternatives Consensus Brainstorming Problem Analysis Cause and effect Data collection and analysis 3 -49

Strategic Implications of TQM Strong leadership Goals, vision, or mission Operational plans and policies Mechanism for feedback 3 -50

Six Sigma A process for developing and delivering near perfect products and services Measure of how much a process deviates from perfection 3. 4 defects per million opportunities Champion an executive responsible for project success 3 -51

Black Belts and Green Belts Black Belt project leader Master Black Belt a teacher and mentor for Black Belts Green Belts project team members Copyright 2006 John Wiley & Sons, Inc. 3 -52

Six Sigma: DMAIC DEFINE MEASURE ANALYZE IMPROVE CONTROL 67, 000 DPMO cost = 25% of sales 3. 4 DPMO Copyright 2006 John Wiley & Sons, Inc. 3 -53

TQM in Service Companies Principles of TQM apply equally well to services and manufacturing Services and manufacturing companies have similar inputs but different processes and outputs Services tend to be labor intensive Service defects are not always easy to measure because service output is not usually a tangible item Copyright 2006 John Wiley & Sons, Inc. 3 -54

Quality Attributes in Service Benchmark “best” level of quality achievement one company or companies seek to achieve Timeliness how quickly a service is provided “quickest, friendliest, most accurate service available. ” Copyright 2006 John Wiley & Sons, Inc. 3 -55

Cost of Quality Cost of Achieving Good Quality Prevention costs incurred during product design Appraisal costs of measuring, testing, and analyzing Cost of Poor Quality Internal failure costs include scrap, rework, process failure, downtime, and price reductions External failure costs include complaints, returns, warranty claims, liability, and lost sales Copyright 2006 John Wiley & Sons, Inc. 3 -56

Prevention Costs Quality planning costs of developing and implementing quality management program Product-design costs of designing products with quality characteristics Process costs expended to make sure productive process conforms to quality specifications Copyright 2006 John Wiley & Sons, Inc. Training costs of developing and putting on quality training programs for employees and management Information costs of acquiring and maintaining data related to quality, and development of reports on quality performance 3 -57

Appraisal Costs Inspection and testing costs of testing and inspecting materials, parts, and product at various stages and at the end of a process Test equipment costs of maintaining equipment used in testing quality characteristics of products Operator costs of time spent by operators to gar data for testing product quality, to make equipment adjustments to maintain quality, and to stop work to assess quality Copyright 2006 John Wiley & Sons, Inc. 3 -58

Internal Failure Costs Process downtime costs of shutting down Scrap costs productive process to fix costs of poor-quality products problem that must be discarded, including labor, material, and Price-downgrading costs indirect costs of discounting poor Rework costs quality products—that is, selling costs of fixing defective products as “seconds” to conform to quality specifications Process failure costs of determining why production process is producing poor-quality products Copyright 2006 John Wiley & Sons, Inc. 3 -59

External Failure Costs Customer complaint costs Product liability costs of investigating and litigation costs resulting satisfactorily responding to a from product liability and customer complaint resulting from customer injury a poor-quality product Product return costs Lost sales costs of handling and replacing poor costs incurred because -quality products returned by customers are dissatisfied customer with poor quality products Warranty claims costs and do not make costs of complying with product additional purchases warranties Copyright 2006 John Wiley & Sons, Inc. 3 -60

Measuring and Reporting Quality Costs Index numbers ratios that measure quality costs against a base value labor index ratio of quality cost to labor hours cost index ratio of quality cost to manufacturing cost sales index ratio of quality cost to sales production index ratio of quality cost to units of final product Copyright 2006 John Wiley & Sons, Inc. 3 -61

Quality–Cost Relationship Cost of quality Difference between price of nonconformance and conformance Cost of doing things wrong 20 to 35% of revenues Cost of doing things right 3 to 4% of revenues Profitability In the long run, quality is free Copyright 2006 John Wiley & Sons, Inc. 3 -62

Quality Management and Productivity ratio of output to input Yield: a measure of productivity Yield=(total input)(% good units) + (total input)(1 -%good units)(% reworked) or Y=(I)(%G)+(I)(1 -%G)(%R) Copyright 2006 John Wiley & Sons, Inc. 3 -63

Product Cost where: Kd = direct manufacturing cost per unit I = input Kr = rework cost per unit R = reworked units Y = yield Copyright 2006 John Wiley & Sons, Inc. 3 -64
(%g 1)(%g 2) … (%gn) where:")
Computing Product Yield for Multistage Processes Y = (I)(%g 1)(%g 2) … (%gn) where: I = input of items to the production process that will result in finished products gi = good-quality, work-in-process products at stage i Copyright 2006 John Wiley & Sons, Inc. 3 -65
 QPR")
Quality–Productivity Ratio QPR productivity index that includes productivity and quality costs (non-defective units) QPR = (input) (processing cost) + (defective units) (reworked cost) Copyright 2006 John Wiley & Sons, Inc. 3 -66

Seven Quality Control Tools Pareto Analysis Flow Chart Check Sheet Histogram Copyright 2006 John Wiley & Sons, Inc. Scatter Diagram SPC Chart Cause-and-Effect Diagram 3 -67

Pareto Analysis CAUSE Poor design Wrong part dimensions Defective parts Incorrect machine calibration Operator errors Defective material Surface abrasions Copyright 2006 John Wiley & Sons, Inc. NUMBER OF DEFECTS PERCENTAGE 80 16 12 7 4 3 3 64 % 13 10 6 3 2 2 125 100 % 3 -68

Po or W De ro sig ng n di m en De sio fe ns ct iv ep ar M ts ac hi ne ca lib O ra pe tio ra ns to re rr or De s fe ct iv em at Su er rf ia ac ls ea br as io ns Percent from each cause 70 60 20 10 Copyright 2006 John Wiley & Sons, Inc. (64) Pareto Chart 50 40 30 (13) (10) (6) Causes of poor quality 3 -69 (3) (2) 0

Flow Chart Start/ Finish Operation Copyright 2006 John Wiley & Sons, Inc. Operation 3 -70 Decision Operation Decision Start/ Finish

Check Sheet COMPONENTS REPLACED BY LAB TIME PERIOD: 22 Feb to 27 Feb 2002 REPAIR TECHNICIAN: Bob TV SET MODEL 1013 Integrated Circuits Capacitors Resistors Transformers Commands CRT Copyright 2006 John Wiley & Sons, Inc. |||| |||| |||| | 3 -71

Histogram 20 15 10 5 0 1 2 Copyright 2006 John Wiley & Sons, Inc. 6 13 10 16 19 17 12 16 2017 13 5 6 2 1 3 -72

Scatter Diagram Y Copyright 2006 John Wiley & Sons, Inc. 3 -73 X

Control Chart 24 UCL = 23. 35 Number of defects 21 c = 12. 67 18 15 12 9 6 LCL = 1. 99 3 2 4 6 8 10 Sample number Copyright 2006 John Wiley & Sons, Inc. 3 -74 12 14 16

Cause-and-Effect Diagram Measurement Faulty testing equipment Out of adjustment Poor supervision Incorrect specifications Tooling problems Lack of concentration Improper methods Old / worn Inadequate training Quality Problem Inaccurate temperature control Defective from vendor Poor process design Ineffective quality management Not to specifications Dust and Dirt Machines Human Materialhandling problems Environment Copyright 2006 John Wiley & Sons, Inc. Deficiencies in product design Process Materials 3 -75

Baldrige Award Created in 1987 to stimulate growth of quality management in the United States Categories Leadership Information and analysis Strategic planning Human resource Focus Process management Business results Customer and market focus Copyright 2006 John Wiley & Sons, Inc. 3 -76

Other Awards for Quality National individual awards Armand V. Feigenbaum Medal Deming Medal E. Jack Lancaster Medal Edwards Medal Shewart Medal Ishikawa Medal Copyright 2006 John Wiley & Sons, Inc. International awards European Quality Award Canadian Quality Award Australian Business Excellence Award Deming Prize from Japan 3 -77
 Measures customer satisfaction Established in 1994 Web site: www.")
American Customer Satisfaction Index (ACSI) Measures customer satisfaction Established in 1994 Web site: www. acsi. org Examples (in 2003) Amazon. com scored 88 (highest in service) Dell scored of 78 (highest in computer industry) Cadillac scored 87 (highest in car industry) Copyright 2006 John Wiley & Sons, Inc. 3 -78

ISO 9000 A set of procedures and ISO 9001: 2000 policies for international Quality Management Systems— quality certification of Requirements suppliers standard to assess ability to achieve customer satisfaction Standards ISO 9004: 2000 ISO 9000: 2000 Quality Management Systems— Quality Management Guidelines for Performance Systems—Fundamentals and Improvements Vocabulary guidance to a company for defines fundamental terms continual improvement of its and definitions used in ISO quality-management system 9000 family Copyright 2006 John Wiley & Sons, Inc. 3 -79

Implications of ISO 9000 for U. S. Companies Many overseas companies will not do business with a supplier unless it has ISO 9000 certification ISO 9000 accreditation ISO registrars A total commitment to quality is required throughout an organization Copyright 2006 John Wiley & Sons, Inc. 3 -80

What’s the goal of TQM? “Do the right things right the first time, every time. ” Total Quality Management

Another way to put it At it’s simplest, TQM is all managers leading and facilitating all contributors in everyone’s two main objectives: 4 (1) total client satisfaction through quality products and services; and 4 (2) continuous improvements to processes, systems, people, suppliers, partners, products, and services. Total Quality Management

Productivity and TQM Traditional view: Quality cannot be improved without significant losses in productivity. TQM view: Improved quality leads to improved productivity. Total Quality Management

Basic Tenets of TQM 1. The customer makes the ultimate determination of quality. 2. Top management must provide leadership and support for all quality initiatives. 3. Preventing variability is the key to producing high quality. 4. Quality goals are a moving target, thereby requiring a commitment toward continuous improvement. 5. Improving quality requires the establishment of effective metrics. We must speak with data and facts not just opinions. Total Quality Management

The three aspects of TQM Counting Customers Culture Tools, techniques, and training in their use for analyzing, understanding, and solving quality problems Quality for the customer as a driving force and central concern. Shared values and beliefs, expressed by leaders, that define and support quality. Total Quality Management

Total Quality Management and Continuous Improvement TQM is the management process used to make continuous improvements to all functions. TQM represents an ongoing, continuous commitment to improvement. The foundation of total quality is a management philosophy that supports meeting customer requirements through continuous improvement. Total Quality Management

Continuous Improvement versus Traditional Approach Continuous Improvement Traditional Approach Customer focus Market-share focus Cross-functional teams Individuals Focus on ‘who” and “why” Short-term focus Status quo focus Product focus Innovation Fire fighting Focus on “what” and “how” Long-term focus Continuous improvement Process improvement focus Incremental improvements Problem solving Total Quality Management

Quality Throughout “A Customer’s impression of quality begins with the initial contact with the company and continues through the life of the product. ” Customers look to the total package - sales, service during the sale, packaging, deliver, and service after the sale. Quality extends to how the receptionist answers the phone, how managers treat subordinates, how courteous sales and repair people are, and how the product is serviced after the sale. “All departments of the company must strive to improve the quality of their operations. ” Total Quality Management

Value-based Approach Manufacturing Dimensions Performance Features Reliability Conformance Service Dimensions Reliability Responsiveness Assurance Empathy Tangibles Durability Serviceability Aesthetics Perceived quality Total Quality Management

The TQM System Continuous Improvement Objective Principles Elements Customer Focus Process Improvement Total Involvement Leadership Education and Training Supportive structure Communications Reward and recognition Measurement Total Quality Management
 &")
The Quality System Organization Purchasing & Inventory Personnel Process Control (QC & EQA) & Specimen Management Documen ts & Records Occurrence Management Process Improveme nt Customer Service Equipme nt Informatio n Managem ent Assessment Facilities & Safety

Functioning Equipment is Vital for: • Producing reliable test results • Minimizing instrument breakdown • Lowering repair costs • Preventing delays in reporting test results • Maintaining productivity

A Good Equipment Program Achieves Maintaining a high level of performance Lengthening instrument life Reducing interruption of services due to breakdowns and failures Improving customer satisfaction Improving the technologist’s confidence and knowledge

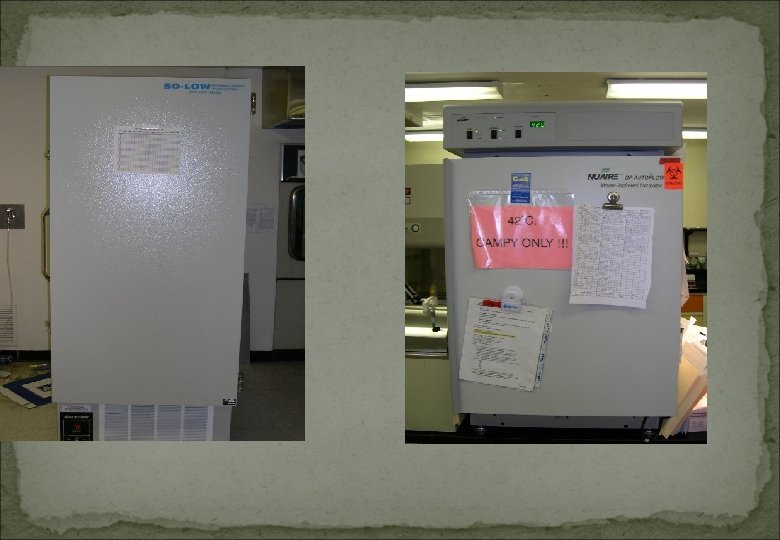
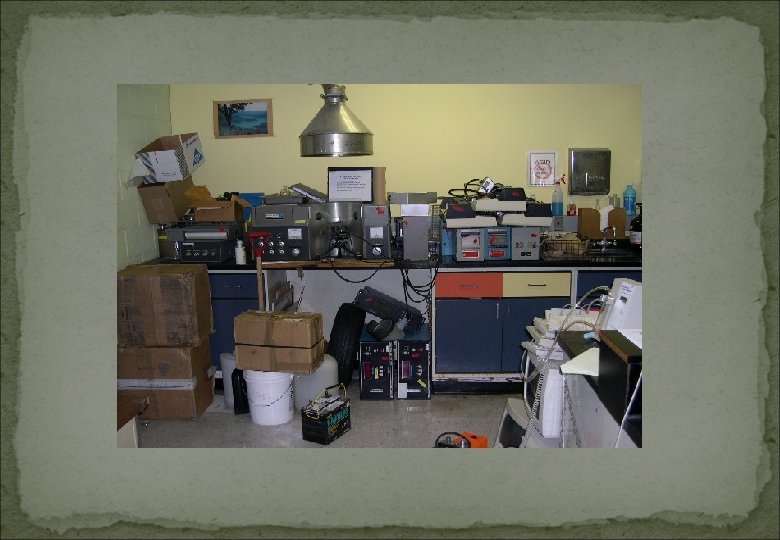
Basic Laboratory Equipment Microscope Balance/scale Centrifuge Micropipette Spectrophotometer Refrigerator Freezer Autoclave Hot air oven Incubator p. H Meter Water bath Washer Shaker / rotator Vortex

Equipment Management Selection Acquisition Installation Calibration / Validation Maintenance Troubleshooting Service and repair Retiring equipment / disposition

Equipment Management Oversight Assign responsibilities for all activities Train all personnel on equipment management requirements and responsibilities Monitor equipment management activities by: Routinely reviewing all records Ensuring all procedures are followed Updating procedures, if necessary

Equipment Management • Selection • • Acquisition Installation Calibration / Validation Maintenance Troubleshooting Service and repair Retiring equipment / disposition

Selection Criteria Use Matching equipment with service provided Performance characteristics Facility requirements Cost Supply of reagents Ease of operation Warranty Availability of manufacturer technical support Service Contracts

Selection Criteria Location in the laboratory available space, accessibility Safety

Equipment Management • Selection • Acquisition • • • Installation Calibration / Validation Maintenance Troubleshooting Service and repair Retiring equipment / disposition

Acquiring Equipment Purchase, Lease, or Rent Central acquisition Bulk procurement Donor provided Conditions of contract

Acquiring Equipment Contract considerations: Parts Manual Installation Operators’ Manual Trial period Contents of service contracts

Equipment Management • Selection • Acquisition • Installation • • • Calibration / Validation Maintenance Troubleshooting Service and repair Retiring equipment / disposition

Installation Checklist Prior to installation: verify physical requirements have been met § Safety checks, electrical, space, ventilation, water supply, ambient temperature, etc. confirm responsibility for installation

Installation Upon receipt: verify package contents do not attempt to use prior to proper installation If required, ensure the equipment is installed by the manufacturer

Installation After installation Establish inventory record Define conditions Develop and implement protocols for calibration, performance verification, and operating procedures Establish maintenance program Provide training for all operators

Equipment Management • Selection • Acquisition • Installation • Calibration / Validation • • Maintenance Troubleshooting Service and repair Retiring equipment / disposition

Equipment Calibration Perform initial calibration Calibrators or standards Follow manufacturer’s instructions Determine frequency of routine calibrations

Performance Validation Validate the performance of new equipment prior to use Test known samples, analyze data Establish stability/uniformity temperature controlled equipment Check accuracy/precision for pipettors Check centrifuge rpms

Equipment Management • • Selection Acquisition Installation Calibration / Validation • Maintenance • Troubleshooting • Service and repair • Retiring equipment / disposition

Maintenance Program Systematic and routine cleaning, adjustment, or replacement of instrument and equipment parts Performed periodically, daily, weekly, monthly Example: Cleaning optical lenses Thermostat adjustments Changing motor brushes

Function Checks Monitoring of instrument parameters to verify that your equipment is working according to the manufacturer’s specification Performed periodically- daily, weekly, monthly Performed after major instrument repair Example: Daily monitoring of temperatures Checking wavelength calibration Checking autoclave indicator paper

Implementing a Maintenance Program Assign responsibility • • Oversight of all laboratory equipment Individual responsibilities Develop written policies and procedures Train staff Keep records

Implementing a Maintenance Program Create a record for equipment inventory • • • Name, Model #, Serial # Location in lab Date purchased Manufacturer and vendor contact information Warranty, expiration date Spare parts

Implementing a Maintenance Program For each piece of equipment: § § § Establish routine maintenance plan Establish required function checks Develop a list of spare parts

Implementing a Maintenance Program: Spare Parts Establish and maintain an inventory of most frequently used spare parts. Include in record of inventory: § § § § Spare parts per equipment Part number Average use Minimal of items to be stored Cost and date of ordering Dates of entry and issuance of part from inventory stock Balance of items remaining in inventory

Implementing a Maintenance Program: Documents Develop written procedures for all equipment Concise step-by-step instructions for performing maintenance and function checks Include guide for troubleshooting Establish maintenance records to track: function checks and routine maintenance calibration manufacturer’s service

Sample Records Charts Logs Checklists Graphs Service Reports

Equipment Management • • • Selection Acquisition Installation Calibration / Validation Maintenance • Troubleshooting • Service and repair • Retiring equipment / disposition

Troubleshooting Check manufacturer’s instructions Determine source of problem Sample problem Reagent problem Equipment problem Check electrical supply Check water supply Make one change at a time

When In-house efforts fail: Do NOT use equipment that does not function properly Options for testing: Refer to nearby laboratory Obtain backup instrument from central stores Store samples appropriately Seek help from manufacturer or other technical expert Place a malfunction notice on equipment

Equipment Management • • • Selection Acquisition Installation Calibration / Validation Maintenance Troubleshooting • Service and repair • Retiring equipment / disposition

Service and Repair Schedule service that must be periodically performed by the manufacturer Options Centrally service small equipment, e. g. , microscopes, washers, pipettes Team of biomedical service technicians

Equipment Documentation Develop a problem log record for each piece of equipment • Date problem occurred, removed from service • Reason for breakdown or failure • Corrective action taken • Date returned to use • Change in maintenance or function checks

Equipment Management • • Selection Acquisition Installation Calibration / Validation Maintenance Troubleshooting Service and repair • Retiring equipment / disposition

Retiring Equipment / Disposition When? When experts indicate not repairable Outmoded, will replace with new equipment Why? Prevent inaccurate test results Free up valuable space Hazardous How? Salvage any useable parts Consider biohazard, follow safety disposal procedures

Benefits of a Maintenance Program Safety Fewer interruptions of work Lower repair costs Elimination of premature replacement Less standby equipment Identification of high maintenance cost Reduction of variation in test results Greater confidence in the reliability of results
- Slides: 131