
ISCCP cloud effects on radiative fluxes Stefan Kinne

- Slides: 28
ISCCP cloud effects on radiative fluxes Stefan Kinne MPI-Meteorology Hamburg, Germany MPI-Meteorology, Hamburg
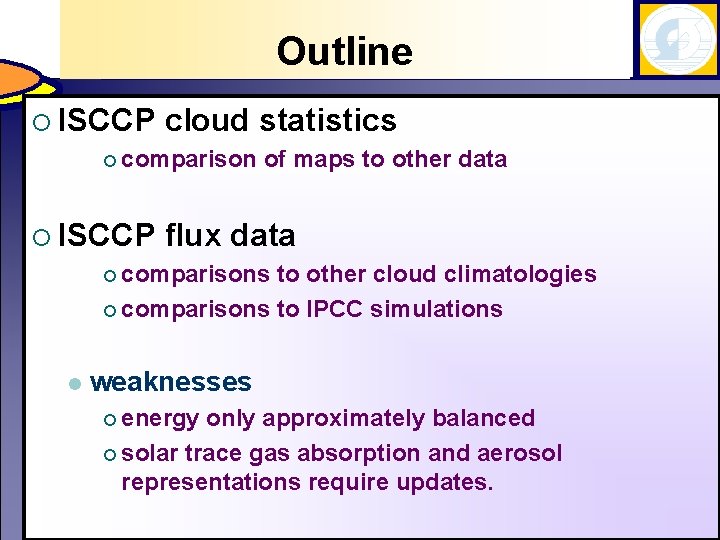
Outline ¡ ISCCP cloud statistics ¡ comparison ¡ ISCCP of maps to other data flux data ¡ comparisons to other cloud climatologies ¡ comparisons to IPCC simulations l weaknesses ¡ energy only approximately balanced ¡ solar trace gas absorption and aerosol representations require updates.
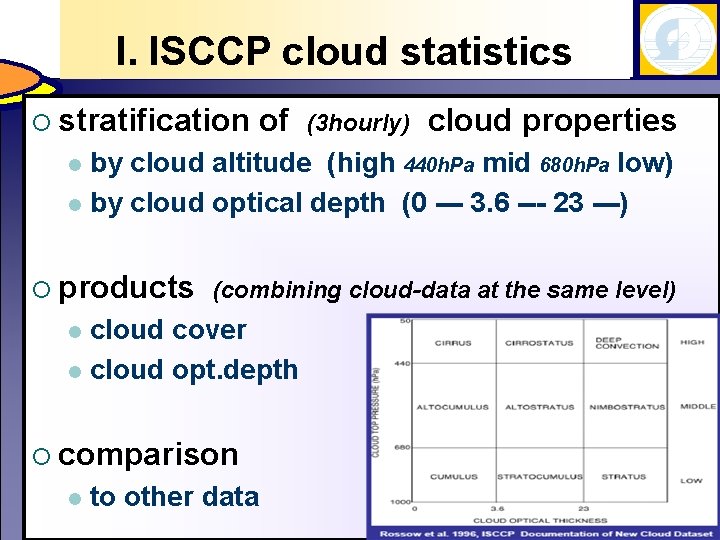
I. ISCCP cloud statistics ¡ stratification of (3 hourly) cloud properties by cloud altitude (high 440 h. Pa mid 680 h. Pa low) l by cloud optical depth (0 --- 3. 6 --- 23 ---) l ¡ products (combining cloud-data at the same level) cloud cover l cloud opt. depth l ¡ comparison l to other data
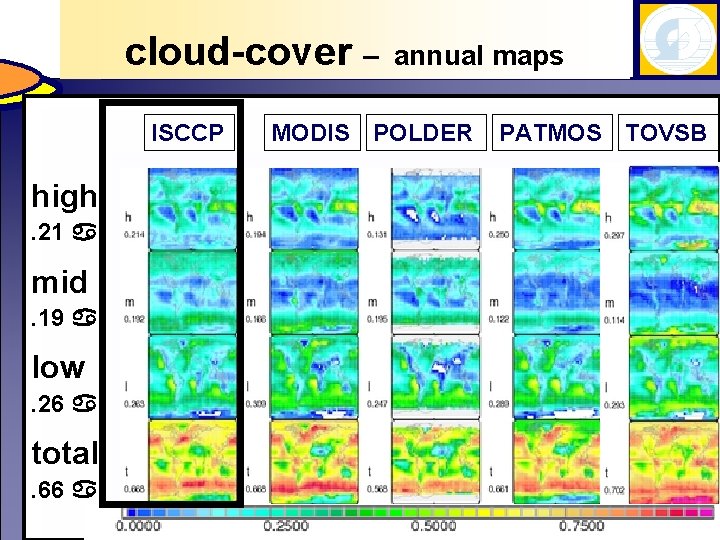
TOVS cloud-cover – ISCCP high. 21 a mid. 19 a low. 26 a total. 66 a annual maps MODIS POLDER PATMOS TOVSB
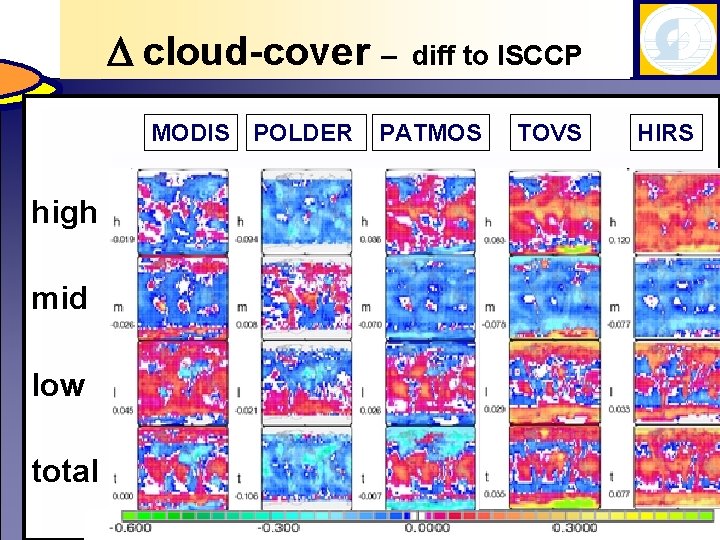
D cloud-cover – MODIS POLDER high mid low total diff to ISCCP PATMOS TOVS HIRS
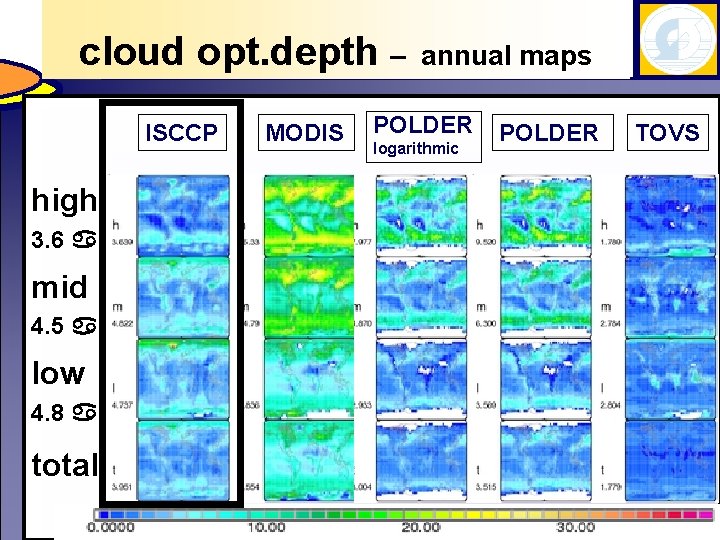
cloud opt. depth – ISCCP high 3. 6 a mid 4. 5 a low 4. 8 a total MODIS annual maps POLDER logarithmic POLDER TOVS
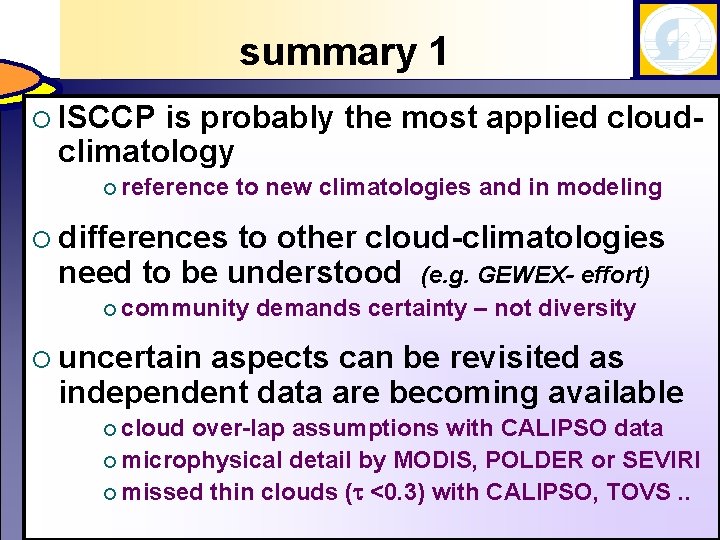
summary 1 ¡ ISCCP is probably the most applied cloudclimatology ¡ reference to new climatologies and in modeling ¡ differences to other cloud-climatologies need to be understood (e. g. GEWEX- effort) ¡ community demands certainty – not diversity ¡ uncertain aspects can be revisited as independent data are becoming available ¡ cloud over-lap assumptions with CALIPSO data ¡ microphysical detail by MODIS, POLDER or SEVIRI ¡ missed thin clouds (t <0. 3) with CALIPSO, TOVS. .
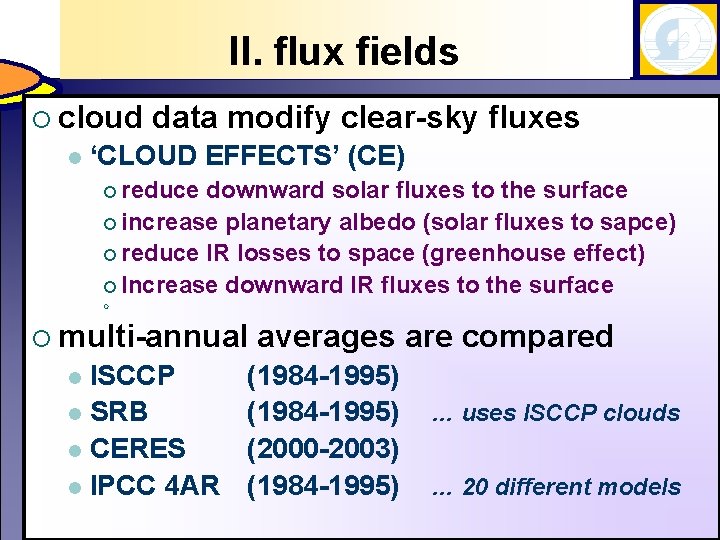
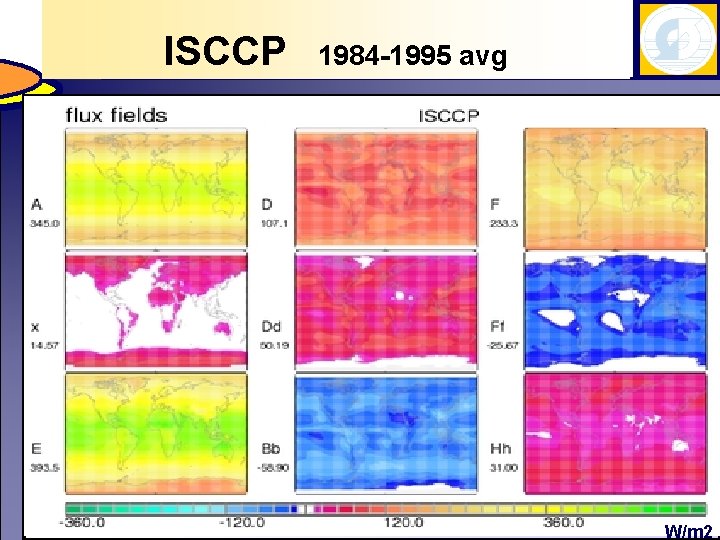
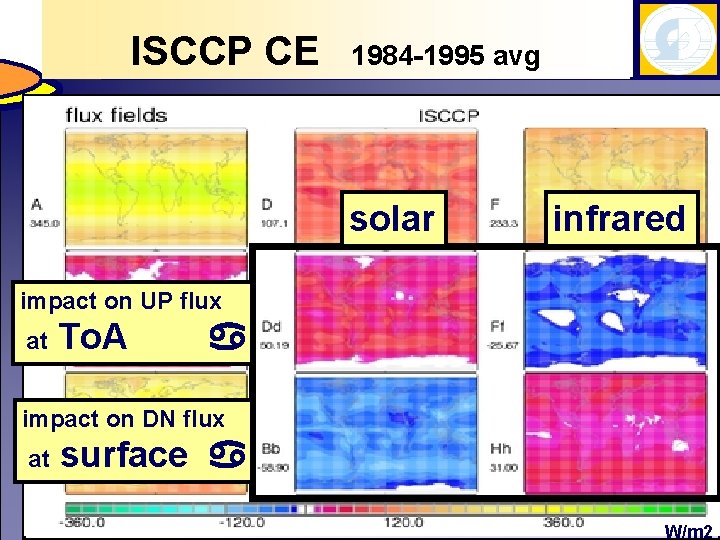
II. flux fields ¡ cloud l data modify clear-sky fluxes ‘CLOUD EFFECTS’ (CE) ¡ reduce downward solar fluxes to the surface ¡ increase planetary albedo (solar fluxes to sapce) ¡ reduce IR losses to space (greenhouse effect) ¡ Increase downward IR fluxes to the surface ¡ ¡ multi-annual ISCCP l SRB l CERES l IPCC 4 AR l averages are compared (1984 -1995) (2000 -2003) (1984 -1995) … uses ISCCP clouds … 20 different models
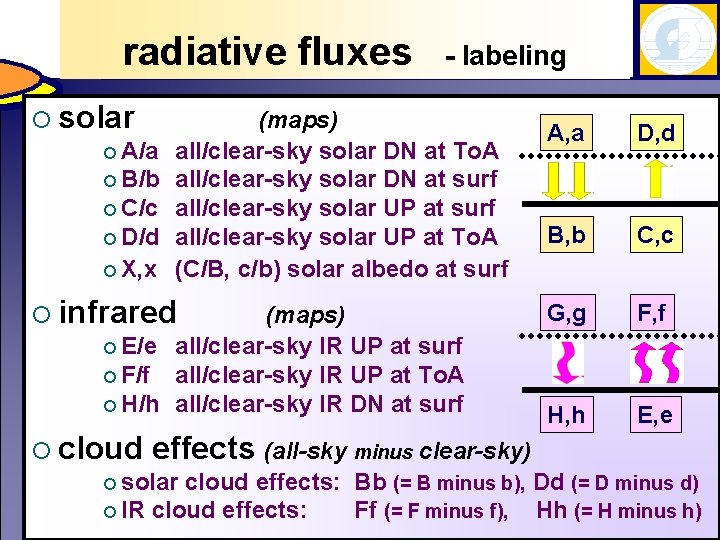
radiative fluxes ¡ solar ¡ A/a ¡ B/b ¡ C/c ¡ D/d ¡ X, x - labeling (maps) all/clear-sky solar DN at To. A all/clear-sky solar DN at surf all/clear-sky solar UP at To. A (C/B, c/b) solar albedo at surf ¡ infrared (maps) ¡ E/e all/clear-sky IR UP at surf ¡ F/f all/clear-sky IR UP at To. A ¡ H/h all/clear-sky IR DN at surf A, a D, d B, b C, c G, g F, f H, h E, e ¡ cloud effects (all-sky minus clear-sky) ¡ solar cloud effects: Bb (= B minus b), Dd (= D minus d) ¡ IR cloud effects: Ff (= F minus f), Hh (= H minus h)
ISCCP 1984 -1995 avg W/m 2
ISCCP CE 1984 -1995 avg solar infrared impact on UP flux at To. A a impact on DN flux at surface a W/m 2
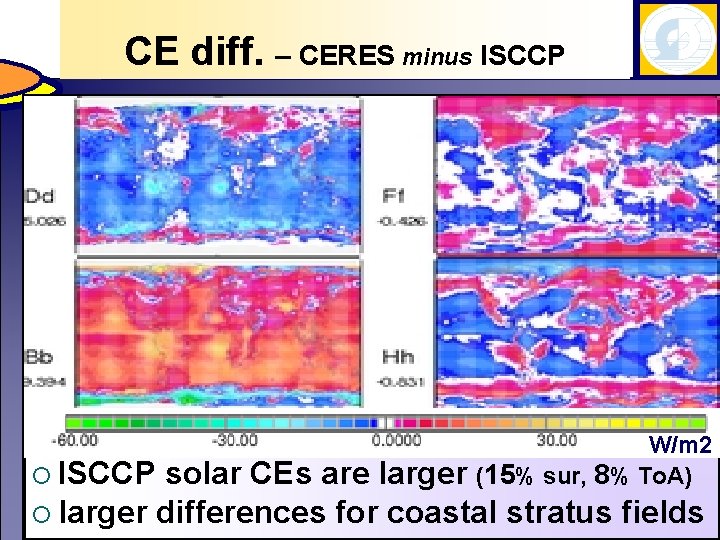
CE diff. – CERES minus ISCCP ¡ ISCCP W/m 2 (15% sur, 8% To. A) solar CEs are larger ¡ larger differences for coastal stratus fields
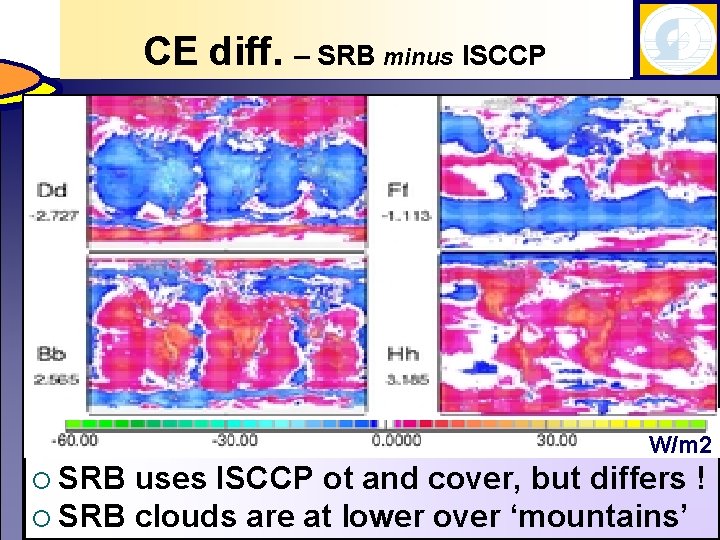
CE diff. – SRB minus ISCCP W/m 2 ¡ SRB uses ISCCP ot and cover, but differs ! ¡ SRB clouds are at lower over ‘mountains’
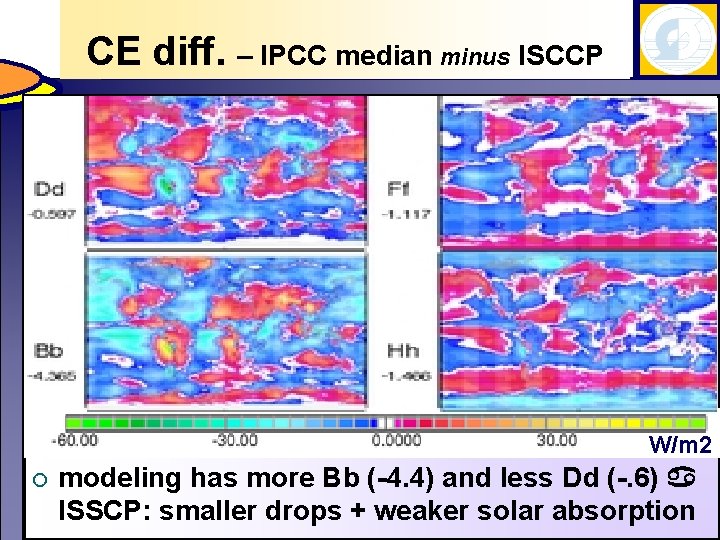
CE diff. – IPCC median minus ISCCP W/m 2 ¡ modeling has more Bb (-4. 4) and less Dd (-. 6) a ISSCP: smaller drops + weaker solar absorption
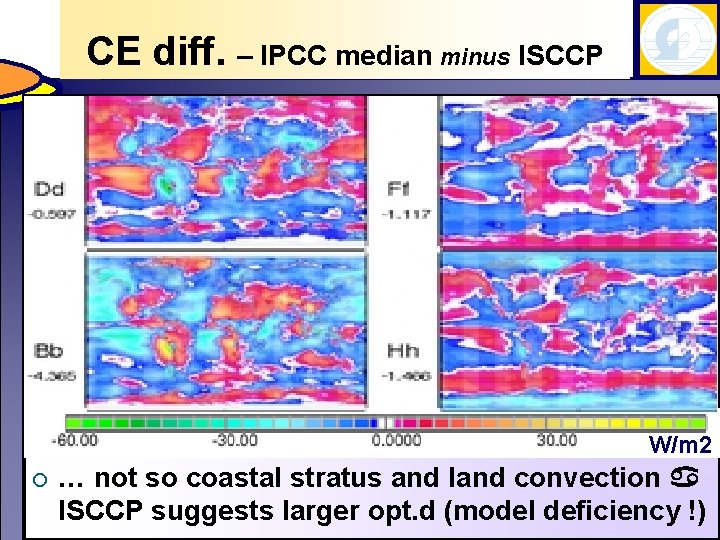
CE diff. – IPCC median minus ISCCP W/m 2 ¡ … not so coastal stratus and land convection a ISCCP suggests larger opt. d (model deficiency !)
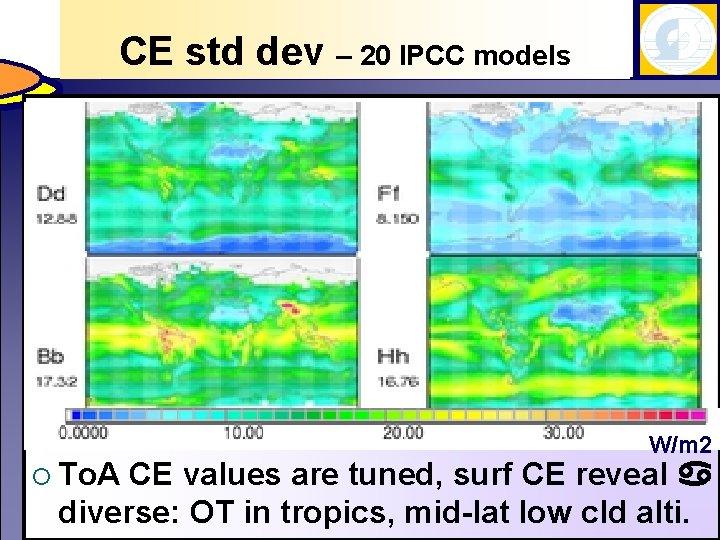
CE std dev – 20 IPCC models ¡ To. A W/m 2 CE values are tuned, surf CE reveal a diverse: OT in tropics, mid-lat low cld alti.
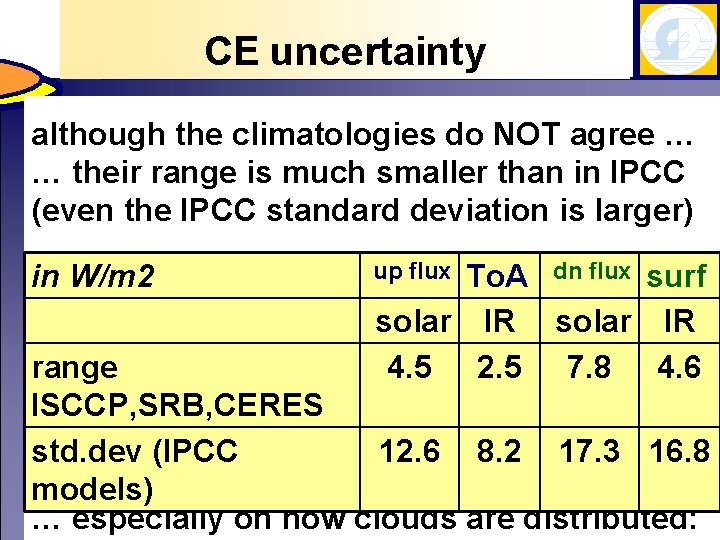
CE uncertainty although the climatologies do NOT agree … … their range is much smaller than in IPCC (even the IPCC standard deviation is larger) in W/m 2 up flux To. A dn flux surf solar IR 4. 5 2. 5 7. 8 4. 6 range ISCCP, SRB, CERES std. dev (IPCC 12. 6 8. 2 17. 3 16. 8 climatologies like ISCCP are useful testbeds models) … especially on how clouds are distributed:
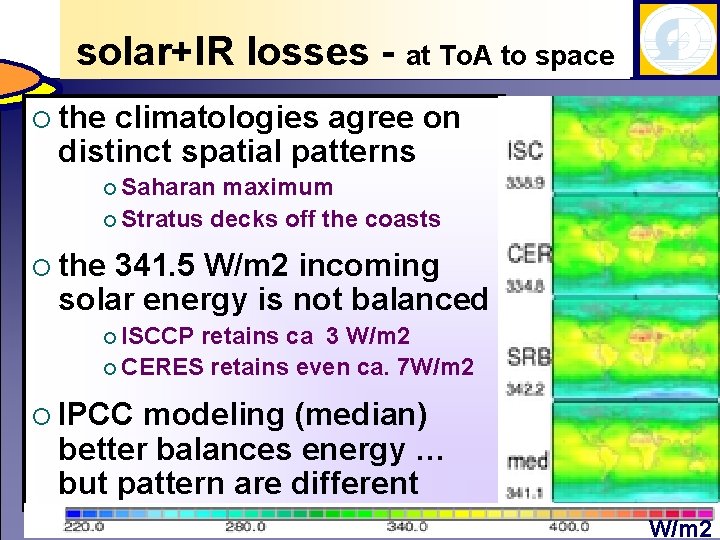
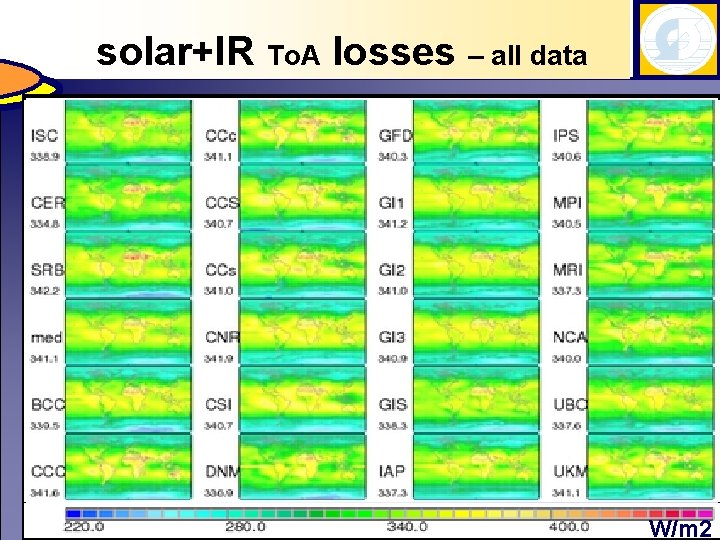
solar+IR losses - at To. A to space ¡ the climatologies agree on distinct spatial patterns ¡ Saharan maximum ¡ Stratus decks off the coasts ¡ the 341. 5 W/m 2 incoming solar energy is not balanced ¡ ISCCP retains ca 3 W/m 2 ¡ CERES retains even ca. 7 W/m 2 ¡ IPCC modeling (median) better balances energy … but pattern are different W/m 2
solar+IR and IR To. Alossesto – all space data W/m 2
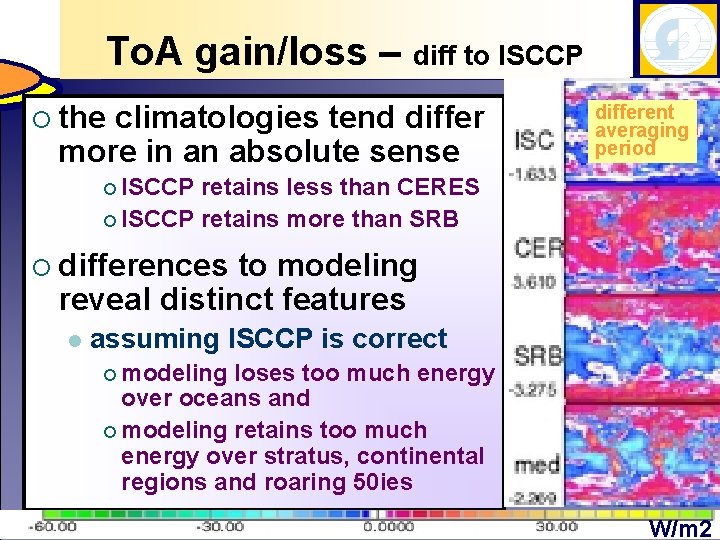
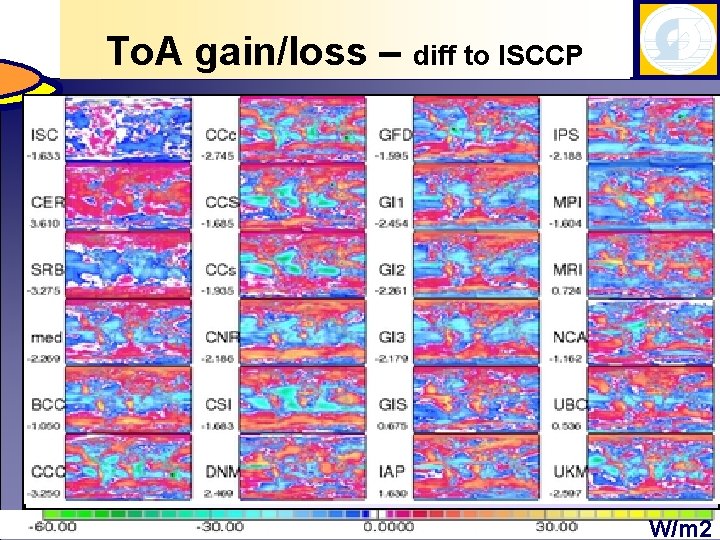
To. A gain/loss – diff to ISCCP ¡ the climatologies tend differ more in an absolute sense different averaging period ¡ ISCCP retains less than CERES ¡ ISCCP retains more than SRB ¡ differences to modeling reveal distinct features l assuming ISCCP is correct ¡ modeling loses too much energy over oceans and ¡ modeling retains too much energy over stratus, continental regions and roaring 50 ies W/m 2
To. A gain/loss – diff to ISCCP W/m 2
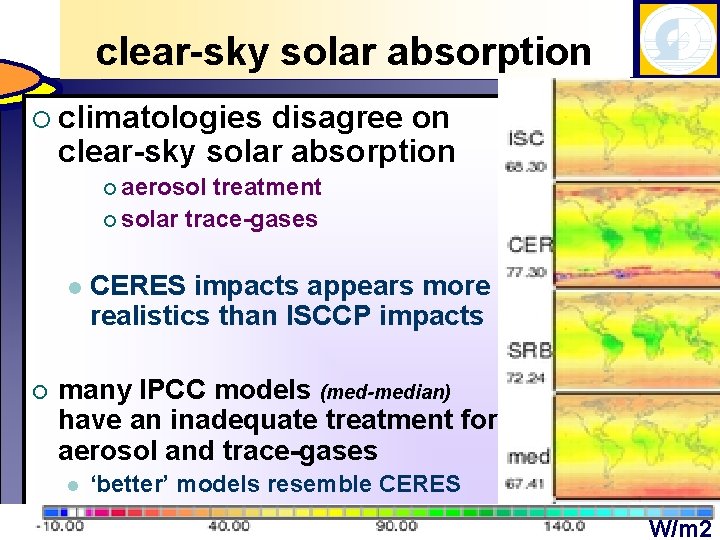
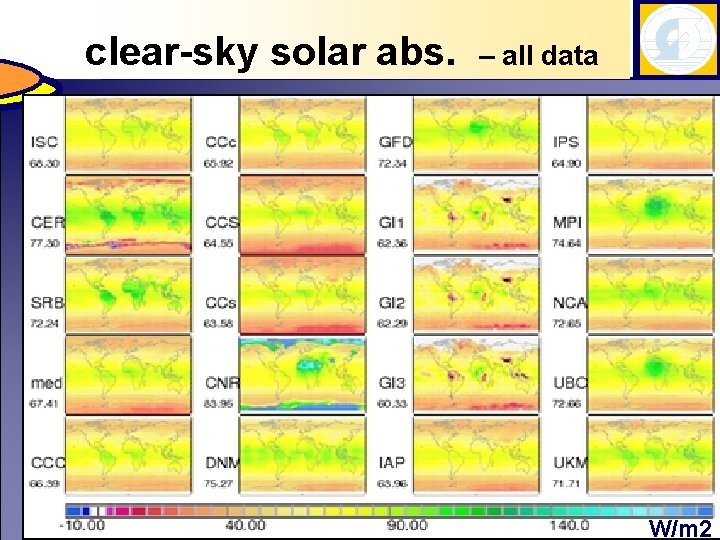
clear-sky solar absorption ¡ climatologies disagree on clear-sky solar absorption ¡ aerosol treatment ¡ solar trace-gases l ¡ CERES impacts appears more realistics than ISCCP impacts many IPCC models (med-median) have an inadequate treatment for aerosol and trace-gases l ‘better’ models resemble CERES W/m 2
solar clear-sky and IR solar losses abs. to– space all data W/m 2
summary (2) ¡ To. A planetary albedo differences (5 W/m 2) between ISCCP and CERES surprise ¡ ¡ TOA data are a tuning parameter to modeling despite unexpected diversity among three different cloud climatologies. . . the diversity in modeling is much larger ¡ there is agreement on distinct patterns ¡ l ¡ modeling can learn from climatologies ! in future ISCCP processing (10 km) it would be nice to update solar trace-gas absorption ¡ aerosol properties (GACP type algorithm ? ) ¡
extras
CE trends ? ¡ are there temporal trends is ISCCP CEs ?
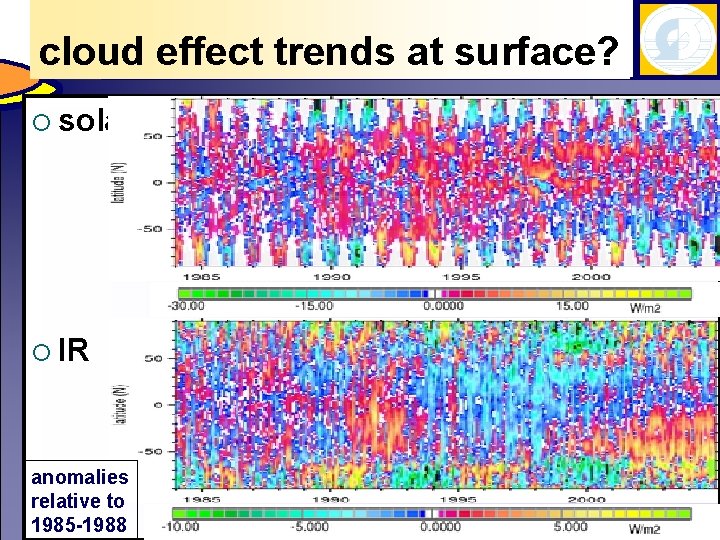
cloud effect trends at surface? ¡ solar ¡ IR anomalies relative to 1985 -1988
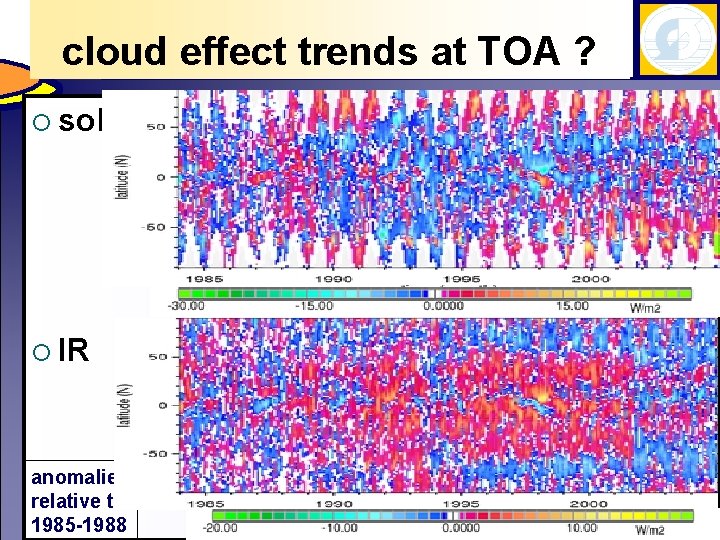
cloud effect trends at TOA ? ¡ solar ¡ IR anomalies relative to 1985 -1988