
Is the Juice Worth the Squeeze Bruce Heterick
Is the Juice Worth the Squeeze? Bruce Heterick, JSTOR Andrew Wells, UNSW Australia
Outline • The Library perspective • The Content provider perspective
Transformation of discovery From metasearch • Send a query to a (limited) number of targets • Compile the results • Z 39. 50 • Slow performance To web-scale index based • Send query to an index • Index contains metadata from a very large number of content providers • Link to content
What were the goals and why • Lots more stuff for users available • Continual move to an access model, not an acquisition one • Early web sites not easy for users to navigate • Search engines leaping ahead of libraries
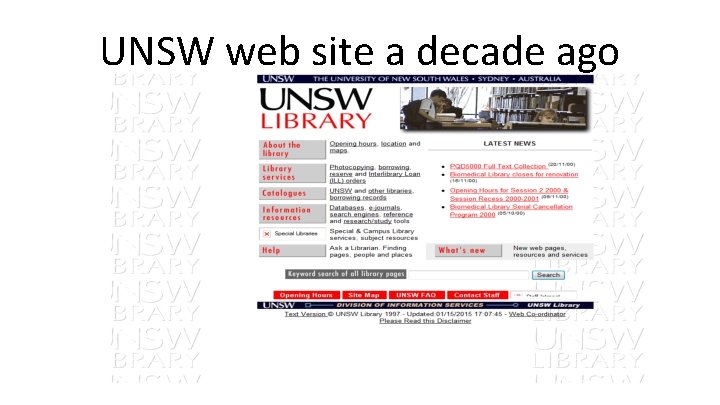
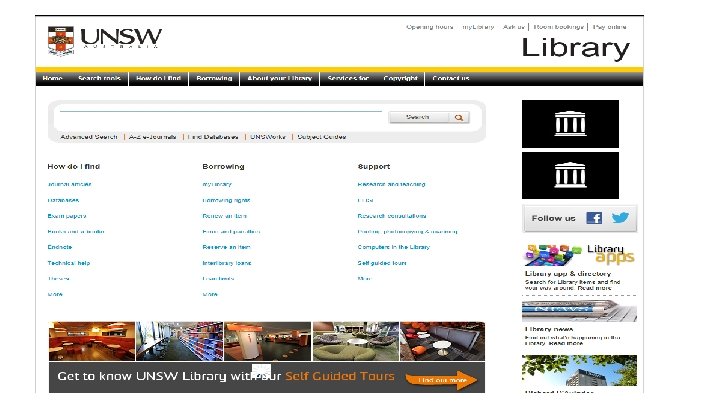
UNSW web site a decade ago
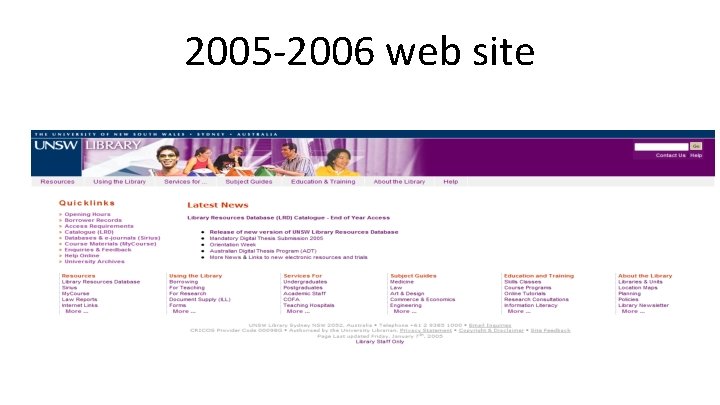
2005 -2006 web site
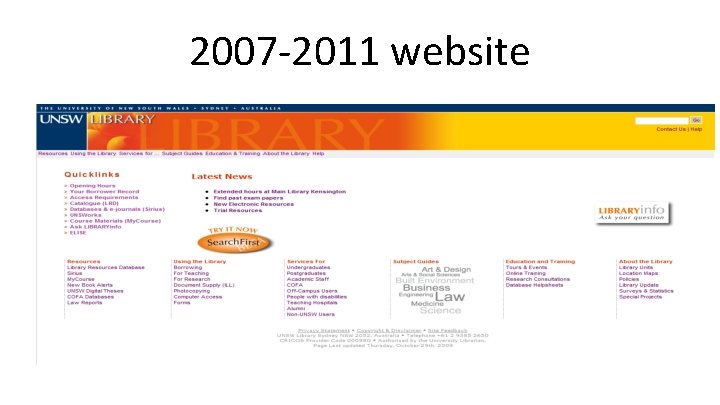
2007 -2011 website
2012 website • Google-like, driven by Primo • No separate catalogue
The squeeze is considerable • • Lots of effort Lots of experimentation Human resources Financial resources Source: makeuptutorials. com
The juice? • • What to measure Quantity? Quality? Audiences? Source: abc. net. au
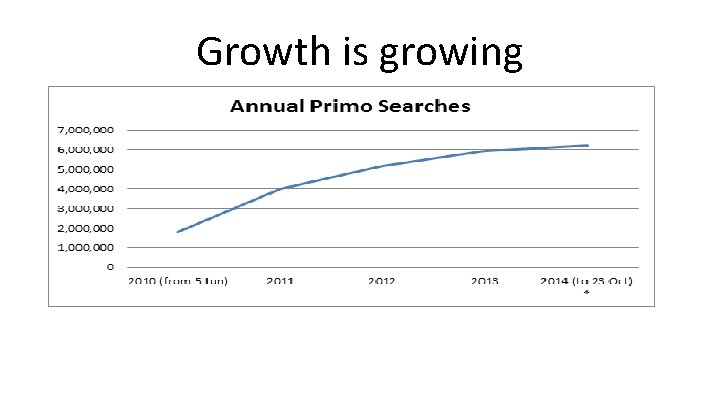
Growth is growing
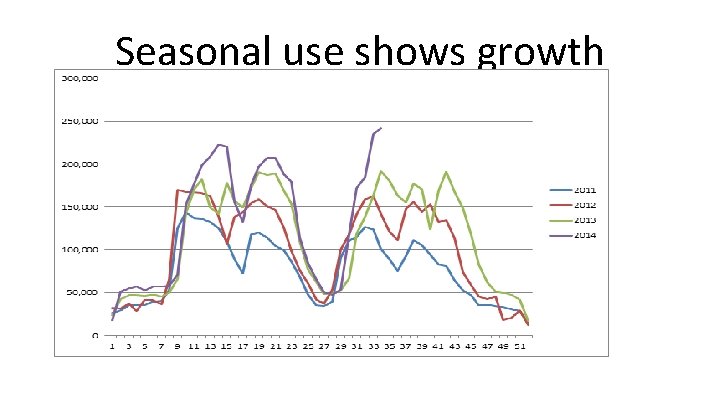
Seasonal use shows growth
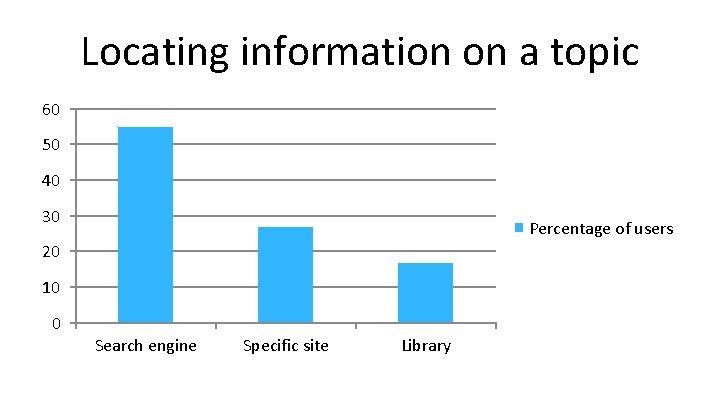
Locating information on a topic 60 50 40 30 Percentage of users 20 10 0 Search engine Specific site Library
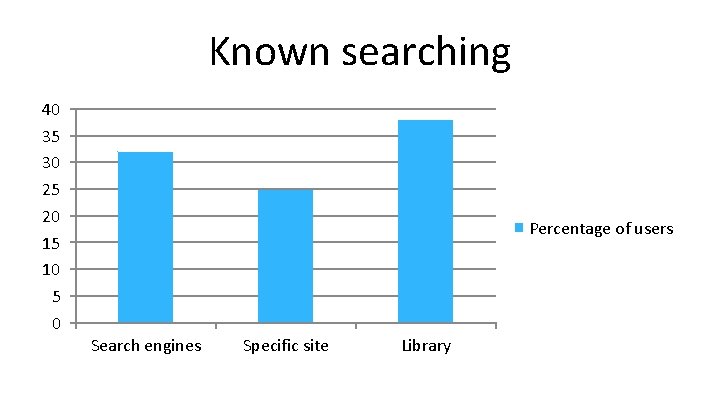
Known searching 40 35 30 25 20 15 10 5 0 Percentage of users Search engines Specific site Library
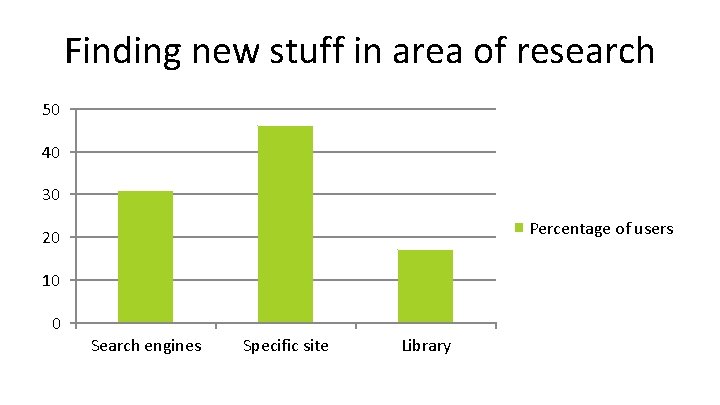
Finding new stuff in area of research 50 40 30 Percentage of users 20 10 0 Search engines Specific site Library
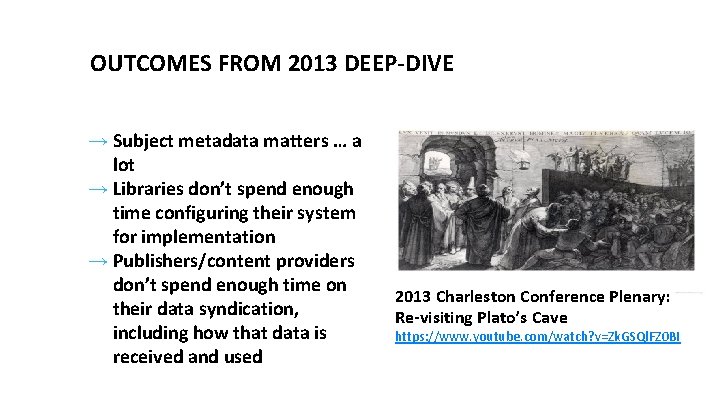
OUTCOMES FROM 2013 DEEP-DIVE → Subject metadata matters … a lot → Libraries don’t spend enough time configuring their system for implementation → Publishers/content providers don’t spend enough time on their data syndication, including how that data is received and used Image via Google 2013 Charleston Conference Plenary: Re-visiting Plato’s Cave https: //www. youtube. com/watch? v=Zk. GSQl. FZ 0 BI
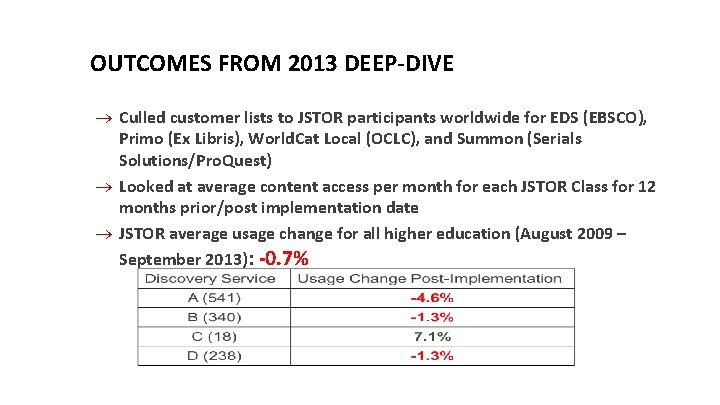
OUTCOMES FROM 2013 DEEP-DIVE Culled customer lists to JSTOR participants worldwide for EDS (EBSCO), Primo (Ex Libris), World. Cat Local (OCLC), and Summon (Serials Solutions/Pro. Quest) Looked at average content access per month for each JSTOR Class for 12 months prior/post implementation date JSTOR average usage change for all higher education (August 2009 – September 2013): -0. 7%
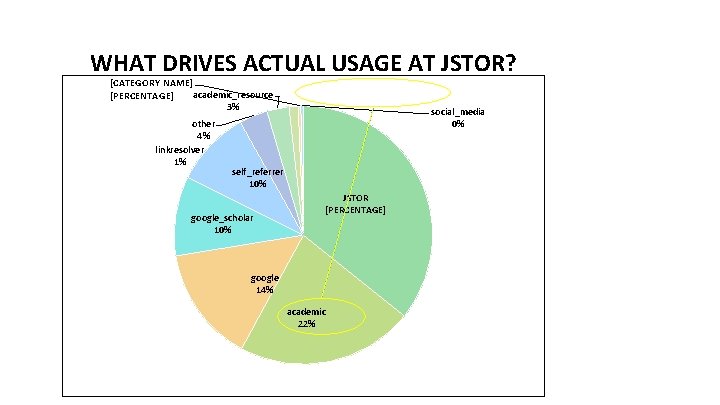
WHAT DRIVES ACTUAL USAGE AT JSTOR? [CATEGORY NAME] academic_resource [PERCENTAGE] 3% other 4% linkresolver 1% social_media 0% self_referrer 10% google_scholar 10% JSTOR [PERCENTAGE] google 14% academic 22%
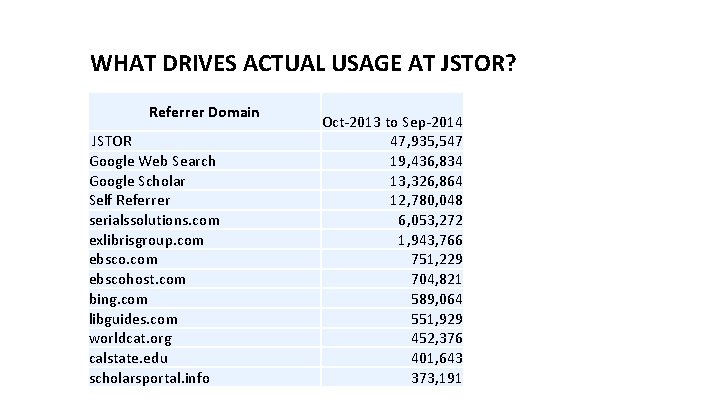
WHAT DRIVES ACTUAL USAGE AT JSTOR? Referrer Domain JSTOR Google Web Search Google Scholar Self Referrer serialssolutions. com exlibrisgroup. com ebscohost. com bing. com libguides. com worldcat. org calstate. edu scholarsportal. info Oct-2013 to Sep-2014 47, 935, 547 19, 436, 834 13, 326, 864 12, 780, 048 6, 053, 272 1, 943, 766 751, 229 704, 821 589, 064 551, 929 452, 376 401, 643 373, 191
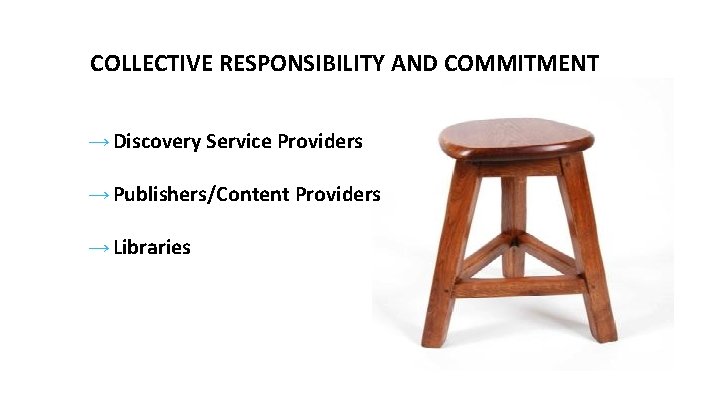
COLLECTIVE RESPONSIBILITY AND COMMITMENT → Discovery Service Providers → Publishers/Content Providers → Libraries
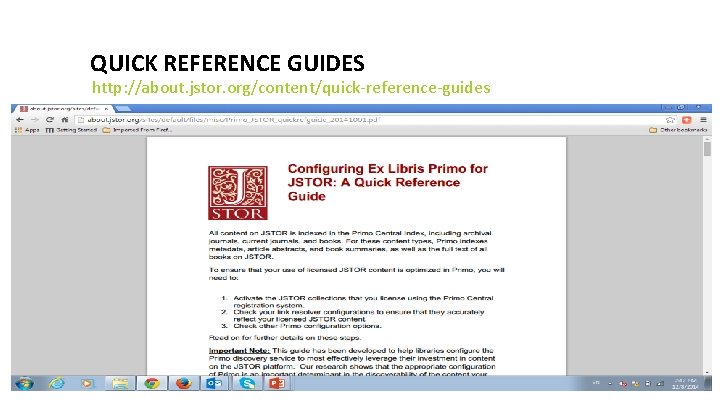
QUICK REFERENCE GUIDES http: //about. jstor. org/content/quick-reference-guides
- Slides: 22