Is statistics relevant to you personally Month 1


 # time True value")
 observations, determine “ ” and the “error on")


")


.")


 and you want f and")
 and you want f and")
 and you want f and")
 and you want f and")

 y 1")
=mx+b Is this a good “fit”? x")
=mx+b Is this a good fit? Why? x")
=mx+b Is this a good fit? x")
=mx+b Slope (m) is rise/run x")
=mx+b x")
=mx+b Garbage in Garbage out x")
=mx+b")
- Slides: 53
Is statistics relevant to you personally? Month 1 Month 2 Bush 42% 41% Dukakis 40% 43% Undecided 18% 16% 4% Headline: Dukakis surges past Bush in polls!
Is statistics relevant to you personally? Global Warming Analytical medical diagnostics Effect of EM radiation
What kinds of things can you measure quantitatively? What kinds of things can you measure qualitatively? What is the difference between a qualitative and quantitative measurement? Which of these types of measurement are important in science? In so far as possible, physics is exact and quantitative … though you will repeatedly see mathematical approximations made to get at the qualitative essence of phenomena.
A quantitative measurement is meaningless without a unit and error.
Accuracy: A measure of closeness to the “truth”. Precision: A measure of reproducibility.
Accuracy vs. precision accurate precise
Types of errors Statistical error: Results from a random fluctuation in the process of measurement. Often quantifiable in terms of “number of measurements or trials”. Tends to make measurements less precise. Systematic error: Results from a bias in the observation due to observing conditions or apparatus or technique or analysis. Tend to make measurements less accurate.
# time True value
Parent distribution (infinite number of measurements) # time True value
The game: From N (not infinite) observations, determine “ ” and the “error on ” … without knowledge of the “truth”. # time True value
The parent distribution can take different shapes, depending on the nature of the measurement. The two most common distributions one sees are the Gaussian and Poisson distributions.
Most probable value Highest on the curve. Most likely to show up in an experiment. Probability or number of counts x
Most probable value Median Value of x where 50% of measurements fall below and 50% of measurements fall above Probability or number of counts x
Most probable value Median Mean or average value of x Probability or number of counts x
The most common distribution one sees (and that which is best for guiding intuition) is the Gaussian distribution. counts x
For this distribution, the most probable value, the median value and the average are all the same due to symmetry. counts x
The most probable estimate of is given by the mean of the distribution of the N observations counts True value, x
counts True value, x
True value, x
Error goes like True value, But this particular quantity “averages” out to zero. Try f( -xi)2 instead. x
The “standard deviation” is a measure of the error in each of the N measurements. True value, x
is unknown. So use the mean (which is your best estimate of ). Change denominator to increase error slightly due to having used the mean. This is the form of the standard deviation you use in practice. This quantity cannot be determined from a single measurement.
Gaussian distribution counts x
Gaussian distribution intuition 1 is roughly half width at half max counts x
Gaussian distribution intuition Probability of a measurement falling within 1 of the mean is 0. 683 counts x
Gaussian distribution intuition Probability of a measurement falling within 2 of the mean is 0. 954 counts x
Gaussian distribution intuition Probability of a measurement falling within 3 of the mean is 0. 997 counts x
Month 1 Month 2 Bush 42% 41% Dukakis 40% 43% Undecided 18% 16% 4% Headline: Dukakis surges past Bush in polls!
The standard deviation is a measure of the error made in each individual measurement. Often you want to measure the mean and the error in the mean. Which should have a smaller error, an individual measurement or the mean? Error in the mean
Numerical example: Some say if Dante were alive now, he would describe hell in terms of taking a university course in physics. One vision brought to mind by some of the comments I’ve heard is that of the devil standing over the pit of hell gleefully dropping young, innocent, and hardworking students into the abyss in order to measure “g”, the acceleration due to gravity.
Student 1: 9. 0 m/s 2 Student 2: 8. 8 m/s 2 Student 3: 9. 1 m/s 2 Student 4: 8. 9 m/s 2 Student 5: 9. 1 m/s 2
Student 1: 9. 0 m/s 2 Student 2: 8. 8 m/s 2 Student 3: 9. 1 m/s 2 Student 4: 8. 9 m/s 2 Student 5: 9. 1 m/s 2
Student 1: 9. 0 m/s 2 Student 2: 8. 8 m/s 2 Student 3: 9. 1 m/s 2 Student 4: 8. 9 m/s 2 Student 5: 9. 1 m/s 2
How does an error in one measurable affect the error in another measurable? y y=F(x) y+ y y 1 y- y X- x x 1 x+ x x
The degree to which an error in one measurable affects the error in another is driven by the functional dependence of the variables (or the slope: dy/dx) y y=F(x) y+ y y 1 y- y X- x x 1 x+ x x
The complication Most physical relationships involve multiple measurables! y = F(x 1, x 2, x 3, …) Must take into account the dependence of the final measurable on each of the contributing quantities.
Partial derivatives What’s the slope of this graph? ? For multivariable functions, one needs to define a “derivative” at each point for each variable that projects out the local slope of the graph in the direction of that variable … this is the “partial derivative”.
Partial derivatives The partial derivative with respect to a certain variable is the ordinary derivative of the function with respect to that variable where all the other variables are treated as constants.
Example
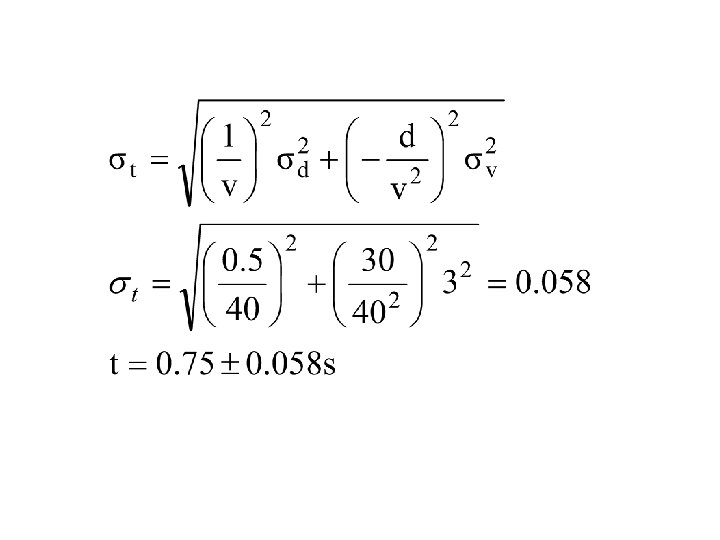
The formula for error propagation If f=F(x, y, z…) and you want f and you have x, y, z …, then use the following formula:
The formula for error propagation If f=F(x, y, z…) and you want f and you have x, y, z …, then use the following formula: Measure of error in x
The formula for error propagation If f=F(x, y, z…) and you want f and you have x, y, z …, then use the following formula: Measure of dependence of F on x
The formula for error propagation If f=F(x, y, z…) and you want f and you have x, y, z …, then use the following formula: Similar terms for each variable, add in quadrature.
Example A pitcher throws a baseball a distance of 30± 0. 5 m at 40± 3 m/s (~90 mph). From this data, calculate the time of flight of the baseball.
Why are linear relationships so important in analytical scientific work? y y=F(x) y 1 x
y y=F(x)=mx+b Is this a good “fit”? x
y y=F(x)=mx+b Is this a good fit? Why? x
y y=F(x)=mx+b Is this a good fit? x
Graphical analysis y pencil and paper still work! y=F(x)=mx+b Slope (m) is rise/run x b is the y-intercept
Graphical determination of error in slope and y-intercept y y=F(x)=mx+b x
Linear regression y With computers: y=F(x)=mx+b Garbage in Garbage out x
Linear regression Hypothesize a line y=F(x)=mx+b