IS Gap Management Interest Sensitive Gap Management Interest


 • Αν τα Interest Sensitive Assets σε")


")
")


*2. 68 + ($191/$974)*4. 97 = 2. 86 •")


- Slides: 65
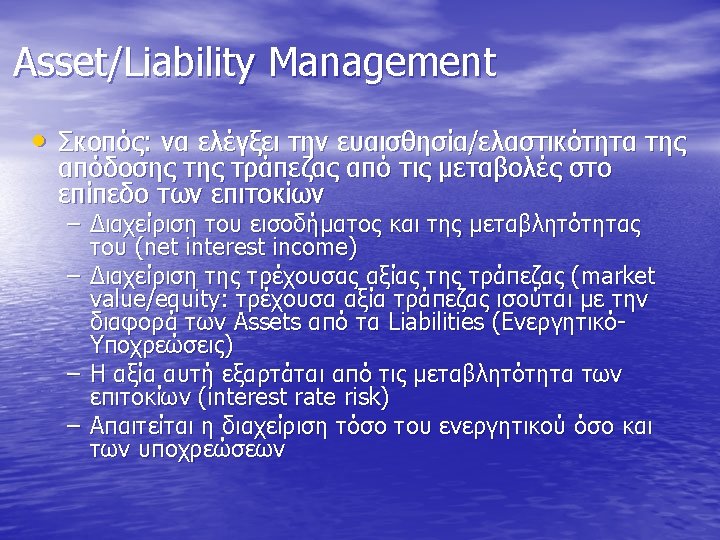
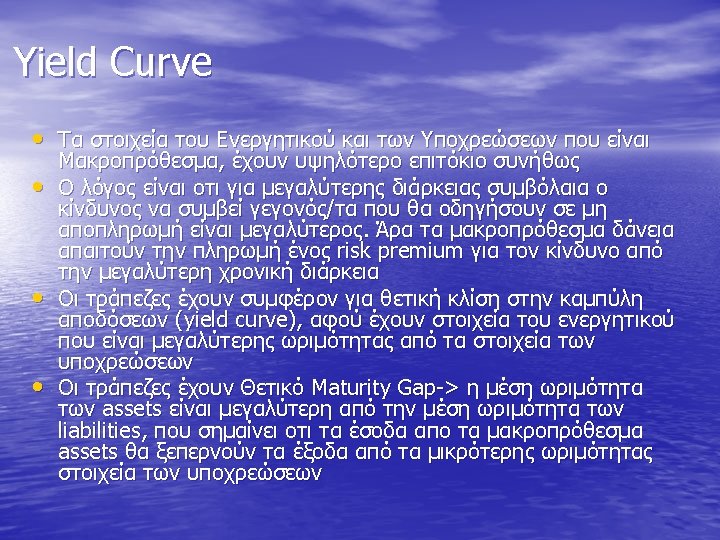
IS Gap Management (Interest Sensitive Gap Management) • Αν τα Interest Sensitive Assets σε κάθε περίοδο αναφοράς/προγραμματισμού (εβδομάδα, μήνα κ. τ. λ. ) είναι μικρότερα σε αξία από τα Interest Sensitive Liabilities τότε έχουμε Negative Gap • Negative Gap=Interest Sensitive Assets. Interest Sensitive Liabilities<0 -> Η τράπεζα αυτή λέγεται Liability Sensitive
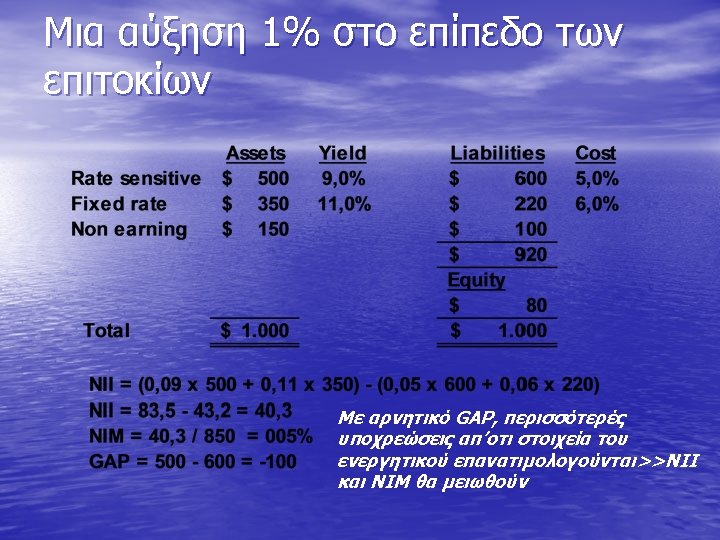
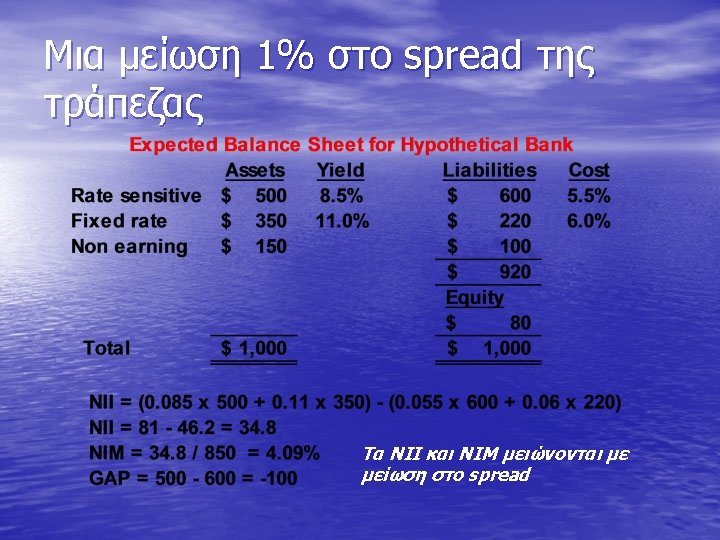
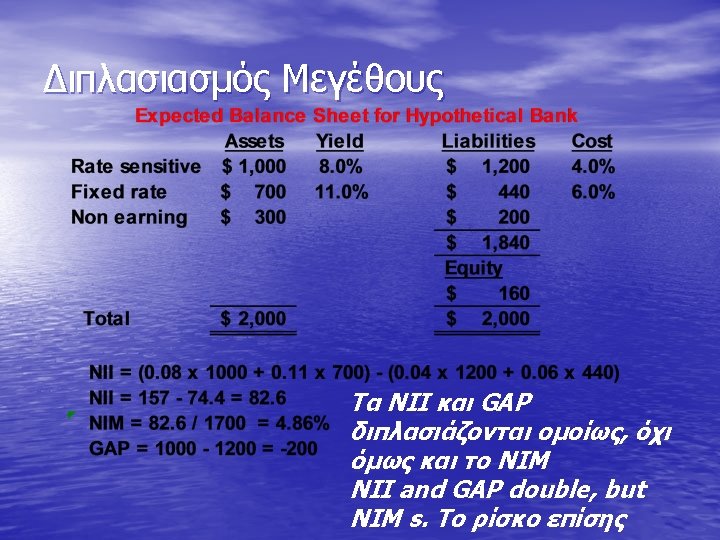
Changes in the Volume of Earning Assets and Interest-Bearing Liabilities • Net interest income varies directly with changes in the volume of earning assets and interest-bearing liabilities, regardless of the level of interest rates
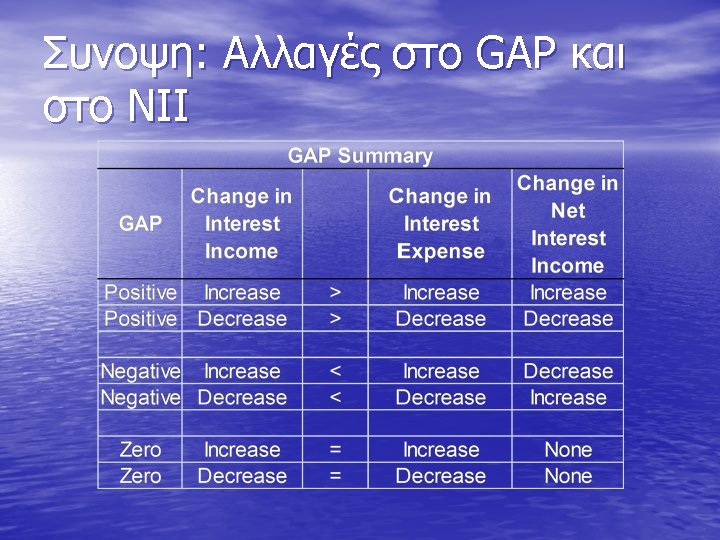
Changes in Net Interest Income are directly proportional to the size of the GAP • If there is a parallel shift in the yield curve: • It is rare, however, when the yield curve shifts parallel – If rates do not change by the same amount and at the same time, then net interest income may change by more or less.
Measuring Interest Rate Risk with Duration GAP • Economic Value of Equity Analysis – Focuses on changes in stockholders’ equity given potential changes in interest rates • Duration GAP Analysis – Compares the price sensitivity of a bank’s total assets with the price sensitivity of its total liabilities to assess the impact of potential changes in interest rates on stockholders’ equity.
• Duration is a measure of the effective maturity of a security. – Duration incorporates the timing and size of a security’s cash flows. – Duration measures how price sensitive a security is to changes in interest rates. • The greater (shorter) the duration, the greater (lesser) the price sensitivity.
Duration and Price Volatility • Duration as an Elasticity Measure – Duration versus Maturity • Consider the cash flows for these two securities over the following time line
Duration versus Maturity • The maturity of both is 20 years – Maturity does not account for the differences in timing of the cash flows • What is the effective maturity of both? – The effective maturity of the first security is: • (1, 000/1, 000) x 20 = 20 years – The effective maturity of the second security is: • [(900/1, 000) x 1]+[(100/1, 000) x 20] = 2. 9 years • Duration is similar, however, it uses a weighted average of the present values of the cash flows
Duration versus Maturity Duration is an approximate measure of the price elasticity of demand
Duration versus Maturity • The longer the duration, the larger the change in price for a given change in interest rates.
Measuring Duration • Duration is a weighted average of the time until the expected cash flows from a security will be received, relative to the security’s price – Macaulay’s Duration
Measuring Duration • Example – What is the duration of a bond with a $1, 000 face value, 10% annual coupon payments, 3 years to maturity and a 12% YTM? The bond’s price is $951. 96.
Measuring Duration • Example – What is the duration of a bond with a $1, 000 face value, 10% annual coupon payments, 3 years to maturity and a 12% YTM? The bond’s price is $951. 96.
Measuring Duration • Example – What is the duration of a bond with a $1, 000 face value, 10% coupon, 3 years to maturity but the YTM is 5%? The bond’s price is $1, 136. 16.
Measuring Duration • Example – What is the duration of a bond with a $1, 000 face value, 10% coupon, 3 years to maturity but the YTM is 20%? The bond’s price is $789. 35.
Measuring Duration • Example – What is the duration of a zero coupon bond with a $1, 000 face value, 3 years to maturity but the YTM is 12%? • By definition, the duration of a zero coupon bond is equal to its maturity
Duration and Modified Duration • The greater the duration, the greater the price sensitivity • Modified Duration gives an estimate of price volatility:
Duration GAP • Duration GAP Model – Focuses on either managing the market value of stockholders’ equity • The bank can protect EITHER the market value of equity or net interest income, but not both • Duration GAP analysis emphasizes the impact on equity
Duration GAP • Duration GAP Analysis – Compares the duration of a bank’s assets with the duration of the bank’s liabilities and examines how the economic value stockholders’ equity will change when interest rates change.
Price Risk • If interest rates change, the value of assets and liabilities also change. – The longer the duration, the larger the change in value for a given change in interest rates • Duration GAP considers the impact of changing rates on the market value of equity
Steps in Duration GAP Analysis • Forecast interest rates. • Estimate the market values of bank assets, • liabilities and stockholders’ equity. Estimate the weighted average duration of assets and the weighted average duration of liabilities. – Incorporate the effects of both on- and offbalance sheet items. These estimates are used to calculate duration gap. • Forecasts changes in the market value of stockholders’ equity across different interest rate environments.
Weighted Average Duration of Bank Assets • Weighted Average Duration of Bank Assets (DA) – Where • wi = Market value of asset i divided by the market value of all bank assets • Dai = Macaulay’s duration of asset i • n = number of different bank assets
Weighted Average Duration of Bank Liabilities • Weighted Average Duration of Bank Liabilities (DL) – Where • zj = Market value of liability j divided by the market value of all bank liabilities • Dlj= Macaulay’s duration of liability j • m = number of different bank liabilities
Duration GAP and Economic Value of Equity • Let MVA and MVL equal the market values of • assets and liabilities, respectively. If: and Duration GAP • Then: • where y = the general level of interest rates
Duration GAP and Economic Value of Equity • To protect the economic value of equity against any change when rates change , the bank could set the duration gap to zero:
Calculating DGAP • DA – ($683/$974)*2. 68 + ($191/$974)*4. 97 = 2. 86 • DA – ($614/$906)*1. 00 + ($292/$906)*2. 80 = 1. 58 • DGAP – 2. 86 - ($906/$974) * 1. 58 = 1. 36 years • What does 1. 36 mean? – The average duration of assets is greater than the average duration of liabilities, thus asset values change by more than liability values.
Change in the Market Value of Equity • In this case:
Positive and Negative Duration GAPs • Positive DGAP – Indicates that assets are more price sensitive than liabilities, on average. • Thus, when interest rates rise (fall), assets will fall proportionately more (less) in value than liabilities and EVE will fall (rise) accordingly. • Negative DGAP – Indicates that weighted liabilities are more price sensitive than weighted assets. • Thus, when interest rates rise (fall), assets will fall proportionately less (more) in value that liabilities and the EVE will rise (fall).
An Immunized Portfolio • To immunize the EVE from rate changes in the example, the bank would need to: – decrease the asset duration by 1. 42 years or – increase the duration of liabilities by 1. 54 years – DA / ( MVA/MVL) = 1. 42 / ($920 / $1, 000) = 1. 54 years