Irrigation R Nolan Clark USDAAgricultural Research Service Bushland

Irrigation R. Nolan Clark USDA-Agricultural Research Service Bushland, TX


Top 10 States - Irrigated Acres State USDA USGS California 8, 139, 834 10, 100, 000 Nebraska 5, 692, 215 7, 820, 000 Texas 5, 237, 584 6, 490, 000 Arkansas 4, 043, 382 4, 510, 000 Idaho 3, 188, 406 3, 750, 000 Colorado 2, 942, 230 3, 400, 000 Kansas 2, 650, 486 3, 310, 000 Montana 1, 740, 873 1, 720, 000 Florida 1, 613, 719 2, 060, 000 Washington 1, 554, 813 1, 570, 000

Source of Water
 State USDA USGS California Texas 25, 153, 495 7, 473,")
Irrigation Water Use (ac-ft) State USDA USGS California Texas 25, 153, 495 7, 473, 880 34, 200, 000 9, 680, 000 Idaho 6, 030, 447 19, 100, 000 Arkansas 5, 516, 603 8, 870, 000 Colorado 5, 052, 612 12, 800, 000 Nebraska 4, 975, 330 9, 860, 000 Arizona 4, 117, 652 6, 060, 000 Kansas 3, 589, 226 4, 160, 000 Washington 3, 364, 585 3, 400, 000 Oregon 3, 255, 501 6, 810, 000
 State USDA USGS Arizona 4. 7 6. 2 California 3. 1")
Application Rate (ac-ft/ac) State USDA USGS Arizona 4. 7 6. 2 California 3. 1 3. 4 Washington 2. 2 Oregon 2. 1 3. 1 Idaho 1. 9 5. 1 Colorado 1. 7 3. 8 Arkansas 1. 4 2. 0 Kansas 1. 4 1. 3 Texas 1. 4 1. 5 Nebraska 0. 9 1. 3

The Ogallala Aquifer

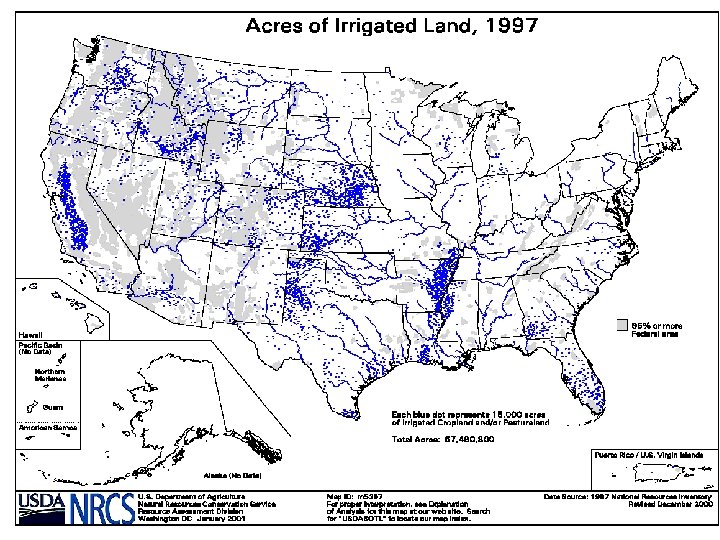
Total Irrigated Acres Census of Agriculture

Surface Applications Sprinkler Applications

Efficiencies of Irrigation Methods

Method of Distribution

Colorado

Texas

Colorado, Percent by Acres

Kansas, Percent of Acres

Texas, Percent by Acres

Colorado

Texas
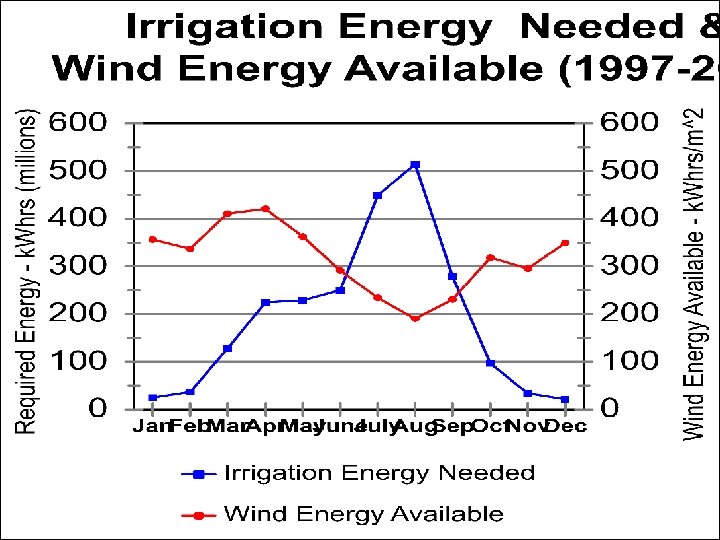

Powering Electric Pumps • Average size 40 -50 k. W • Existing electric grid 480 V, 3 -phase • Issues: – Market for off-season electric power – Meeting peak demand in summer

Powering Gas/Diesel Pumps • Average size 120 -140 k. W • Existing electric grid 120 -240 V, singlephase • Issues: – Weak grid for excess power generated – Stand-by generator to meet peak demand in summer
- Slides: 25