
Irrigation Management and Technologies Freddie Lamm KSU Northwest

- Slides: 27
Irrigation Management and Technologies Freddie Lamm KSU Northwest Research Extension Center, Colby, Kansas Norm Klocke KSU Northwest Research Extension Center, Garden City, Kansas Danny Rogers KSU Department of Biological and Agricultural Engineering, Manhattan, Kansas Many state, regional, and national collaborators, but to name a very important few from K-State, Mahbub Alam, Ag Engr. , Loyd Stone, Soil Physicist, Alan Schlegel, Soil Scientist, Troy Dumler, Bill Golden, and Dan O’Brien, Ag Economists. 1 of 22
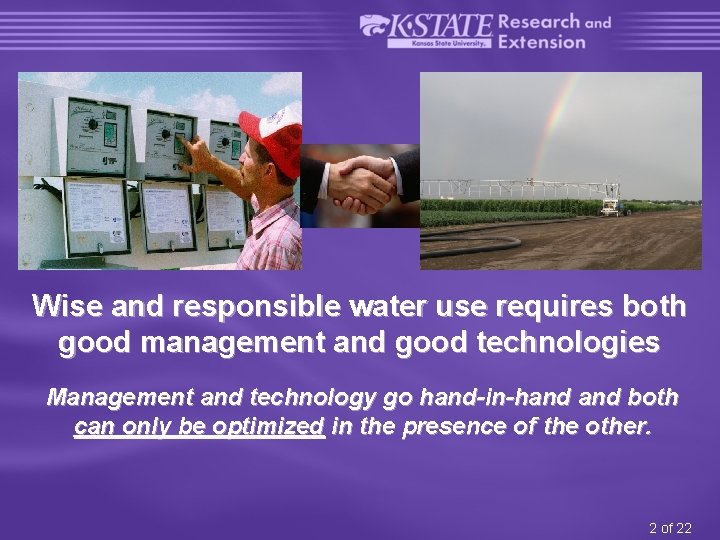
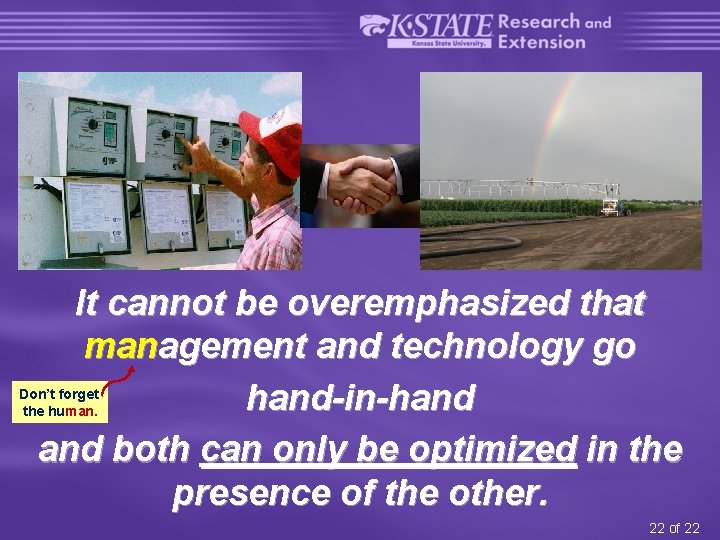
Wise and responsible water use requires both good management and good technologies Management and technology go hand-in-hand both can only be optimized in the presence of the other. 2 of 22
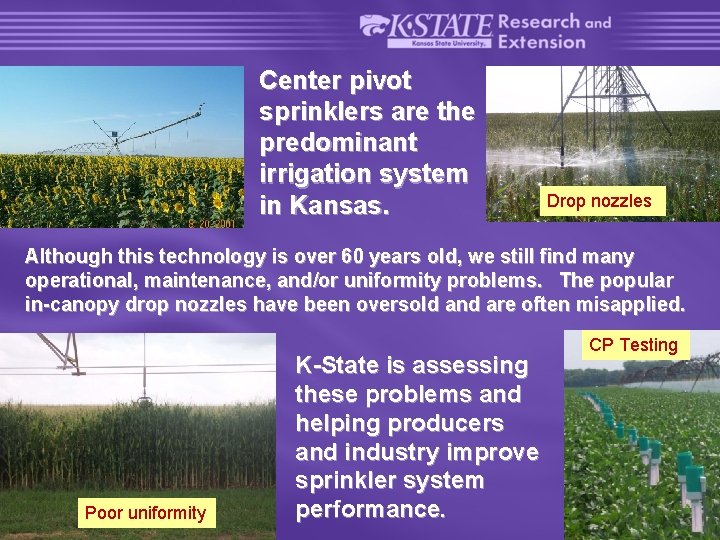
Center pivot sprinklers are the predominant irrigation system in Kansas. Drop nozzles Although this technology is over 60 years old, we still find many operational, maintenance, and/or uniformity problems. The popular in-canopy drop nozzles have been oversold and are often misapplied. Poor uniformity K-State is assessing these problems and helping producers and industry improve sprinkler system performance. CP Testing 3 of 22
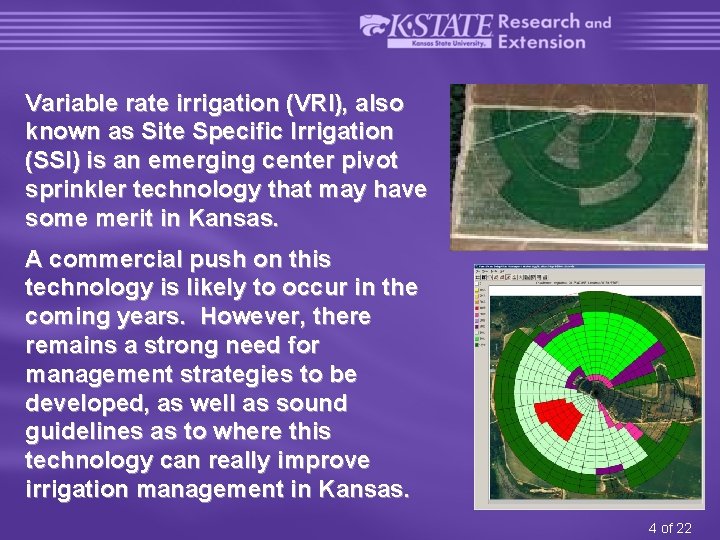
Variable rate irrigation (VRI), also known as Site Specific Irrigation (SSI) is an emerging center pivot sprinkler technology that may have some merit in Kansas. A commercial push on this technology is likely to occur in the coming years. However, there remains a strong need for management strategies to be developed, as well as sound guidelines as to where this technology can really improve irrigation management in Kansas. 4 of 22
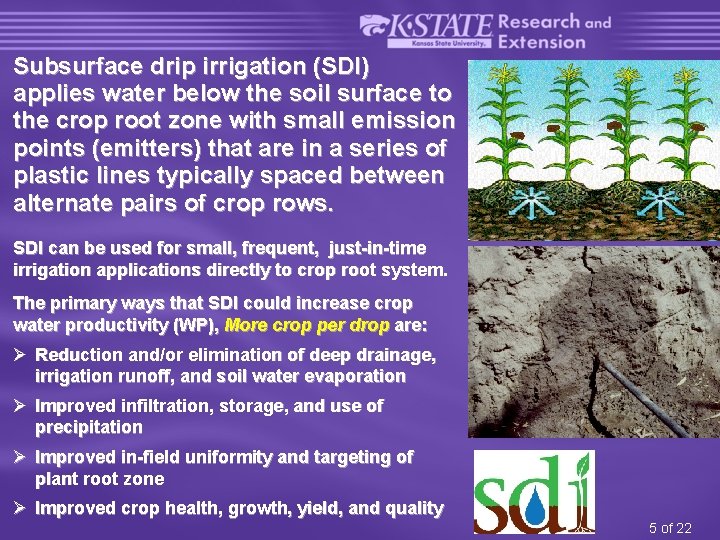
Subsurface drip irrigation (SDI) applies water below the soil surface to the crop root zone with small emission points (emitters) that are in a series of plastic lines typically spaced between alternate pairs of crop rows. SDI can be used for small, frequent, just-in-time irrigation applications directly to crop root system. The primary ways that SDI could increase crop water productivity (WP), More crop per drop are: Ø Reduction and/or elimination of deep drainage, irrigation runoff, and soil water evaporation Ø Improved infiltration, storage, and use of precipitation Ø Improved in-field uniformity and targeting of plant root zone Ø Improved crop health, growth, yield, and quality 5 of 22
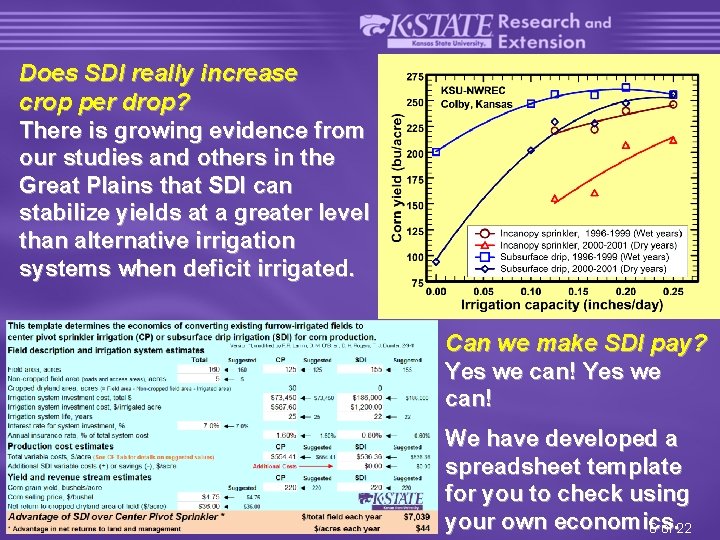
Does SDI really increase crop per drop? There is growing evidence from our studies and others in the Great Plains that SDI can stabilize yields at a greater level than alternative irrigation systems when deficit irrigated. Can we make SDI pay? Yes we can! We have developed a spreadsheet template for you to check using your own economics. 6 of 22
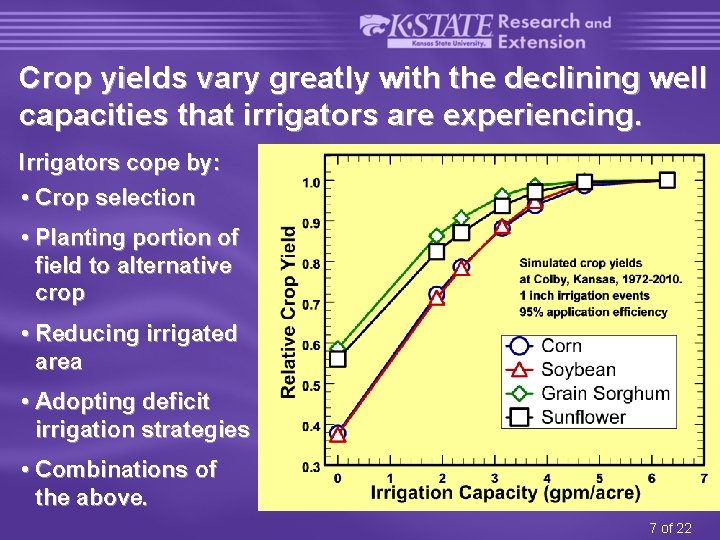
Crop yields vary greatly with the declining well capacities that irrigators are experiencing. Irrigators cope by: • Crop selection • Planting portion of field to alternative crop • Reducing irrigated area • Adopting deficit irrigation strategies • Combinations of the above. 7 of 22
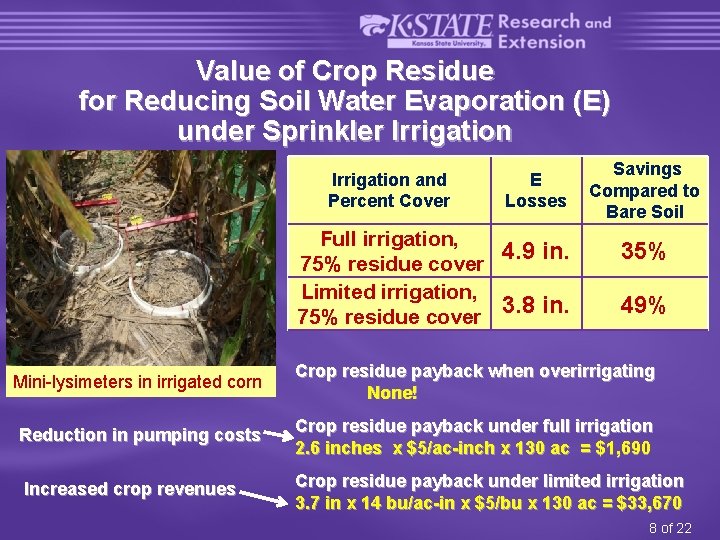
Value of Crop Residue for Reducing Soil Water Evaporation (E) under Sprinkler Irrigation and Percent Cover E Losses Full irrigation, 4. 9 in. 75% residue cover Limited irrigation, 3. 8 in. 75% residue cover Savings Compared to Bare Soil 35% 49% Mini-lysimeters in irrigated corn Crop residue payback when overirrigating None! Reduction in pumping costs Crop residue payback under full irrigation 2. 6 inches x $5/ac-inch x 130 ac = $1, 690 Increased crop revenues Crop residue payback under limited irrigation 3. 7 in x 14 bu/ac-in x $5/bu x 130 ac = $33, 670 8 of 22
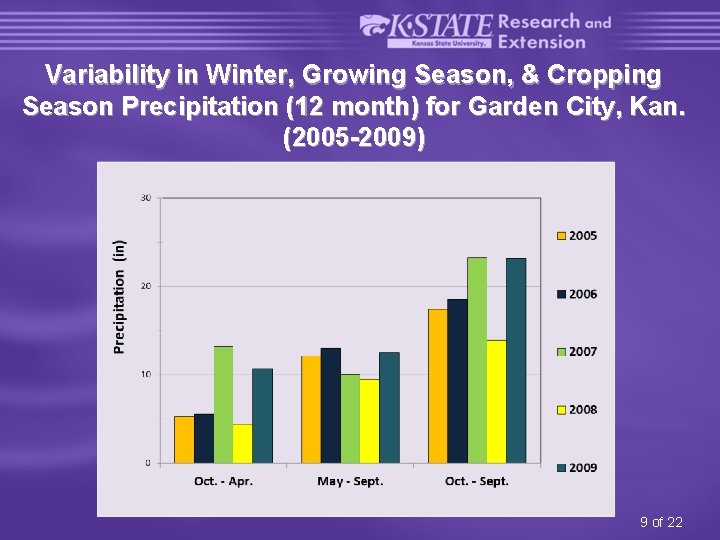
Variability in Winter, Growing Season, & Cropping Season Precipitation (12 month) for Garden City, Kan. (2005 -2009) 9 of 22
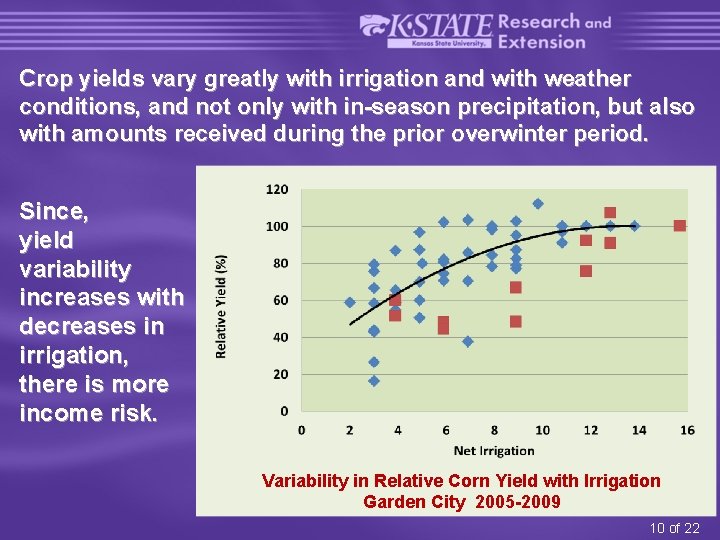
Crop yields vary greatly with irrigation and with weather conditions, and not only with in-season precipitation, but also with amounts received during the prior overwinter period. Since, yield variability increases with decreases in irrigation, there is more income risk. Variability in Relative Corn Yield with Irrigation Garden City 2005 -2009 10 of 22
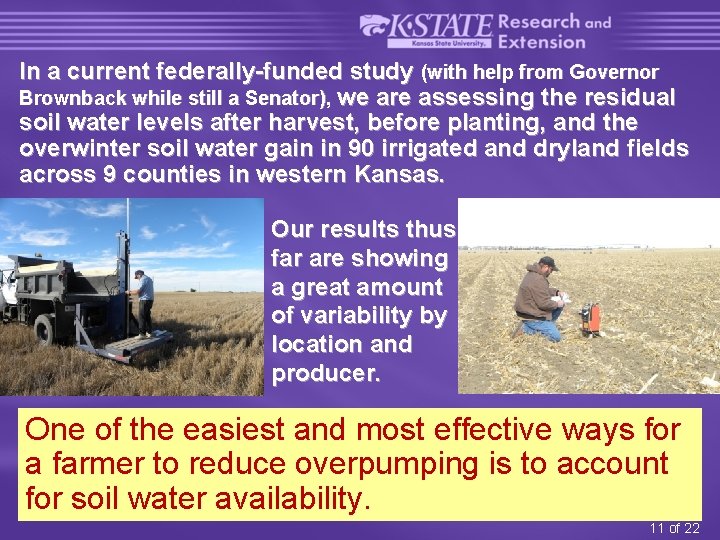
In a current federally-funded study (with help from Governor Brownback while still a Senator), we are assessing the residual soil water levels after harvest, before planting, and the overwinter soil water gain in 90 irrigated and dryland fields across 9 counties in western Kansas. Our results thus far are showing a great amount of variability by location and producer. One of the easiest and most effective ways for a farmer to reduce overpumping is to account for soil water availability. 11 of 22
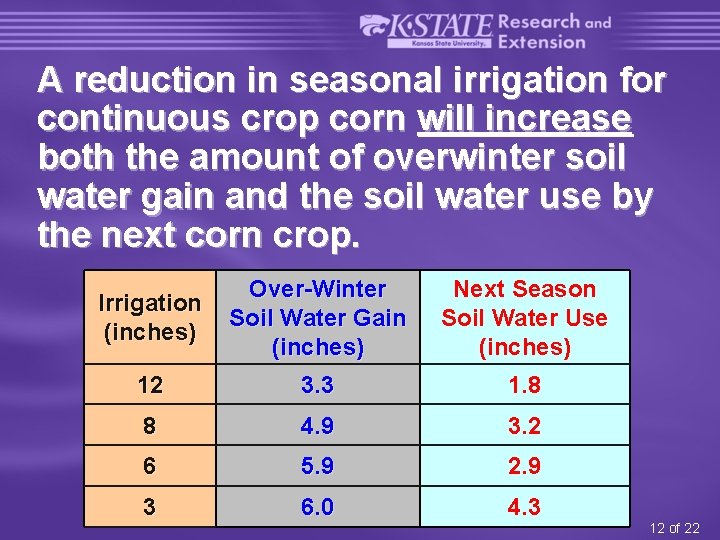
A reduction in seasonal irrigation for continuous crop corn will increase both the amount of overwinter soil water gain and the soil water use by the next corn crop. Irrigation (inches) Over-Winter Soil Water Gain (inches) Next Season Soil Water Use (inches) 12 3. 3 1. 8 8 4. 9 3. 2 6 5. 9 2. 9 3 6. 0 4. 3 12 of 22
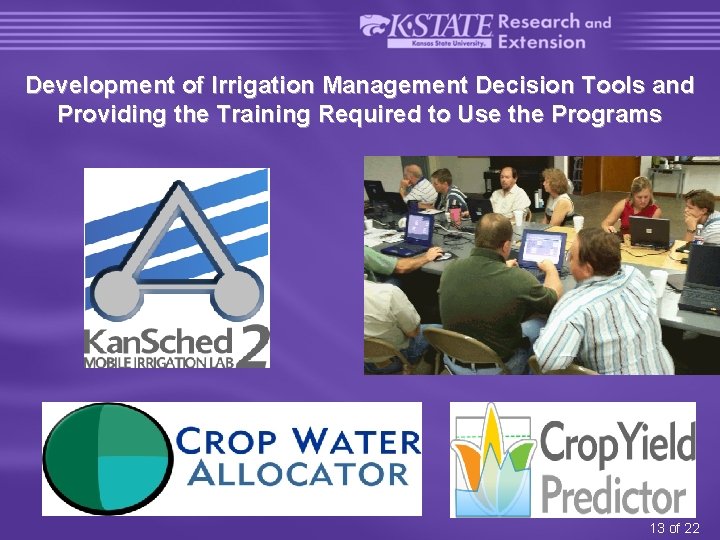
Development of Irrigation Management Decision Tools and Providing the Training Required to Use the Programs 13 of 22
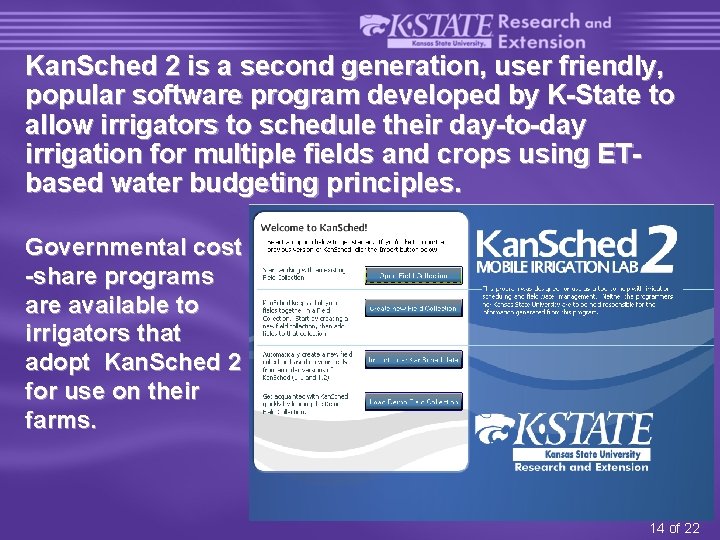
Kan. Sched 2 is a second generation, user friendly, popular software program developed by K-State to allow irrigators to schedule their day-to-day irrigation for multiple fields and crops using ETbased water budgeting principles. Governmental cost -share programs are available to irrigators that adopt Kan. Sched 2 for use on their farms. 14 of 22
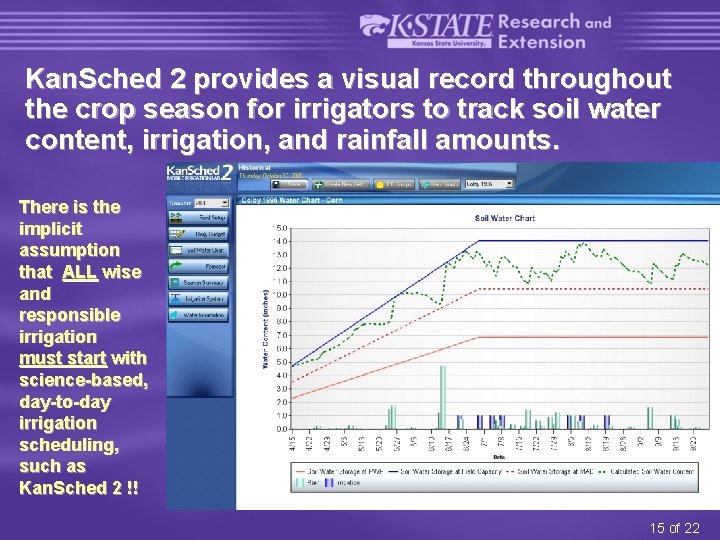
Kan. Sched 2 provides a visual record throughout the crop season for irrigators to track soil water content, irrigation, and rainfall amounts. There is the implicit assumption that ALL wise and responsible irrigation must start with science-based, day-to-day irrigation scheduling, such as Kan. Sched 2 !! 15 of 22
Ø Find best crop combinations to utilize limited irrigation. Ø Find best allocation of irrigation over chosen crops. Ø Find economic returns for all combinations of crops and irrigation. Ø Choose crop/irrigation combination: For best economic return; Compatible with crop management systems; For acceptable income risk. 16 of 22
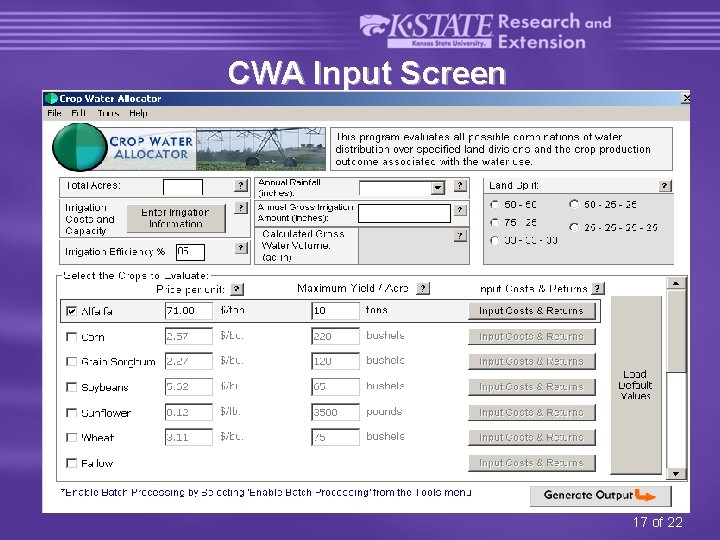
CWA Input Screen 17 of 22
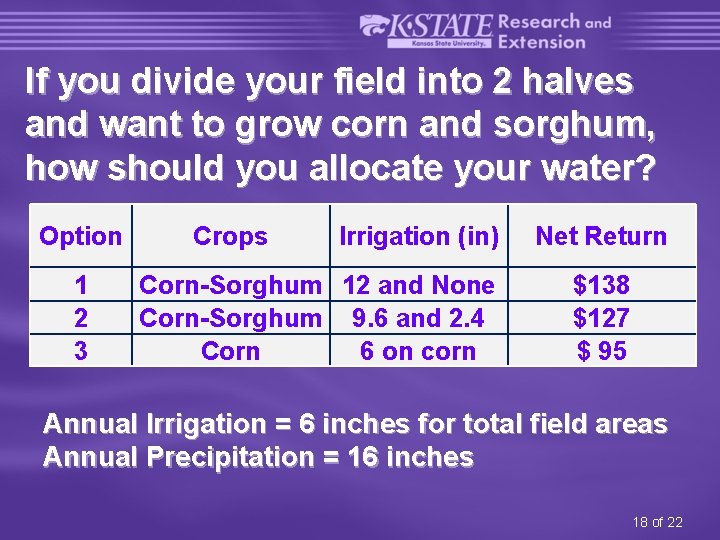
If you divide your field into 2 halves and want to grow corn and sorghum, how should you allocate your water? Option 1 2 3 Crops Irrigation (in) Corn-Sorghum 12 and None Corn-Sorghum 9. 6 and 2. 4 Corn 6 on corn Net Return $138 $127 $ 95 Annual Irrigation = 6 inches for total field areas Annual Precipitation = 16 inches 18 of 22
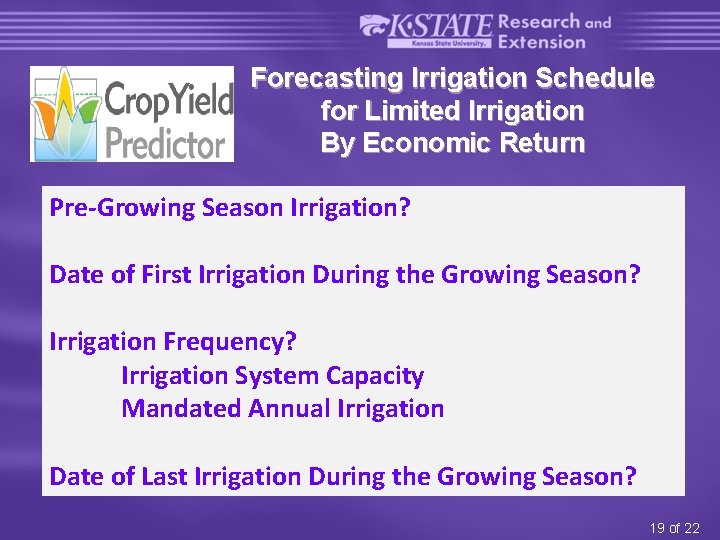
Forecasting Irrigation Schedule for Limited Irrigation By Economic Return Pre-Growing Season Irrigation? Date of First Irrigation During the Growing Season? Irrigation Frequency? Irrigation System Capacity Mandated Annual Irrigation Date of Last Irrigation During the Growing Season? 19 of 22
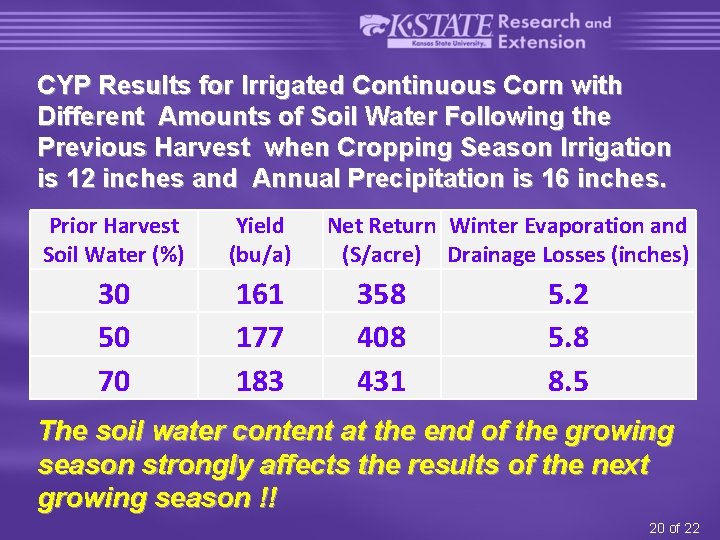
CYP Results for Irrigated Continuous Corn with Different Amounts of Soil Water Following the Previous Harvest when Cropping Season Irrigation is 12 inches and Annual Precipitation is 16 inches. Prior Harvest Soil Water (%) Yield (bu/a) 30 50 70 161 177 183 Net Return Winter Evaporation and (S/acre) Drainage Losses (inches) 358 408 431 5. 2 5. 8 8. 5 The soil water content at the end of the growing season strongly affects the results of the next growing season !! 20 of 22
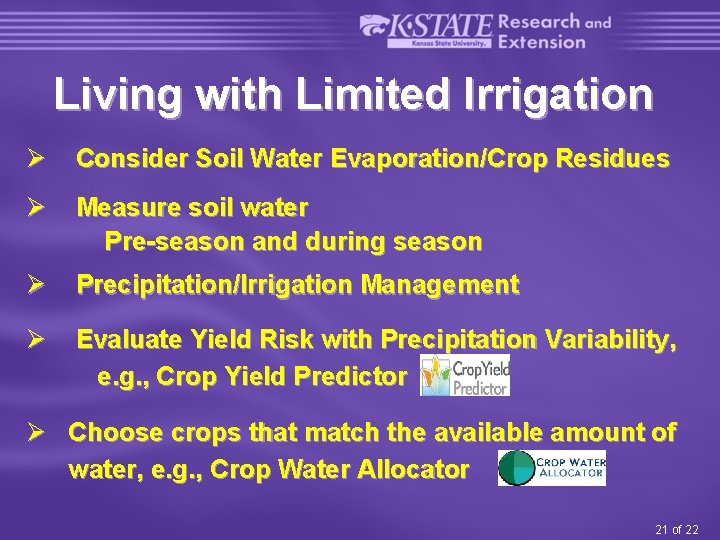
Living with Limited Irrigation Ø Consider Soil Water Evaporation/Crop Residues Ø Measure soil water Pre-season and during season Ø Precipitation/Irrigation Management Ø Evaluate Yield Risk with Precipitation Variability, e. g. , Crop Yield Predictor Ø Choose crops that match the available amount of water, e. g. , Crop Water Allocator 21 of 22
It cannot be overemphasized that management and technology go hand-in-hand both can only be optimized in the presence of the other. Don’t forget the human. 22 of 22
List of K-State Research and Extension Irrigation-Related Websites: Mobile Irrigation Lab http: //mobileirrigationlab. com/ General Irrigation Topics at K-State http: //www. ksre. ksu. edu/irrigate/ SDI in the Great Plains http: //www. ksre. ksu. edu/sdi/ The next Central Plains Irrigation Conference will be held in Colby, Kansas, February 21 -22, 2012. 23 of 22
Some Key Kansas Irrigation Trends 24 of 22
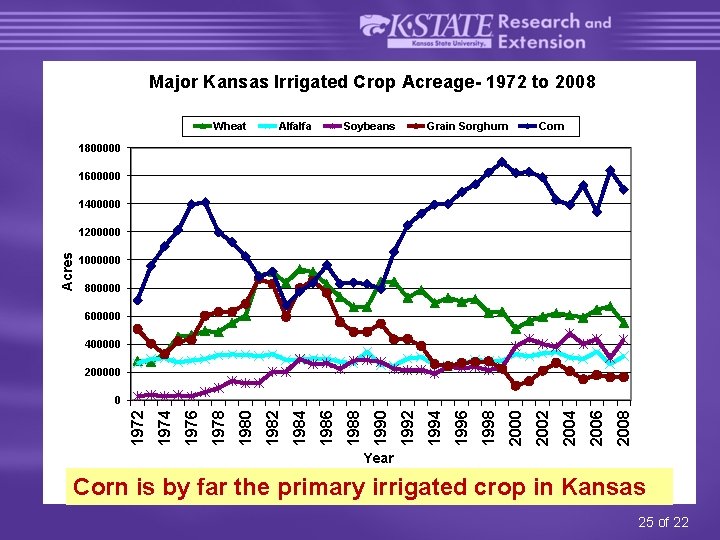
Major Kansas Irrigated Crop Acreage- 1972 to 2008 Wheat Alfalfa Soybeans Grain Sorghum Corn 1800000 1600000 1400000 Acres 1200000 1000000 800000 600000 400000 2008 2006 2004 2002 2000 1998 1996 1994 1992 1990 1988 1986 1984 1982 1980 1978 1976 1974 1972 0 Year Corn is by far the primary irrigated crop in Kansas 25 of 22
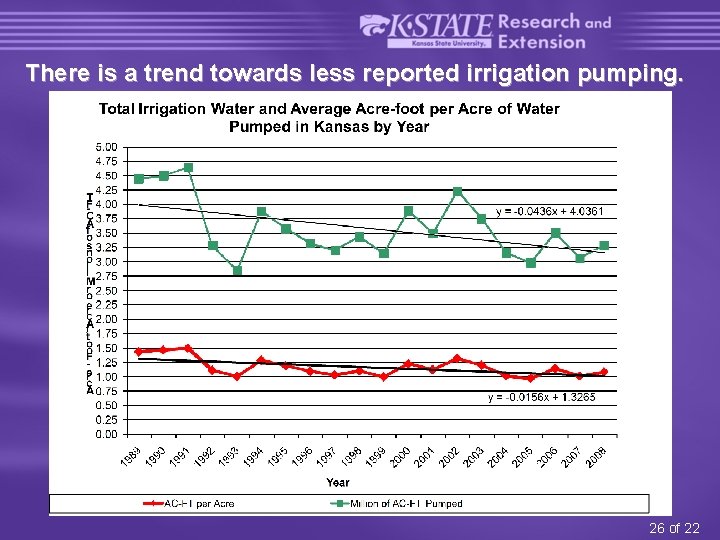
There is a trend towards less reported irrigation pumping. 26 of 22
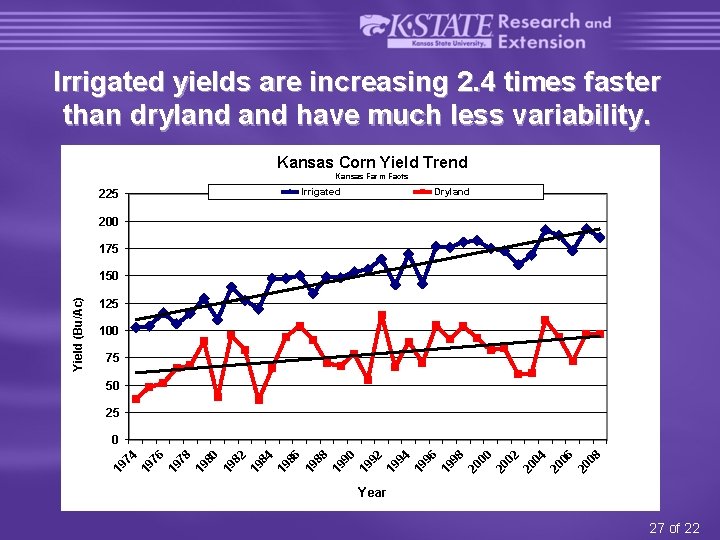
Irrigated yields are increasing 2. 4 times faster than dryland have much less variability. Kansas Corn Yield Trend Kansas Farm Facts Irrigated 225 Dryland 200 175 125 100 75 50 25 78 19 80 19 82 19 84 19 86 19 88 19 90 19 92 19 94 19 96 19 98 20 00 20 02 20 04 20 06 20 08 19 76 19 74 0 19 Yield (Bu/Ac) 150 Year 27 of 22