IRIS Data Tools and Animations John Taber Tammy

IRIS Data Tools and Animations John Taber, Tammy Bravo, Michael Hubenthal, Jenda Johnson
")
Outline • • • Seismicity Teachable Moments Animations Seismogram viewer Prepackaged record sections (SPUD) Seismogram retrieval (Web services)
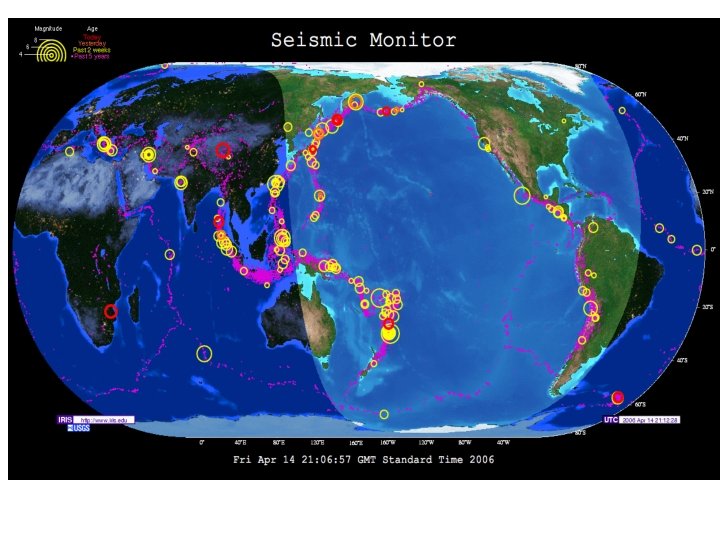

www. iris. edu/ieb IRIS Earthquake Browser Explore global, regional, and local seismicity Both recent and historic events Easy to use and based on Google maps

Regional Seismicity

Explore Plate Boundaries

Exploring Forecasting & Prediction

Export Data

Teachable Moment slide sets • Newsworthy earthquakes motivate students to learn more about seismology • Wide range of online resources available but college faculty and teachers have little time to prepare • Slide sets produced within 1 day – Most content from other groups, particularly USGS – Try to tell a story – In English and Spanish

Magnitude 8. 8 OFFSHORE MAULE, CHILE Saturday, February 27, 2010 at 06: 34: 17 UTC This earthquake occurred at the boundary between the Nazca and South American tectonic plates. The two plates are converging at a rate of 80 mm per year. The earthquake occurred as thrust-faulting on the interface between the two plates, with the Nazca plate moving down and landward below the South American plate. Simplified diagram of thrust faulting during a subduction zone earthquake. The sudden motion along the fault displaces massive volumes of seawater creating a tsunami. (© 1999 Zeke Smith) USGS Centroid Moment Tensor Solution The tension axis (T) reflects the minimum compressive stress direction. The pressure axis (P) reflects the maximum compressive stress direction. Images courtesy of the U. S. Geological Survey

Magnitude 8. 8 OFFSHORE MAULE, CHILE Saturday, February 27, 2010 at 06: 34: 17 UTC Although magnitude is still an important measure of the size of an earthquake, particularly for public consumption, seismic moment is a more physically meaningful measure of earthquake size. Seismic moment is proportional to the product of the slip on the fault and the area of the fault that slips. These “maps” of the slip on the fault surfaces of the January 12 th M 7. 0 Haitian earthquake and the M 8. 8 Chilean earthquake show that, although the slip in Chile was only about 50% greater, the fault area was vastly larger. This accounts for the release of approximately 500 times more energy in the Chilean earthquake than in the Haiti earthquake. Chile Haiti Images courtesy of the U. S. Geological Survey

NZ eq animation

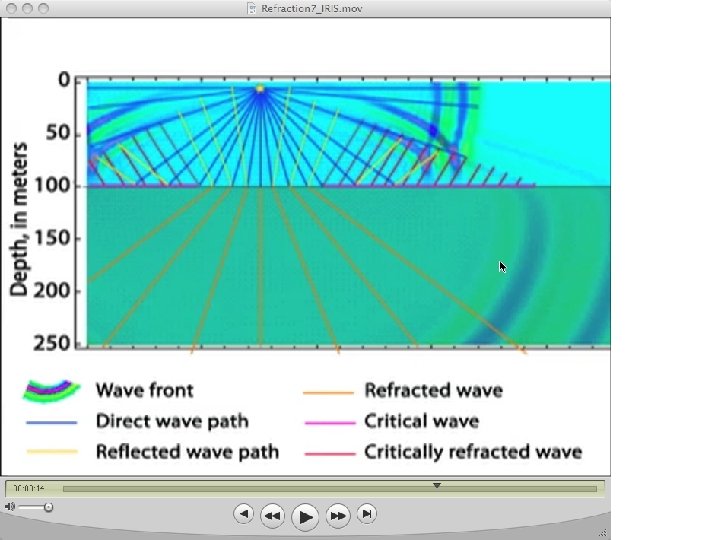
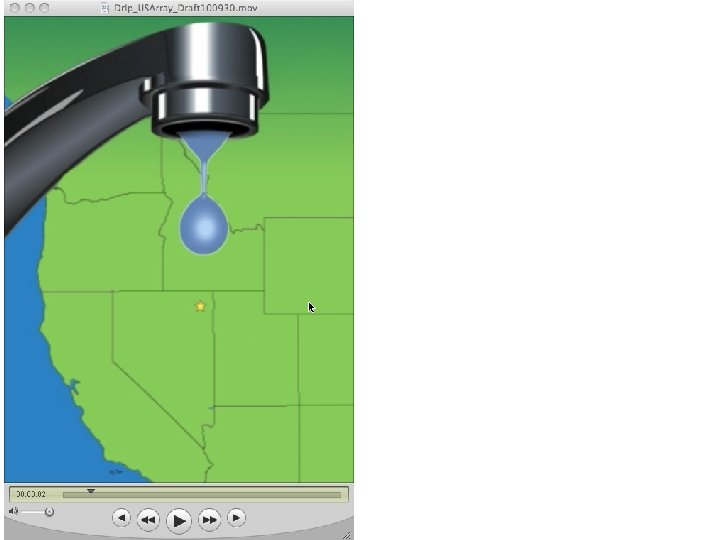
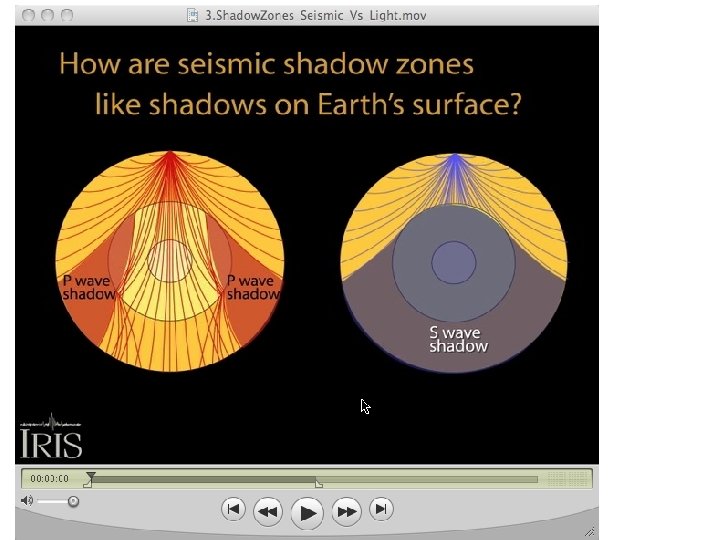
Animations • Over 40 animations available online – Created by Jenda Johnson • Illustrating concepts related to plate tectonics, earth structure, earthquakes, and volcanoes • Includes background information and teaching sequences using multiple animations • Linked to activities and Teachable Moments http: //www. iris. edu/hq/programs/education_and_outreach/anim ations
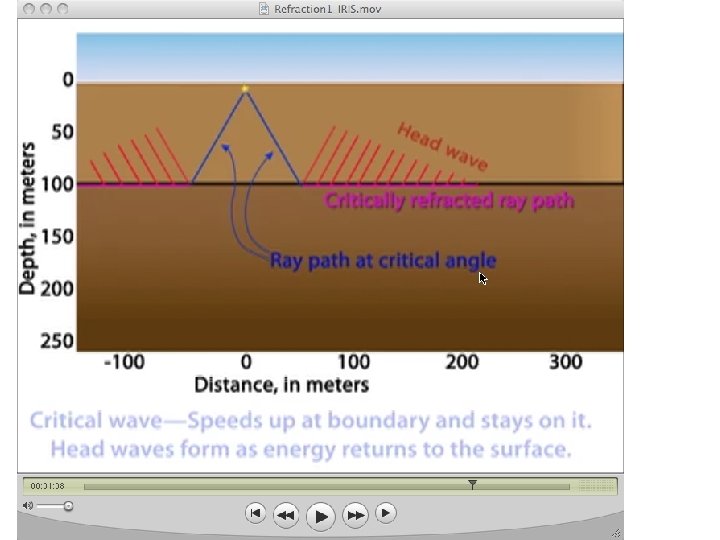

Based on Tom Boyd wave front movie

Student sequence www. iris. edu/explore

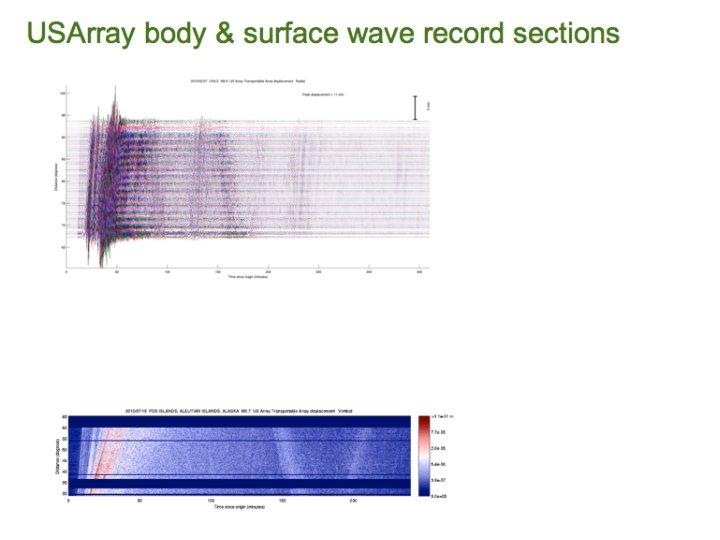
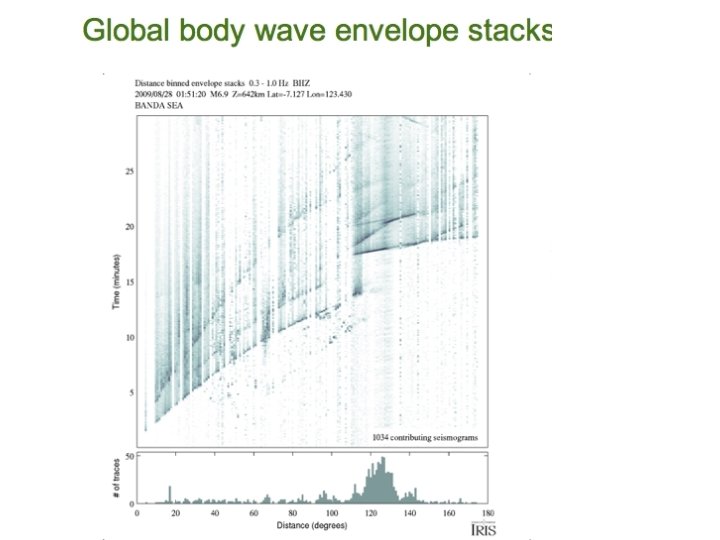
Prepackaged Record Sections from the Data Management Center

Description at www. iris. edu/ dms/products/eventplot Data at www. iris. edu/spud

Web services www. iris. edu/ws/timeseries/builder

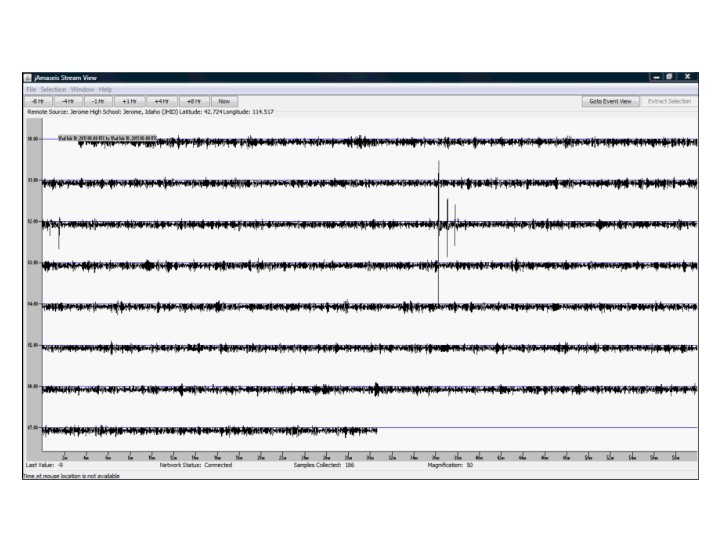
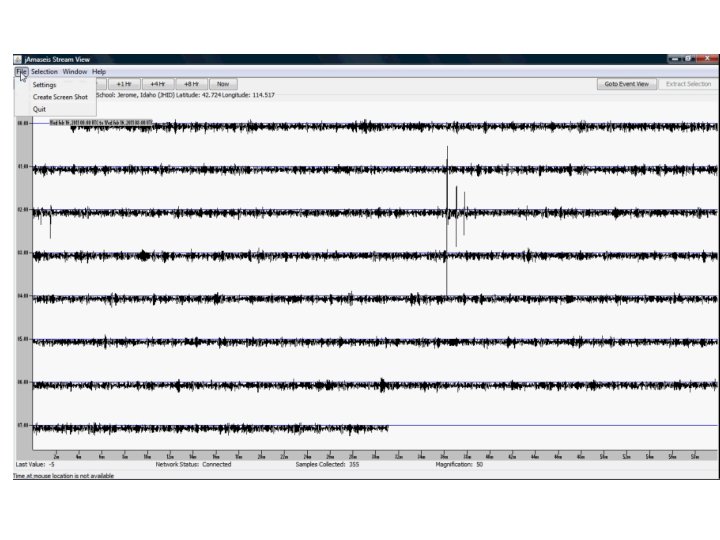
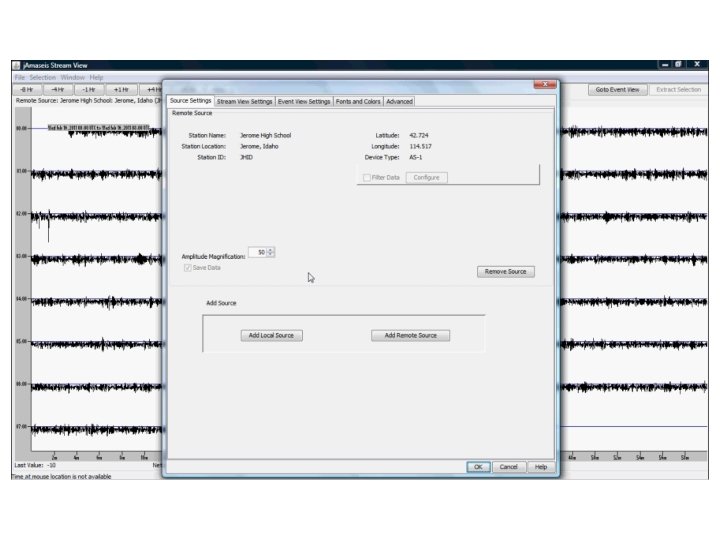
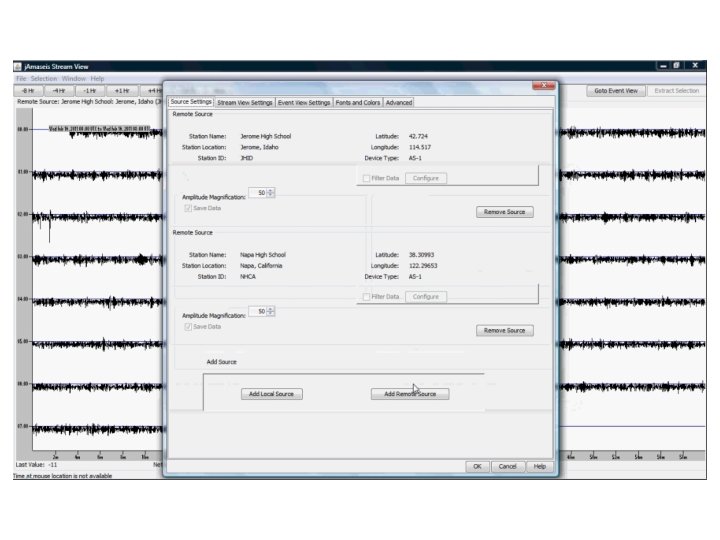
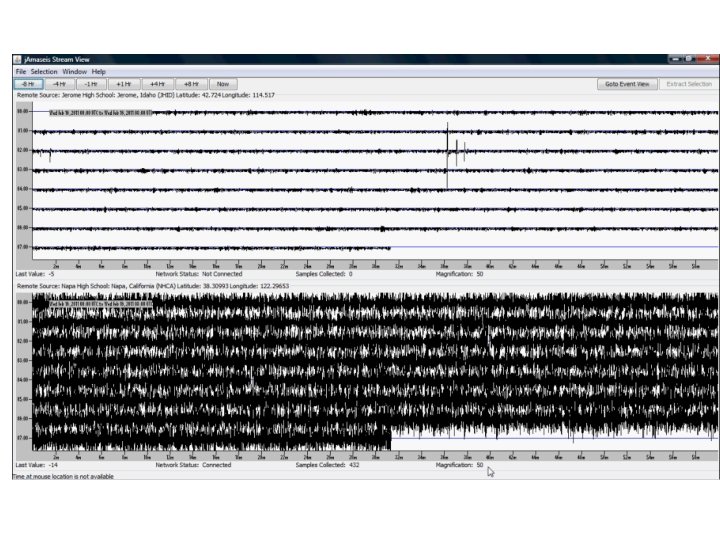
Viewing and Analysis Tools • Existing – SAC – Matlab – New • j. Amaseis – Under development by Moravian College • Seismic Canvas – Glenn Kroeger

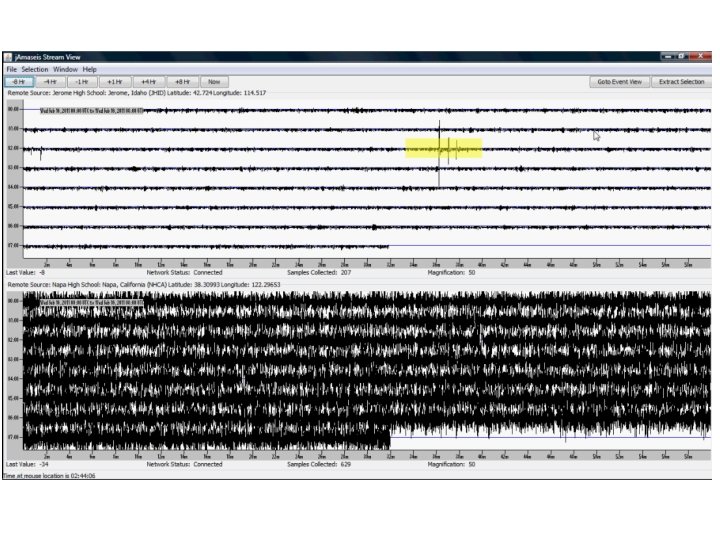
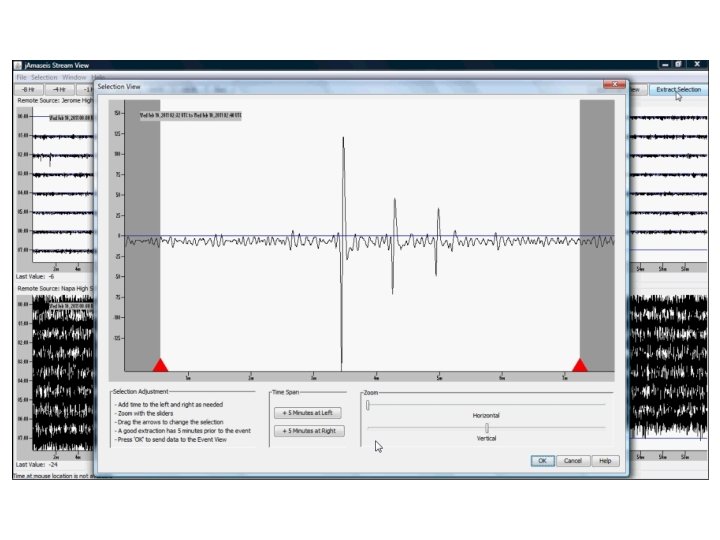
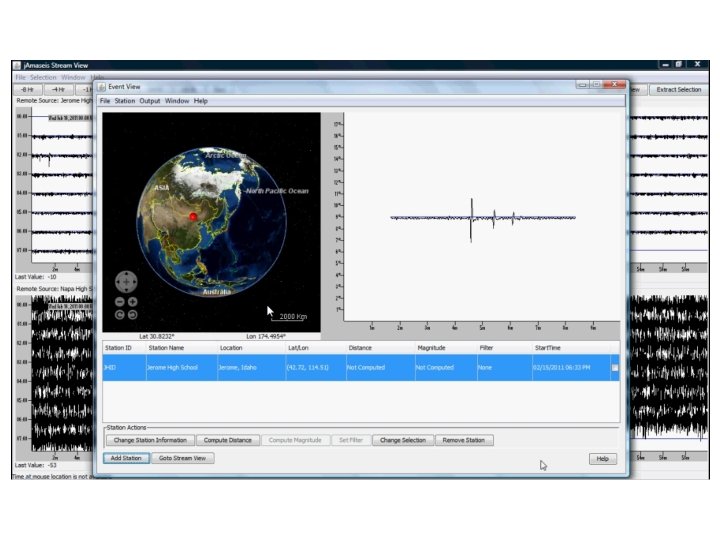
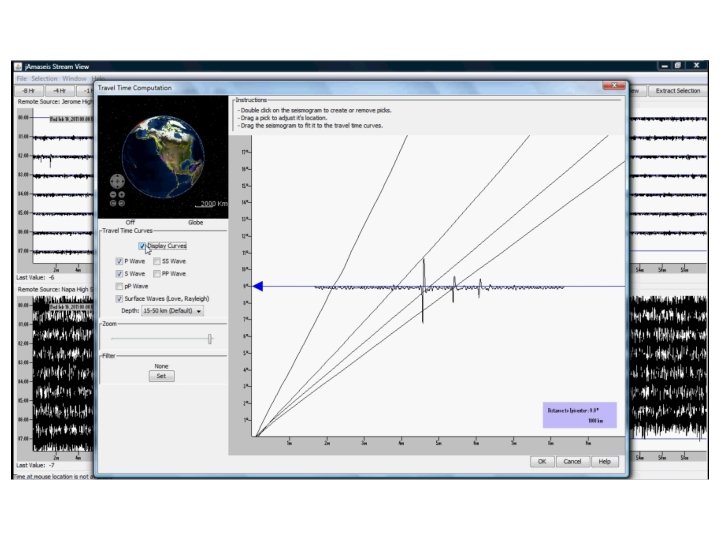
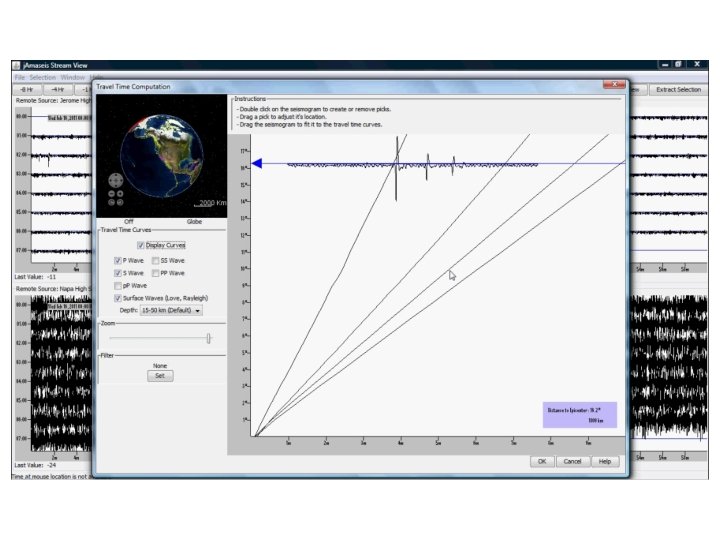
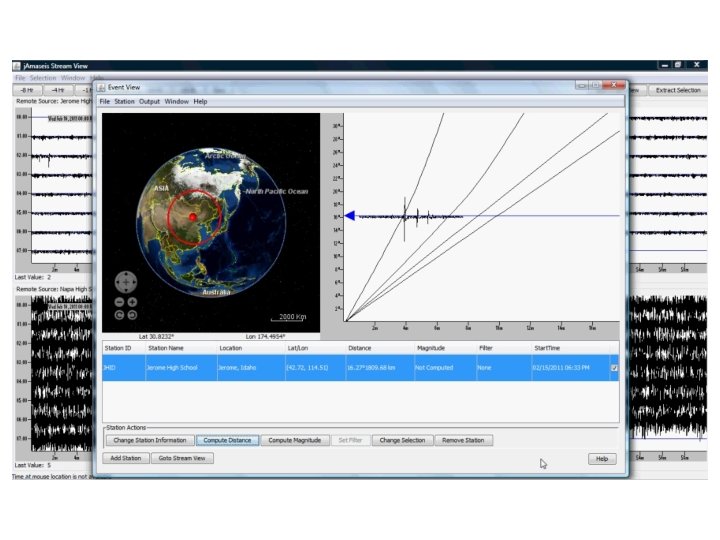
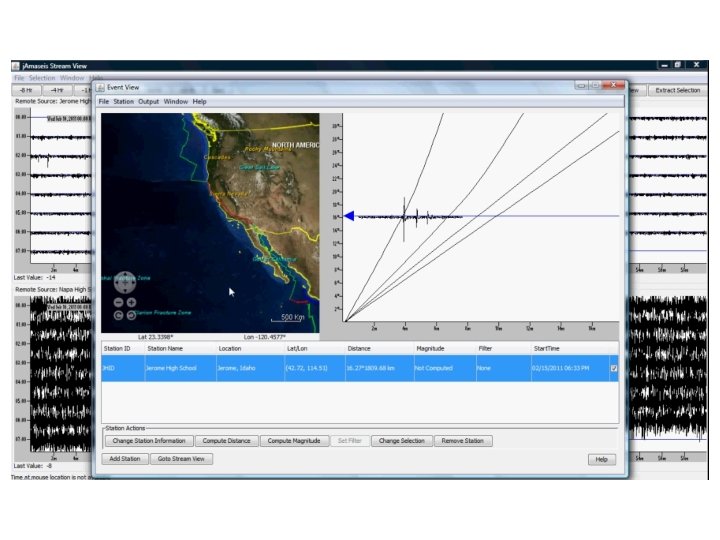
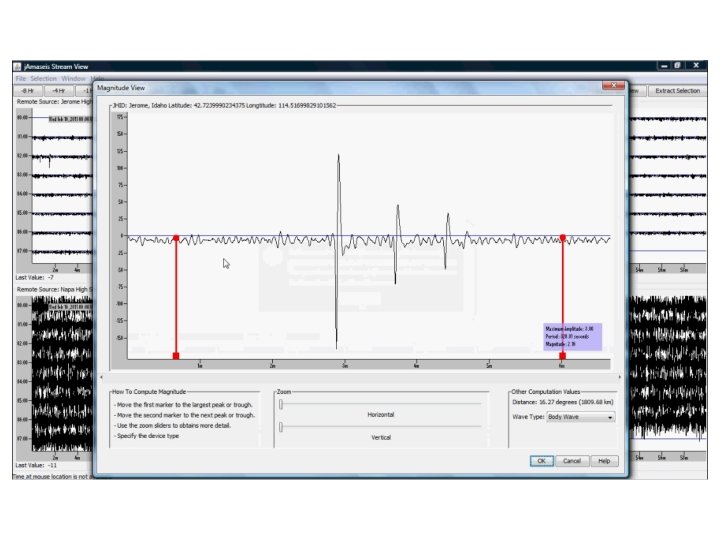
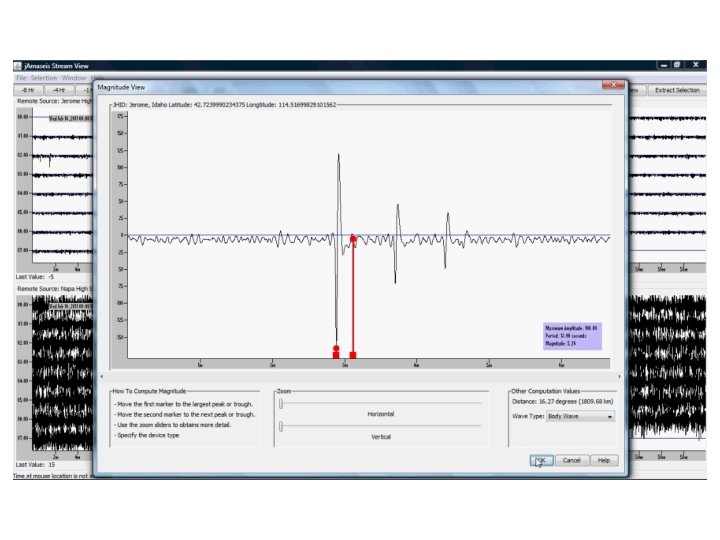
j. Amaseis


- Slides: 42