IRI Seasonal Climate Outlooks Climate Information TOOLBOX ENACTS

IRI Seasonal Climate Outlooks

Climate Information TOOLBOX • ENACTS: Enhancing National Climate Services • Timescales Map Room Explore relative importance of climate at different timescales • Seasonal Forecasts Flexible Forecast Format; Drought; Extremes • Stochastic Simulations (Near Term Climate Change) Explore possible decadal scale fluctuations, including all timescales • Verification (at all timescales) Demonstrating ability of tools to answer the questions we use them to answer • IRI Data Library Disseminate, analyze, display data • Research: – Subseasonal-to-seasonal climate: characterization & prediction – Decadal variability and prediction – Climate change processes and regional scale change
 • • • Financial Instruments Remote sensing and environmental monitoring Crop models")
… (continued) • • • Financial Instruments Remote sensing and environmental monitoring Crop models Climate & ecosystems research Climate Predictability Tool (CPT) seasonal prediction & downscaling • Full vision of IRI Data Library & Maprooms • Broader view of Decision Support Systems

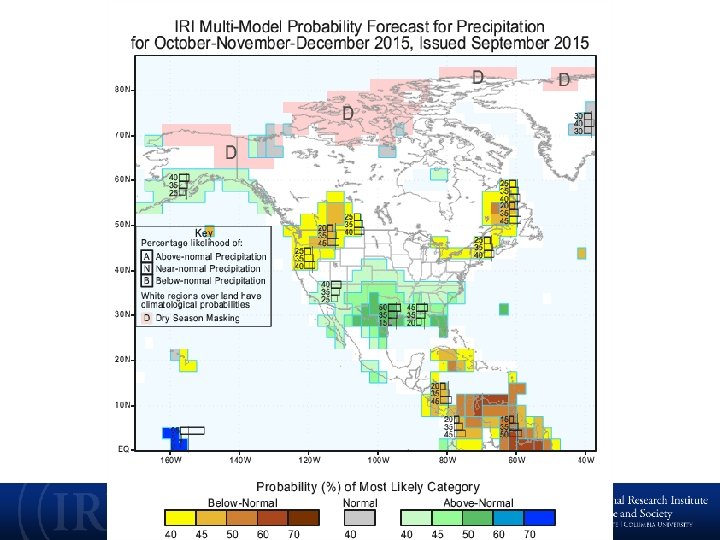
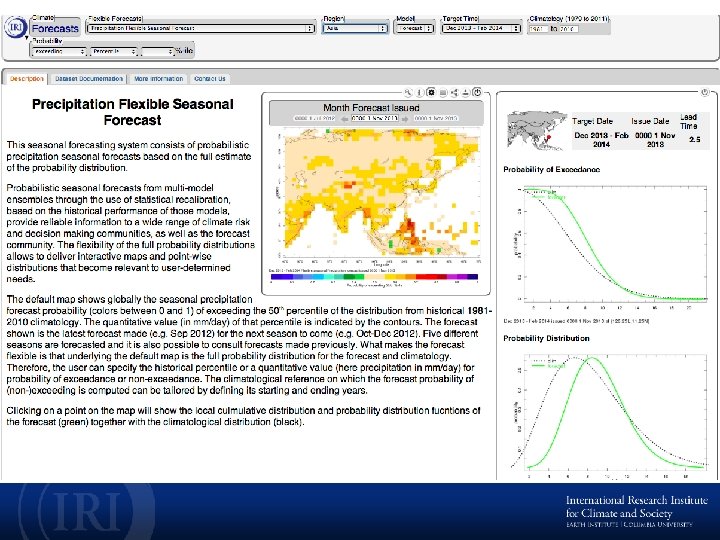
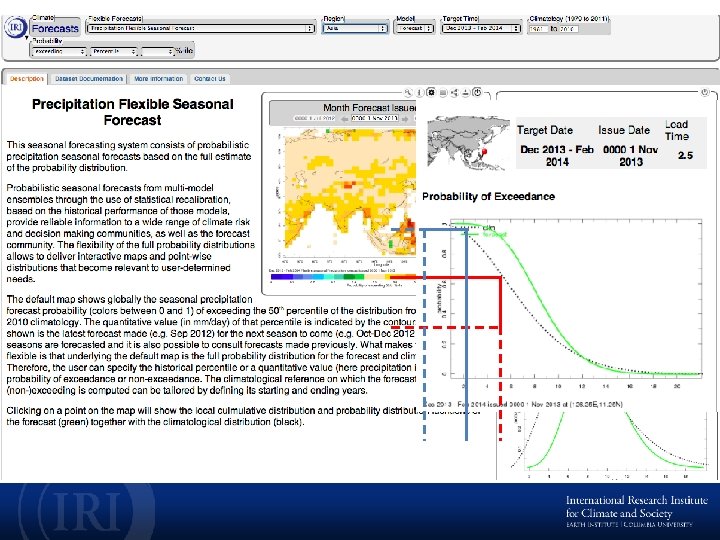
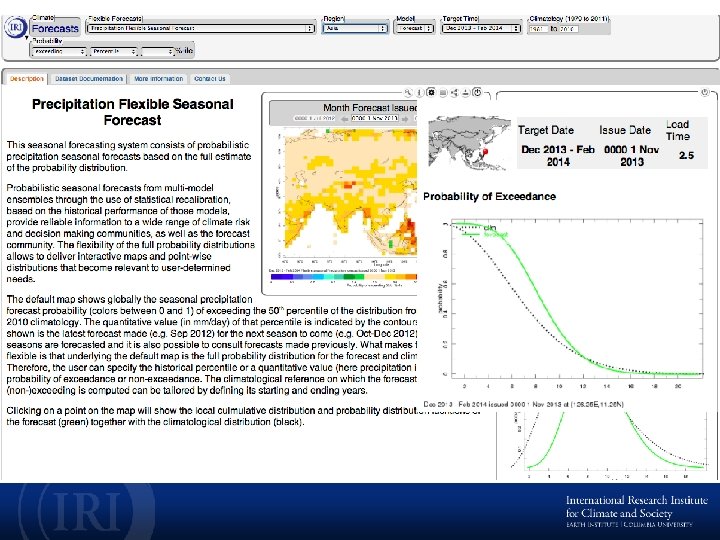
Information Products for Seasonal-to-Interannual Timescales • ENSO Outlooks • “Net Assessment” seasonal forecast • “Flexible format” seasonal forecast

Last week’s SST anomaly ------------------------------------------------------------------- http: //iridl. ldeo. columbia. edu/maproom/Global/Ocean_Temp/Weekly_Anomaly. html

NINO 3. 4 SST anomaly – Nov ’ 95 - Sep ‘ 97 NINO 3. 4 SST anomaly – Nov ’ 13 – Sep ‘

“Expected” Climate Impacts During El Niño http: //iridl. ldeo. columbia. edu/maproom/IFRC/ “Past Conditions”

Frequency of Climate Impacts due to El Niño ion g e r cts e f f a t Ts a S h t S e or ific c m a s i P l e a r c e i h p T t tro s u j than In the biggest 10 El Niño events since 1950, how often was it very wet? te a m i l al c In the biggest 10 El Niño events since 1950, how often was it very dry? http: //iridl. ldeo. columbia. edu/maproom/ ENSO/Climate_Impacts/ ENSO_PRCP_Prob_TS 2 p 1. html

Information Products for Seasonal-to-Interannual Timescales • ENSO Outlooks • “Net Assessment” seasonal forecast • “Flexible format” seasonal forecast

SEASONAL-TO-INTERANNUAL VARIABILITY “Reliable” forecasts are needed for threshold-based decisions

Information Products for Seasonal-to-Interannual Timescales • ENSO Outlooks • “Net Assessment” seasonal forecast • “Flexible format” seasonal forecast

Common format for Seasonal Climate Forecast • Regional • Categorical • Fixed

Information Products for Seasonal-to-Interannual Timescales • ENSO Outlooks • “Net Assessment” seasonal forecast • “Flexible format” seasonal forecast

OBSERVATIONS It all starts here…

DATA POVERTY
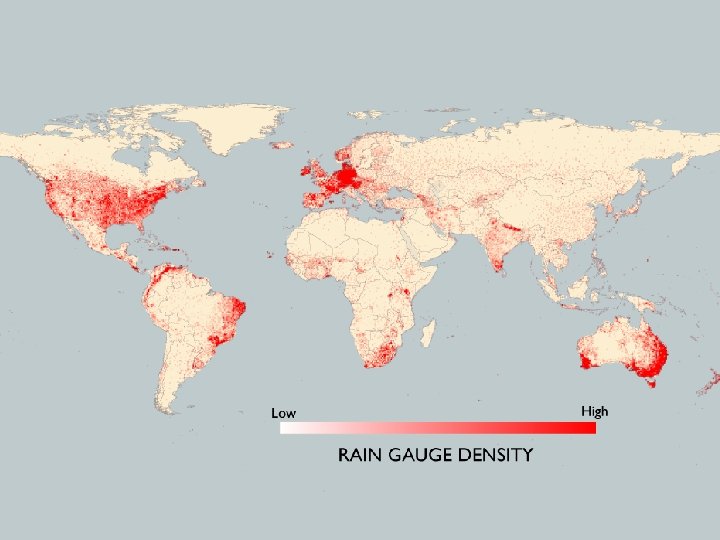

Rain Gauges Africa: 2, 967 Germany: 4, 133 Land Area Africa 11. 7 million sq. miles Germany 0. 14

ETHIOPIA – A MODEL

Rain Gauges

Rain Gauges Satellite Estimates

Rain Gauges Satellite Estimates Hybrid Data Sets

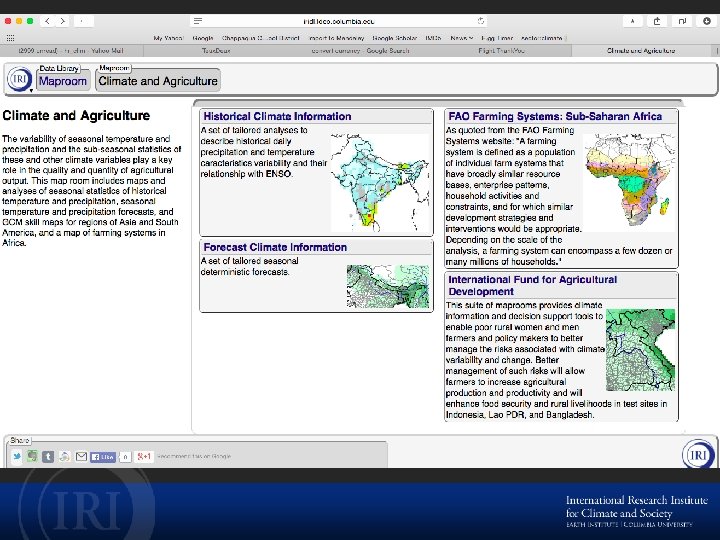
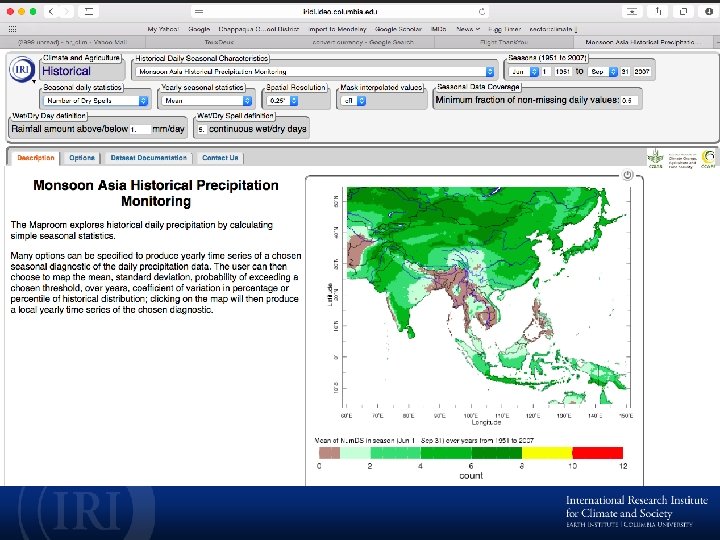
Ethiopia Climate Service: Information Delivery The online digital climate map-room of Ethiopia: www. ethiomet. gov. et
 In")
Five Pillars of IRAP Approach 2 UNDERSTAND/QUANTIFY/REDUCE UNCERTAINTIES Enhancing National Climate Services (ENACTS) In Ethiopia: Anti-Malaria Association

Dissemination of Information to Local Communities

![CLIMATE CHANGE [PROJECTIONS] What are we adapting to?](http://slidetodoc.com/presentation_image_h2/e36bacabe9df98d6f56407f0508cab2f/image-32.jpg "CLIMATE CHANGE [PROJECTIONS] What are we adapting to?")
CLIMATE CHANGE [PROJECTIONS] What are we adapting to?

Models may not get correct pattern of trend 20 th Century: Observed patterns of T & P trends agree better with models that have more realistic patterns of SST trends. (Shin and Sardeshmukh, 2010, Climate Dynamics)

Models may not get correct magnitude of trend Precipitation Changes over SE South America (Sep-Feb 1901 -2005) Observed Precipitation “trend” IPCC 20 th Century Simulations
 Observations (last")
Decadal-scale variability is important Climate Change Projections (end of 21 st century) Observations (last 15 years)

Climate Variability & Change Globally Annual Mean Temperature CC Hiatus? Temperature 65% Most of the variability in the globally-averaged temperature is contained in the slowly varying “climate change” component. 13% CC Acceleration? 21% (Greene, Goddard & Cousin, EOS, 2010)

Climate Variability & Change Locally Temperature Observations for Colorado, USA - DJF Precipitation 12% 1% 21% 19% 65% 75% All timescales matter

Precipitation Trends: % of total variance 20 th Century Observations -- Annual Means http: //iridl. ldeo. columbia. edu/maproom/Global/Time_Scales/

Precipitation Decadal Variability: % of variance 20 th Century Observations -- Annual Means http: //iridl. ldeo. columbia. edu/maproom/Global/Time_Scales/

Precipitation Decadal Variability: % of variance 20 th Century Observations -- Annual Means http: //iridl. ldeo. columbia. edu/maproom/Global/Time_Scales/

Regional Scale Decadal Predictions? Western Africa : Annual-Mean Temperature Southern Africa : Annual-Mean Temperature Climate Change Projections cannot deliver predictions of decadal variability

INTERANNUAL-to-DECADAL VARIABILITY Prediction / Projection Skill ? ?
")
Decadal Predictions: Skill still to be demonstrated Multi-model Ensemble (12 models: Equal Weighting ) Correlation Mean Squared Skill Score Annual T Jul-Aug-Sep P (based on Goddard et al. 2012, Climate Dynamics; See also http: //clivar-dpwg. iri. columbia. edu)

INTERANNUAL-to-DECADAL VARIABILITY Capturing characteristics/quantifying risk
")
STOCHASTIC SIMULATIONS: 2 Ensemble Members (Greene, et al. 2012)

STOCHASTIC SIMULATIONS: 2 Ensemble Members Decadal Variability
- Slides: 46