IPv 6 Performance revisited Geoff Huston APNIC Labs
 Geoff Huston APNIC Labs")
IPv 6 Performance (revisited) Geoff Huston APNIC Labs

What are we looking at: • How “reliable” are IPv 6 connections? • How “fast” are IPv 6 connections?

What are we looking at: • How “reliable” are IPv 6 connections? d? e e c c u s ts p m e tt a n o ti c e n Do all TCP con • How “fast” are IPv 6 connections? ? 4 V n a th r e w lo s 6 Is V

The Measurement Technique • Embed a script in an online ad • Have the script generate a set of URLs to fetch • Examine the packets seen at the server to determine reliability and RTT

How We Measure We use an online ad to present a sequence of small fetches to the user’s browser

How We Measure The sequence of tests is used to test a number of types of actions including fetches of IPv 6 and Dual stack

How We Measure We use tcpdump to record all packet activity at the experiment’s servers

How Much do We Measure?

What are we looking at: • How “reliable” are IPv 6 connections? d? e e c c u s ts p m e tt a n o ti c e n Do all TCP con • How “fast” are IPv 6 connections? ? 4 V n a th r e w lo s 6 Is V

What we see: Connection Failure Outbound SYN client server Busted SYN ACK Return path an s i s see hing r e v tc er a s m e o CK n t th t A a u g h W N, b ncomin Y S i ing m o c in

IPv 4 Connection Failure Missing PCAP data

IPv 4 Failures • IPv 4 failures are around 1 in 500 • And we are pretty sure its NOT: – Auto-tunnelling – Lousy CPE firmware – Strange firewall filters • So what is the reason for this residual asymmetric failure rate? • Is it asymmetric routing connectivity?

Daily IPv 6 Failures RIP Flash! HTML 5 + TLS + Mobile Devices

Daily IPv 6 Failures 6 to 4 is highly unreliable!

Daily IPv 6 Failures Unicast IPv 6 shows moderate reliability

IPv 6 Failures • 1. 5% failure for unicast V 6 is still unacceptable! • Why is this happening? – – Auto-tunnelling? Lousy CPE firmware? Strange firewall filters? Asymmetric routing

Is IPv 6 failure uniformly distributed?

Is IPv 6 failure uniformly distributed?

Failure by Country

Failure by Network

A cautionary note • These are “single shot” measurements rather than sustained repeated test, so there is some noise component here • Its also likely that connection failure is related to consumer equipment rather than network-level failure, as a network level failure would conventionally give a failure rate closer to 100% than ~10%

What are we looking at: • How “reliable” are IPv 6 connections? d? e e c c u s ts p m e tt a n o ti c e n Do all TCP con • How “fast” are IPv 6 connections? ? 4 V n a th r e w lo s 6 Is V

Let’s look at TCP SYNs 1 RTT interval

Why SYNs? • Every TCP session starts with a SYN handshake • Its typically a kernel level operation, which means that there is little in the way of application level interaction with the SYN exchange • On the downside there is only a single sample point per measurement

Generating a comparative RTT profile • For each successful connection couplet (IPv 4 and IPv 4) from the same endpoint, gather the pair of RTT measurements from the SYN-ACK exchanges • Use the server’s web logs to associate a couplet of IPv 4 and IPv 6 addresses • Use the packet dumps to collect RTT information from the SYN-ACK Exchange • Use IPv 6 RTT – IPv 4 RTT as the metric

An Example of Path Divergence $ traceroute from Singapore to Canberra, IPv 4 traceroute to 202. 158. xxxx. yyy, 30 hops max, 60 byte packets 1 103. 3. 60. 3 0. 672 ms 0. 796 ms 0. 899 ms 2 139. 162. 0. 9 0. 754 ms 0. 708 ms 0. 732 ms 3 te 0 -1 -0 -21. br 03. sin 02. pccwbtn. net 1. 697 ms 0. 760 ms 0. 726 ms 4 ntt. fe 3 -18. br 01. sin 02. pccwbtn. net 69. 526 ms 69. 644 ms 69. 754 ms 5 ae-10. r 20. sngpsi 05. sg. bb. gin. ntt. net 60. 702 ms 68. 474 ms 68. 469 ms 6 ae-8. r 22. snjsca 04. us. bb. gin. ntt. net 168. 447 ms 168. 532 ms 168. 138 ms 7 ae-19. r 01. snjsca 04. us. bb. gin. ntt. net 167. 489 ms 170. 665 ms 178. 832 ms 8 xe-0 -8 -0 -21. r 01. snjsca 04. us. ce. gin. ntt. net 330. 084 ms 323. 556 ms 329. 772 ms 9 xe-1 -0 -1. pe 1. msct. nsw. aarnet. au 330. 020 ms 323. 738 ms 334. 474 ms 10 et-3 -3 -0. pe 1. rsby. nsw. aarnet. au 327. 788 ms 334. 157 ms 328. 199 ms 11 138. 44. 161. 6 323. 644 ms 319. 455 ms 323. 563 ms 12 202. 158. xxx. yyy 319. 885 ms 333. 933 ms 325. 014 ms $ traceroute from Canberra to Singapore, IPv 4 traceroute to 139. 162. xxx. yyy, 64 hops max, 52 byte packets 1 202. 158. x. y 0. 682 ms 0. 388 ms 0. 313 ms 2 xe-5 -0 -4 -205. pe 1. actn. act. aarnet. a 0. 721 ms 0. 828 ms 0. 674 ms 3 et-0 -3 -0. pe 1. rsby. nsw. aarnet. au 4. 548 ms 4. 733 ms 4. 533 ms 4 et-7 -1 -0. pe 1. brwy. nsw. aarnet. au 4. 734 ms 5. 418 ms 4. 745 ms 5 et-0 -3 -0. pe 1. bkvl. nsw. aarnet. au 5. 117 ms 5. 512 ms 5. 524 ms 6 xe-0 -0 -0. bb 1. b. sea. aarnet. au 148. 017 ms 148. 019 ms 148. 131 ms 7 ge 3 -0. cr 02. sea 01. pccwbtn. net (206. 81. 80. 13) 148. 469 ms 148. 059 ms 148. 429 ms 8 tenge 0 -2 -0 -14. br 03. sin 02. pccwbtn. net 319. 435 ms 325. 053 ms 319. 117 ms 9 tenge 0 -2 -0 -15. br 03. sin 02. pccwbtn. net 319. 257 ms 332. 560 ms 323. 415 ms 10 linode. te 0 -1 -0 -21. br 03. sin 02. pccwbtn. net 323. 723 ms 323. 627 ms 323. 587 ms 11 139. 162. aaa. bbb 334. 609 ms 347. 243 ms 347. 220 ms 12 139. 162. xxx. yyy 325. 186 ms 338. 209 ms 325. 603 ms IPv 4

An Example of Path Divergence $ traceroute from Singapore to Canberra, IPv 6 traceroute 6 to 2001: 388: 1000: 110: e 4 d: e 9 ff: x: y, 30 hops max, 80 byte packets 1 2400: 8901: : 5287: 89 ff: fe 40: 9 fc 1 0. 897 ms 0. 912 ms 1. 051 ms 2 2400: 8901: 1111: : 1 0. 851 ms 0. 827 ms 0. 792 ms 3 2001: cb 0: 2102: 2: f: : 1 0. 364 ms 0. 333 ms 0. 516 ms 4 2001: cb 0: 2102: 2: f: : 1 0. 502 ms 0. 461 ms 0. 431 ms 5 2001: cb 0: 21 f 0: 1: 17: : 2 2. 512 ms 2. 176 ms 3. 445 ms 6 2001: cb 0: 21 f 0: 1: 17: : 2 2. 354 ms 2. 382 ms 1. 238 ms 7 10 gigabitethernet 3 -5. core 1. sin 1. he. net 1. 080 ms 1. 034 ms 1. 020 ms 8 10 ge 1 -5. core 1. tyo 1. he. net 88. 053 ms 10 ge 1 -16. core 1. hkg 1. he. net 39. 369 ms 10 ge 1 -5. core 1. tyo 1. he. net 88. 084 ms 9 10 ge 1 -5. core 1. tyo 1. he. net 88. 157 ms 100 ge 8 -1. core 1. sea 1. he. net 192. 408 ms 192. 642 ms 10 100 ge 8 -1. core 1. sea 1. he. net 192. 631 ms 192. 608 ms 196. 154 ms 11 xe-1 -0 -1. pe 2. brwy. nsw. aarnet. au 214. 176 ms 186. 238 ms 213. 061 ms 12 et-3 -1 -0. pe 1. brwy. nsw. aarnet. au 211. 298 ms 211. 300 ms 214. 200 ms 13 et-1 -1 -0. pe 1. rsby. nsw. aarnet. au 211. 492 ms 211. 359 ms 211. 427 ms 14 et-0 -3 -0. pe 1. actn. act. aarnet. au 213. 332 ms 211. 458 ms 211. 476 ms 15 2001: 388: 1000: 110: e 4 d: e 9 ff: x. y 213. 274 ms 213. 199 ms 213. 169 ms $ traceroute from Canberra to Singapore, IPv 6 traceroute 6 to 2400: 8901: : f 03 c: 91 ff: a: b) 64 hops max, 12 byte packets 1 2001: 388: 1000: 110: : x: y 0. 808 ms 0. 899 ms 1. 586 ms 2 xe-5 -0 -4 -205. pe 1. actn. act. aarnet. au 1. 633 ms 0. 646 ms 0. 578 ms 3 et-0 -1 -0. pe 1. dksn. act. aarnet. au 0. 682 ms 0. 649 ms 0. 694 ms 4 et-5 -3 -0. pe 1. crlt. vic. aarnet. au 8. 072 ms 8. 086 ms 8. 049 ms 5 et-5 -1 -0. pe 1. wmlb. vic. aarnet. au 8. 116 ms 8. 055 ms 8. 073 ms 6 et-0 -3 -0. pe 1. adel. sa. aarnet. au 17. 790 ms 16. 984 ms 17. 036 ms 7 et-1 -1 -0. pe 1. prka. sa. aarnet. au 17. 080 ms 17. 152 ms et-0 -3 -0. pe 1. eper. wa. aarnet. au 43. 319 ms 8 et-0 -3 -0. pe 1. knsg. wa. aarnet. au 43. 357 ms 43. 443 ms 43. 353 ms 9 gigabitethernet-5 -1 -0. bb 1. b. per. aarnet. au 43. 849 ms 43. 919 ms 43. 850 ms 10 so-0 -0 -0. bb 1. a. sin. aarnet. au 92. 219 ms 92. 275 ms 92. 189 ms 11 as 6939. singapore. megaport. com 212. 347 ms 212. 426 ms 212. 471 ms 12 * * * 13 2400: 8901: 1110: : 2 213. 924 ms 213. 904 ms 213. 717 ms 14 2400: 8901: : f 03 c: 91 ff: a: b 213. 954 ms 213. 393 ms 213. 726 ms IPv 4 – IPv 6

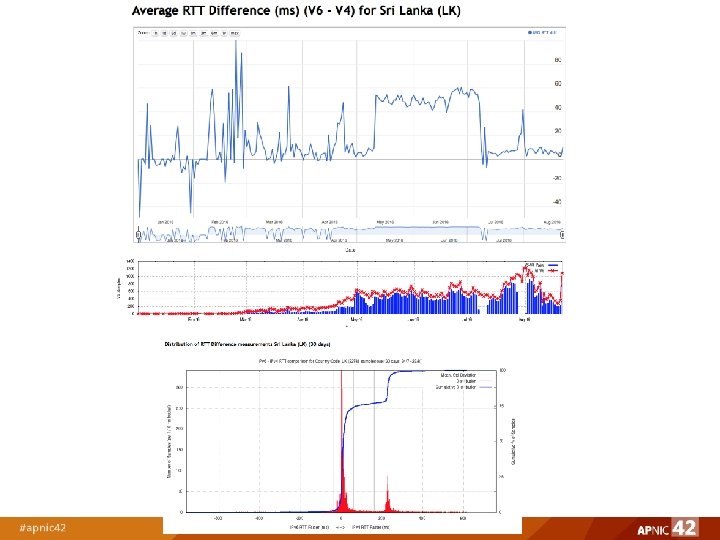
Global Results On average IPv 6 is showing 10 – 20 ms slower that IPv 4

Global Results Mean Standard Deviation per day of these measurements Number of sample points per day
 IPv 4 Faster (ms)")
Distribution 60 day average IPv 6 Faster (ms) IPv 4 Faster (ms)

Performance by Country

Performance by Network
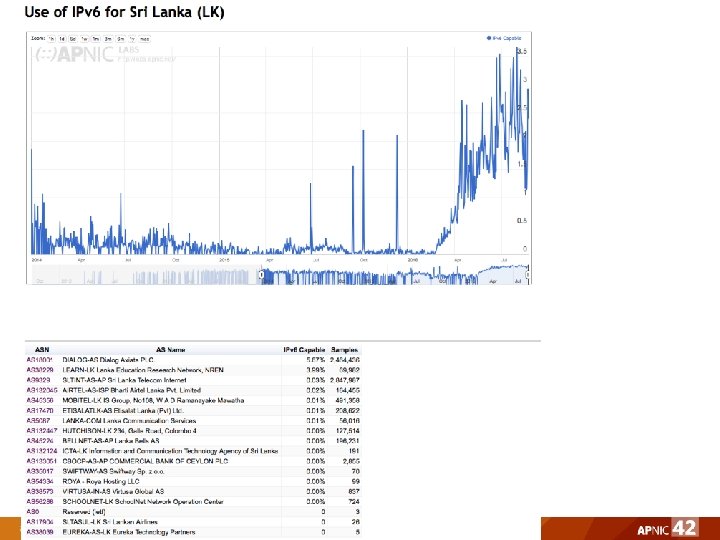

IPv 6 Providers in Sri Lanka

The United States

The United States

AT&T - AS 7018

Is IPv 6 as “good” as IPv 4?

Is IPv 6 as “good” as IPv 4? Is IPv 6 as fast as IPv 4? Basically, yes IPv 6 is faster about half of the time For 75% of unicast cases, IPv 6 is within 10 ms RTT of IPv 4 So they perform at much the same rate (But that’s just for unicast IPv 6 - the use of 6 to 4 makes this a whole lot worse!)

Is IPv 6 as “good” as IPv 4? Is IPv 6 as robust as IPv 4? IPv 4 connection reliability currently sits at 0. 2% The base failure rate of Unicast V 6 connection attempts at 1. 5% of the total V 6 unicast connections is not brilliant. (6 to 4 is terribleat this!) It could be better. It could be a whole lot better!

Is IPv 6 as “good” as IPv 4? If you can establish a connection, then IPv 4 and IPv 6 appear to have comparable RTT measurements across most of the Internet But the odds of establishing that connection are still weighted in favour of IPv 4!

That’s it! http: //stats. labs. apnic. net/v 6 perf
- Slides: 43


