
IP Quality Monitor NetProbe LLC e Mail infonetprobe

IP Quality Monitor Net-Probe LLC e. Mail: info@net-probe. ru Web: http: //www. net-probe. ru Maxim Krayushin +7 919 968 6404 e. Mail: m. krayushin@net-probe. ru Last edit: 2018 -11 -14
Purpose of IQM: IP Quality Monitor Soft and hard are developing in Russia Measurement, monitoring and management of network quality parameters and network performance Monitoring on different levels of OSI model: from L 2 (data channel layer) – up to L 7 (application layer) Active measurement Receiving data from external sources: SNMP Programmable methods: HTTP, CLI, etc.
The functional composition Quality measurement agents (IQMA) Test sessions Measurements Data receiving Management system (IQMM) Management of IQM subsystems Configuration and agent’s status monitoring Data processing Alarming Data presentation Personal account Administration
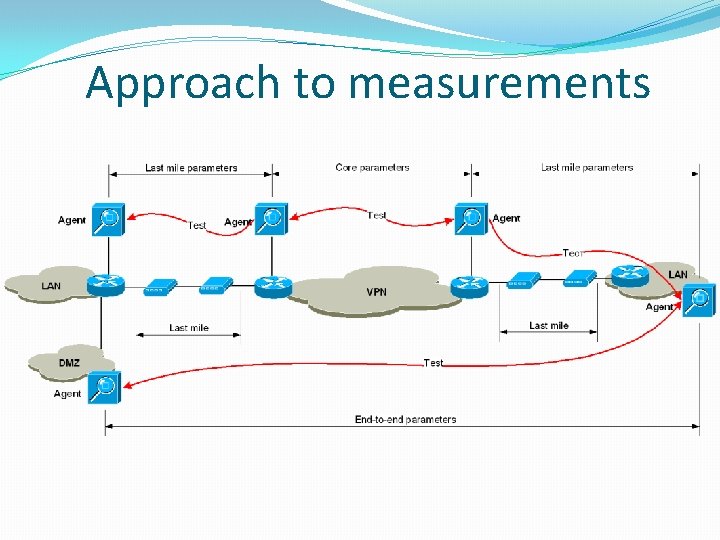
Approach to measurements
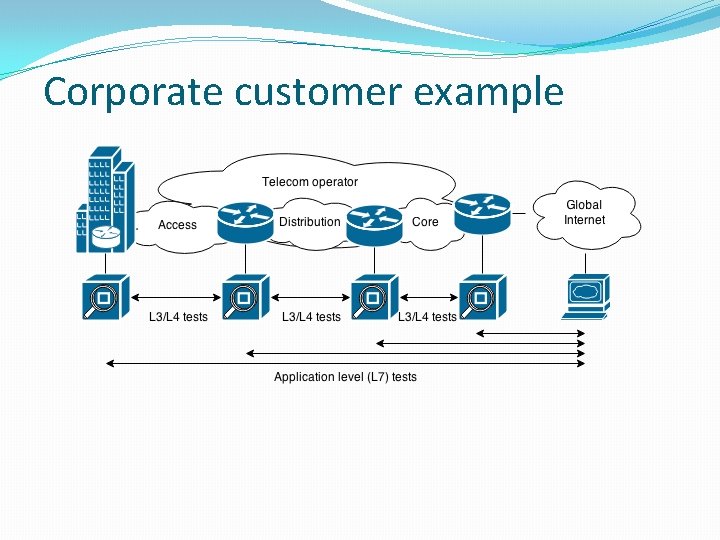
Corporate customer example
Parameters measured on OSI L 3/4 are: Packet loss (%, pieces), Round-trip times (Min/Avg/Max), One-way delays (Min/Avg/Max), Packet delay variation (Jitter), Rate (Speed) (%, bps), Volume of data received, Percentage of reclassified packages, Out of Order Classes of service are: IP Precedence (IP TOS) DSCP (IP TOS)
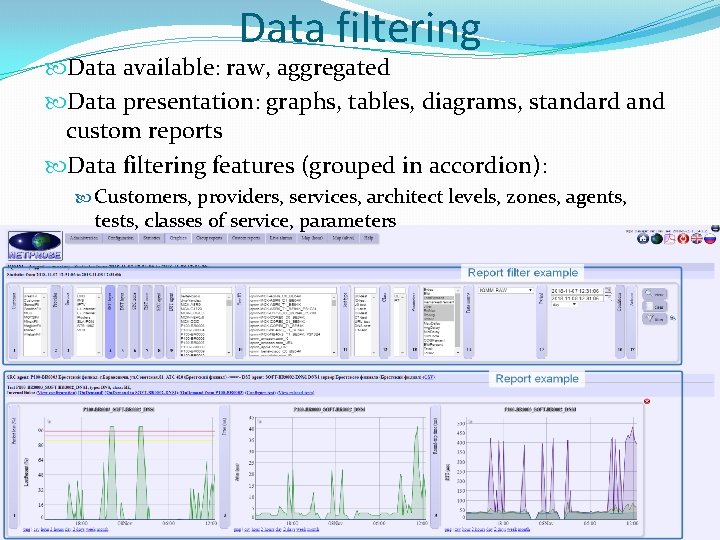
Data filtering Data available: raw, aggregated Data presentation: graphs, tables, diagrams, standard and custom reports Data filtering features (grouped in accordion): Customers, providers, services, architect levels, zones, agents, tests, classes of service, parameters
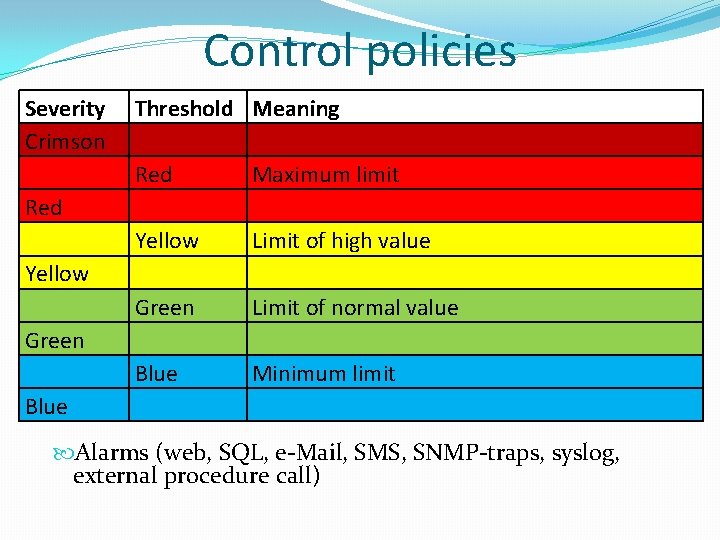
Control policies Severity Crimson Threshold Meaning Red Maximum limit Yellow Limit of high value Green Limit of normal value Blue Minimum limit Red Yellow Green Blue Alarms (web, SQL, e-Mail, SMS, SNMP-traps, syslog, external procedure call)
Support Juniper RPM Cisco IP SLA Accedian Networks: Ether. NID, Metro. NID Rad Mi. NID TWAMP-aware devices (RFC 5357) UDP/ICMP-echo Programmable tests opportunity: Cisco/Juniper SNMP ping Cisco/Juniper CLI ping etc…
Application Layer services Built-in tests: FTP, HTTP, IMAP, RTSP, SMTP, TFTP, DNS, + SSL URL-based authorization TCP speeding up HTTP: cookies, HTTP redirect, HTTP persistent connection (HTTP keep-alive) Programmable test-type allows to develop any kind of application and arbitrary scenario of testing
Bandwidth On-demand tests, night-time tests Available bandwidth: Stress tests with full channel load Stress tests with partial channel load Intelligent tests with iteration Used bandwidth: Stress tests with full channel load Stress tests with partial channel load Intelligent tests with iteration SNMP poling: channel utilization, interface errors etc.
IPTV monitoring of MDI+ Task: quality monitoring for IPTV services Solution: special module Mreceiver Automated IQM-initiated Standalone command-line utility Flow: multicast MPEG-TS over UDP Parameters: Delay Factor, DF (ms) (RFC 4445) Media Loss Rate, MLR (pps) (RFC 4445) Media Loss Packets, MLP (p) Media Loss Bytes, MLB (B) Media Loss Time, MLT (ms) Bitrate (bps) Num. Packets. TS (p) Join Time (ms) Inter-packet Arrival Time, IAT (ms)
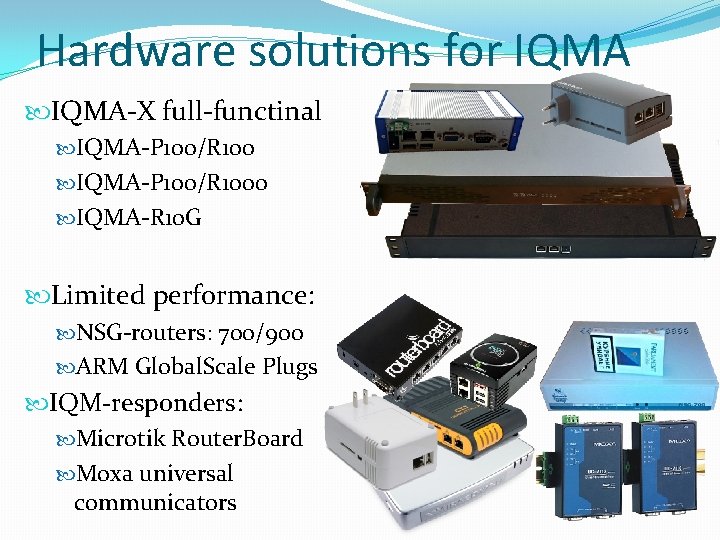
Hardware solutions for IQMA-X full-functinal IQMA-P 100/R 1000 IQMA-R 10 G Limited performance: NSG-routers: 700/900 ARM Global. Scale Plugs IQM-responders: Microtik Router. Board Moxa universal communicators
Ability for integration Notification level. standard protocols: syslog, SNMP, e-Mail, external procedure call, HTTP, SQL… Presentation level. Java. Script library for interface elements embedding. Management level. IQM-driver – REST-HTTP/CLI interface. Available response formats are: text, CSV, HTML, JSON.
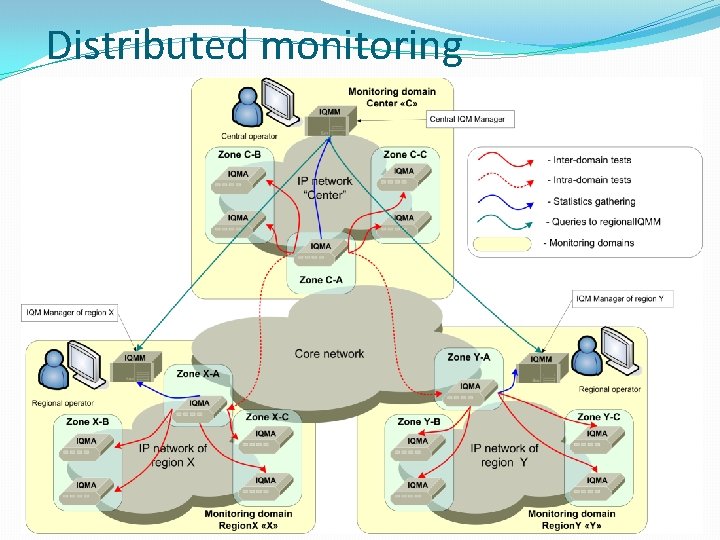
Distributed monitoring

Screen forms. . .
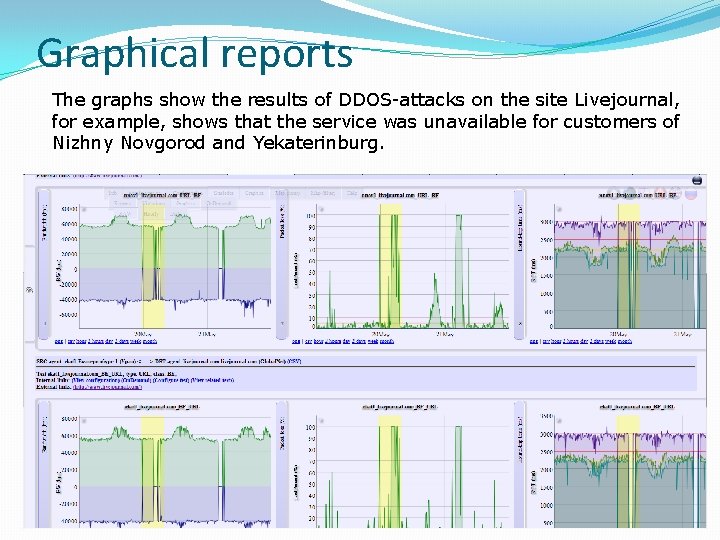
Graphical reports The graphs show the results of DDOS-attacks on the site Livejournal, for example, shows that the service was unavailable for customers of Nizhny Novgorod and Yekaterinburg.
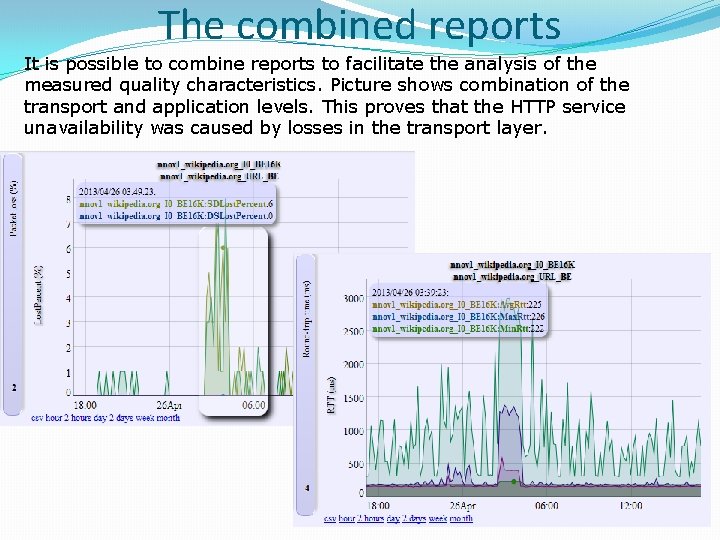
The combined reports It is possible to combine reports to facilitate the analysis of the measured quality characteristics. Picture shows combination of the transport and application levels. This proves that the HTTP service unavailability was caused by losses in the transport layer.
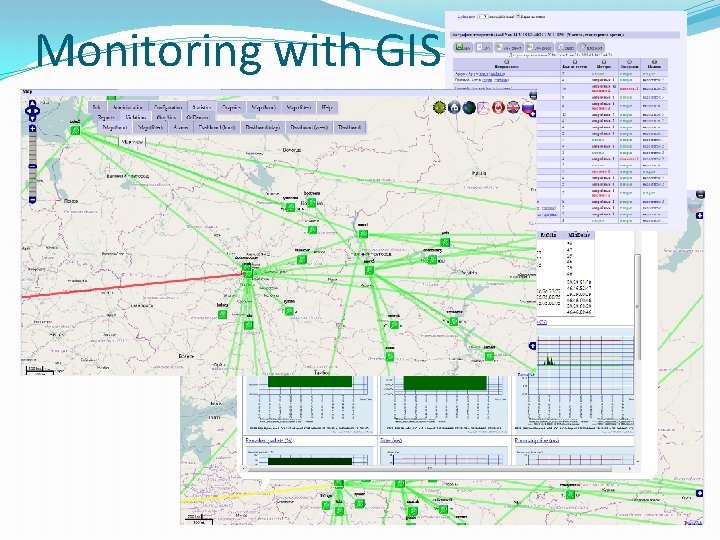
Monitoring with GIS
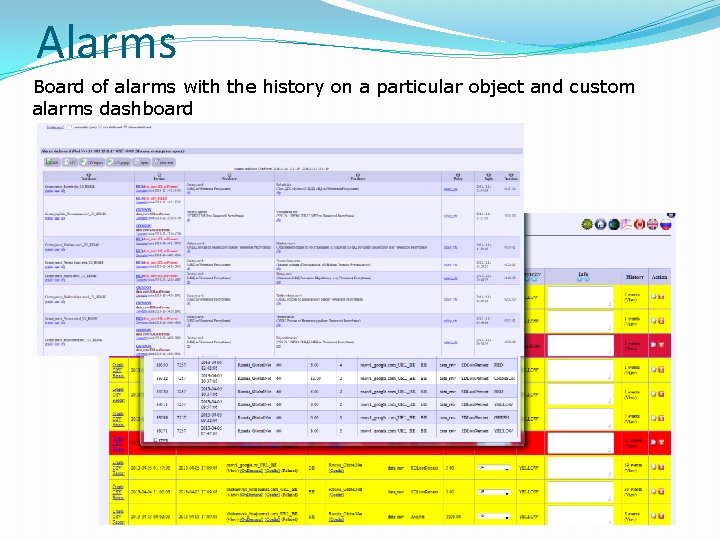
Alarms Board of alarms with the history on a particular object and custom alarms dashboard
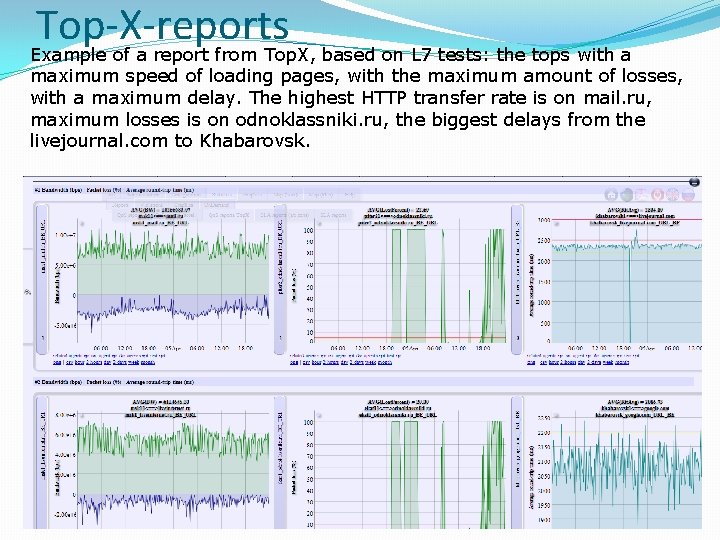
Top-X-reports Example of a report from Top. X, based on L 7 tests: the tops with a maximum speed of loading pages, with the maximum amount of losses, with a maximum delay. The highest HTTP transfer rate is on mail. ru, maximum losses is on odnoklassniki. ru, the biggest delays from the livejournal. com to Khabarovsk.
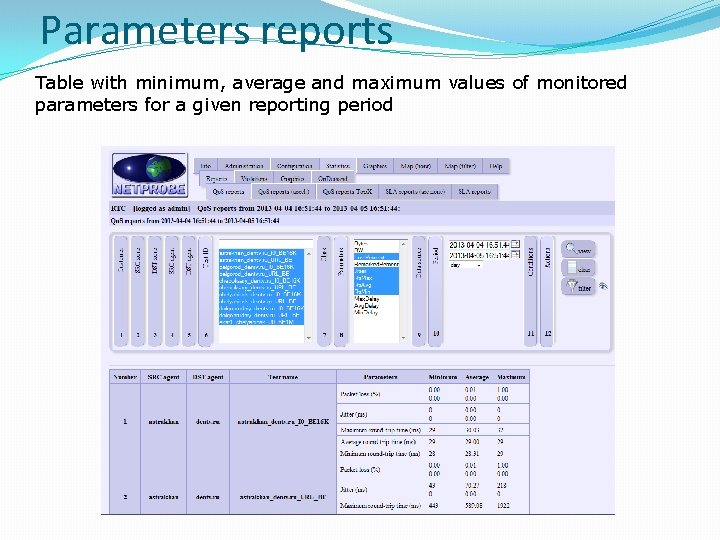
Parameters reports Table with minimum, average and maximum values of monitored parameters for a given reporting period
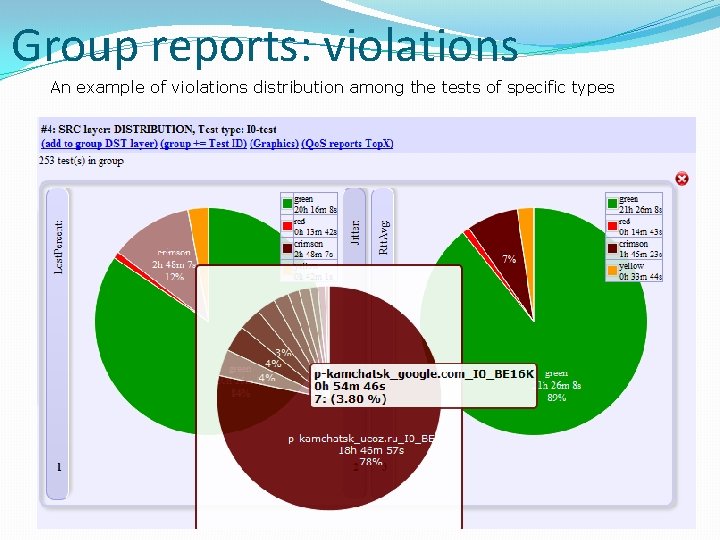
Group reports: violations An example of violations distribution among the tests of specific types
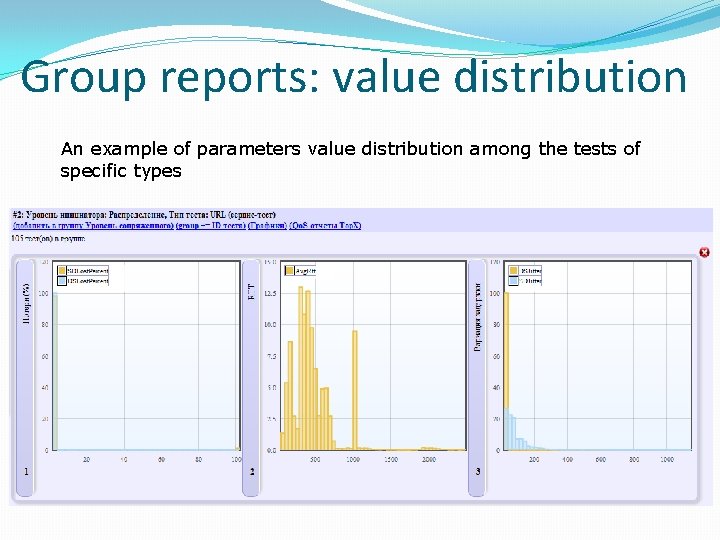
Group reports: value distribution An example of parameters value distribution among the tests of specific types
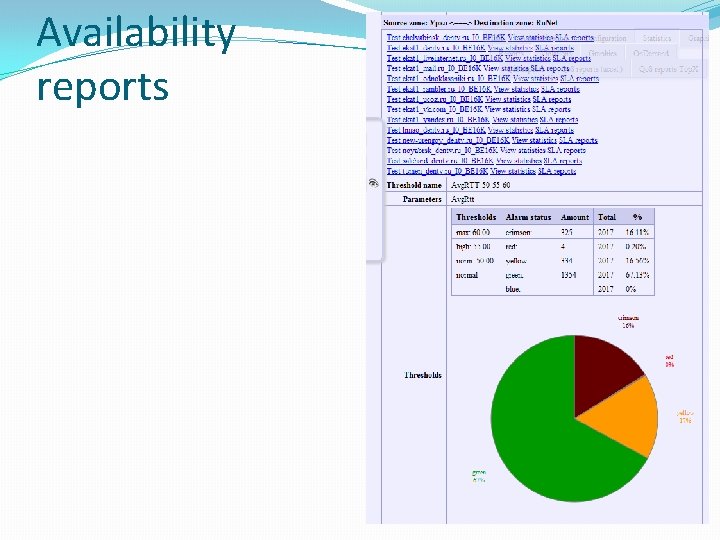
Availability reports

Contact us… LLC Net. Probe Phone: +7 (916) 372 4400, +7 (919) 968 6404 e-Mail: info@net-probe. ru Address: 123557, Moscow, Presnensky Val Street, house 27, structure 11, room 402 e. Mail: info@net-probe. ru Web: http: //www. net-probe. ru Maxim Krayushin +7 919 968 6404 e. Mail: m. krayushin@net-probe. ru
- Slides: 27