
Investor Education Series Lesson 11 Why Learning from







- Slides: 56
Investor Education Series Lesson 11 Why Learning from Your Mistakes is Vital The comments expressed here are based upon study and interpretation of available data as it relates to our historical models of the best-performing stocks. This is not a prospectus; no effort on our part with respect to sale or purchase of any securities is intended or implied. Any chart appearing in this material is for educational purposes and is not, and should not be construed as a recommendation or rating to buy or sell any security. It is possible that at this date or some subsequent date, the officers, directors and/or shareholders of Investor’s Business Daily, Inc. or their affiliates own securities or buy or sell securities listed in the following pages, or those not mentioned. © 2011 Investor’s Business Daily. All rights reserved. Investor’s Business Daily, IBD, CAN SLIM and corresponding logos are registered trademarks owned by Investor’s Business Daily, Inc. 1 © 2011 Investor’s Business Daily. All rights reserved.
• Improve Your Results by Improving Your Records Tracking Your Buys Tracking Your Sells • How to Do a Profitable Post-Analysis 5 Questions to Ask What You Must Fix - The most serious mistake you can make - Other common errors 2 © 2011 Investor’s Business Daily. All rights reserved.
“ It’s what you learn after you know it all that counts. - John Wooden, Legendary Basketball Coach ” 3 © 2011 Investor’s Business Daily. All rights reserved.
All investors make mistakes. Successful investors learn from them. Learn from your mistakes by doing a regular post-analysis of all your trades. The “One That Got Away” Pay special attention to any stocks that made huge gains AFTER you sold them. (See slide 27) 4 © 2011 Investor’s Business Daily. All rights reserved.
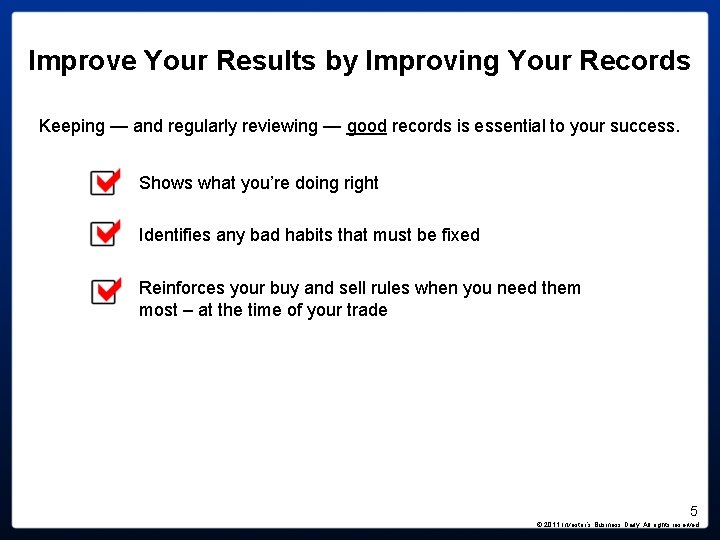
Improve Your Results by Improving Your Records Keeping — and regularly reviewing — good records is essential to your success. Shows what you’re doing right Identifies any bad habits that must be fixed Reinforces your buy and sell rules when you need them most – at the time of your trade 5 © 2011 Investor’s Business Daily. All rights reserved.
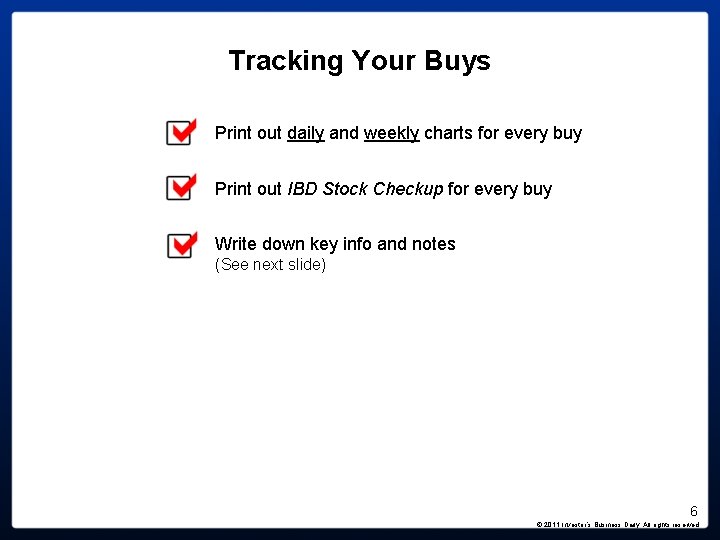
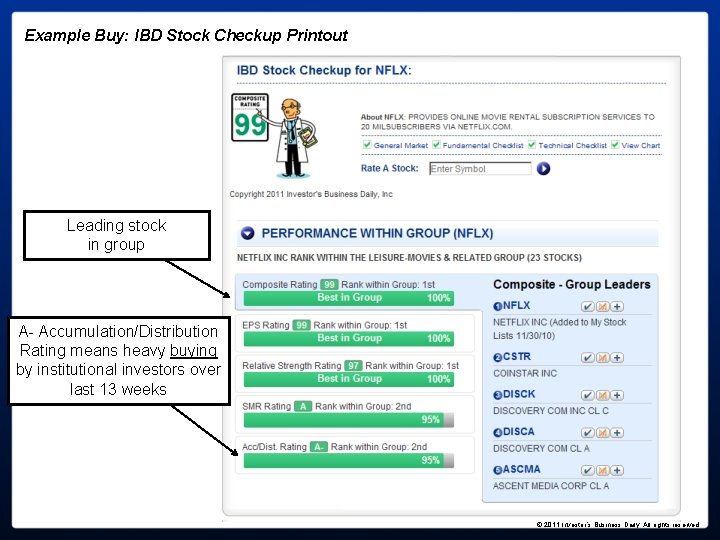
Tracking Your Buys Print out daily and weekly charts for every buy Print out IBD Stock Checkup for every buy Write down key info and notes (See next slide) 6 © 2011 Investor’s Business Daily. All rights reserved.
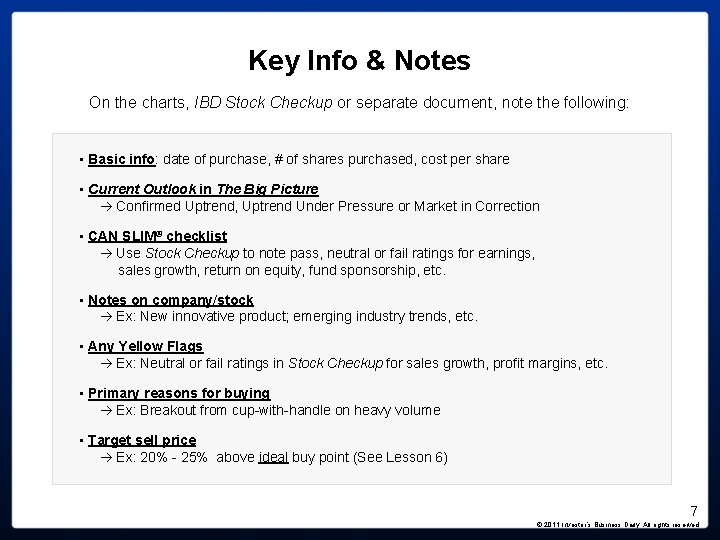
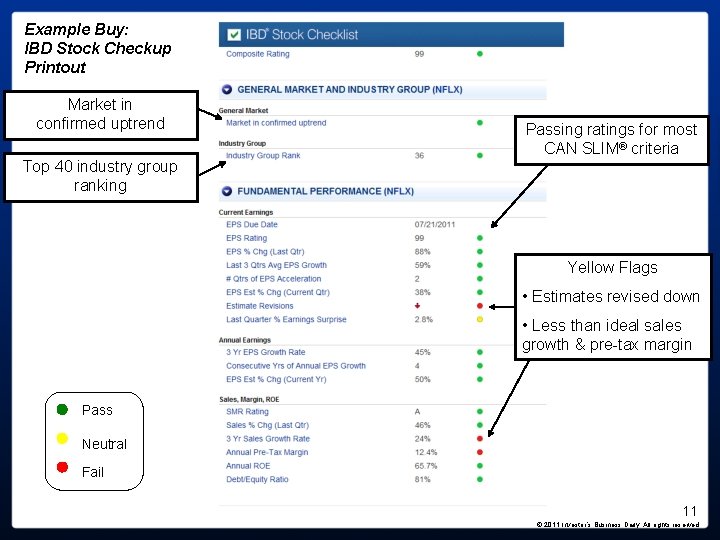
Key Info & Notes On the charts, IBD Stock Checkup or separate document, note the following: • Basic info: date of purchase, # of shares purchased, cost per share • Current Outlook in The Big Picture Confirmed Uptrend, Uptrend Under Pressure or Market in Correction • CAN SLIM® checklist Use Stock Checkup to note pass, neutral or fail ratings for earnings, sales growth, return on equity, fund sponsorship, etc. • Notes on company/stock Ex: New innovative product; emerging industry trends, etc. • Any Yellow Flags Ex: Neutral or fail ratings in Stock Checkup for sales growth, profit margins, etc. • Primary reasons for buying Ex: Breakout from cup-with-handle on heavy volume • Target sell price Ex: 20% - 25% above ideal buy point (See Lesson 6) 7 © 2011 Investor’s Business Daily. All rights reserved.
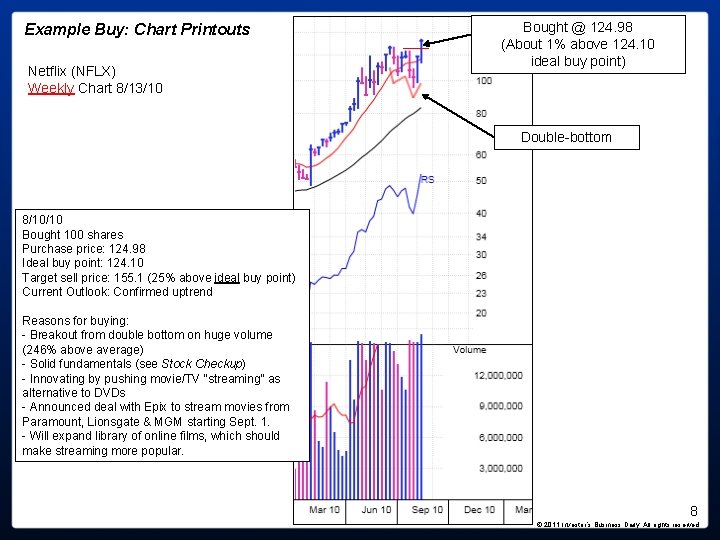
Example Buy: Chart Printouts Netflix (NFLX) Weekly Chart 8/13/10 Bought @ 124. 98 (About 1% above 124. 10 ideal buy point) Double-bottom 8/10/10 Bought 100 shares Purchase price: 124. 98 Ideal buy point: 124. 10 Target sell price: 155. 1 (25% above ideal buy point) Current Outlook: Confirmed uptrend Reasons for buying: - Breakout from double bottom on huge volume (246% above average) - Solid fundamentals (see Stock Checkup) - Innovating by pushing movie/TV “streaming” as alternative to DVDs - Announced deal with Epix to stream movies from Paramount, Lionsgate & MGM starting Sept. 1. - Will expand library of online films, which should make streaming more popular. 8 © 2011 Investor’s Business Daily. All rights reserved.
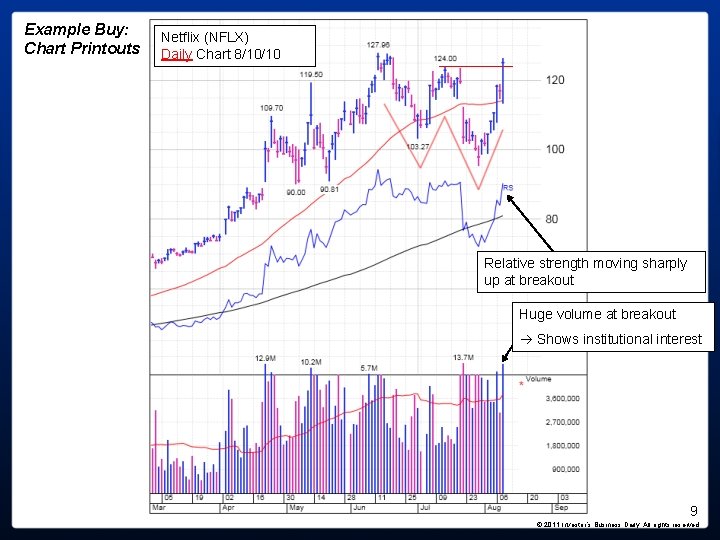
Example Buy: Chart Printouts Netflix (NFLX) Daily Chart 8/10/10 Relative strength moving sharply up at breakout Huge volume at breakout Shows institutional interest 9 © 2011 Investor’s Business Daily. All rights reserved.
Example Buy: IBD Stock Checkup Printout Leading stock in group A- Accumulation/Distribution Rating means heavy buying by institutional investors over last 13 weeks © 2011 Investor’s Business Daily. All rights reserved.
Example Buy: IBD Stock Checkup Printout Market in confirmed uptrend Top 40 industry group ranking Passing ratings for most CAN SLIM® criteria Yellow Flags • Estimates revised down • Less than ideal sales growth & pre-tax margin i i i Pass Neutral Fail 11 © 2011 Investor’s Business Daily. All rights reserved.
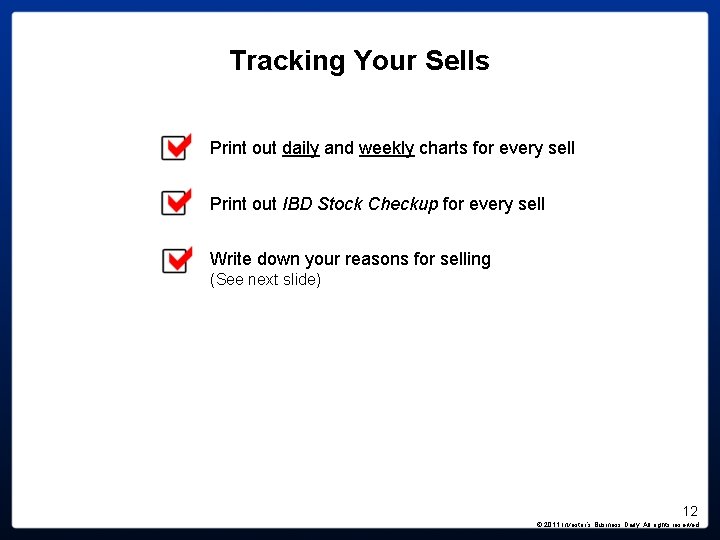
Tracking Your Sells Print out daily and weekly charts for every sell Print out IBD Stock Checkup for every sell Write down your reasons for selling (See next slide) 12 © 2011 Investor’s Business Daily. All rights reserved.
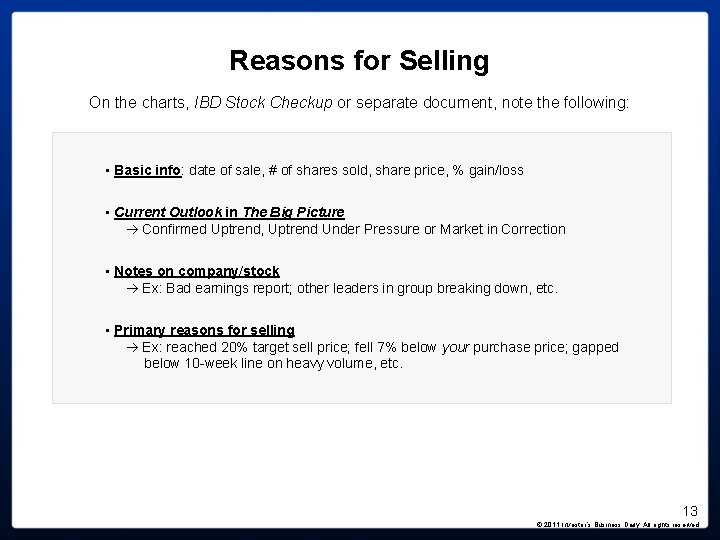
Reasons for Selling On the charts, IBD Stock Checkup or separate document, note the following: • Basic info: date of sale, # of shares sold, share price, % gain/loss • Current Outlook in The Big Picture Confirmed Uptrend, Uptrend Under Pressure or Market in Correction • Notes on company/stock Ex: Bad earnings report; other leaders in group breaking down, etc. • Primary reasons for selling Ex: reached 20% target sell price; fell 7% below your purchase price; gapped below 10 -week line on heavy volume, etc. 13 © 2011 Investor’s Business Daily. All rights reserved.
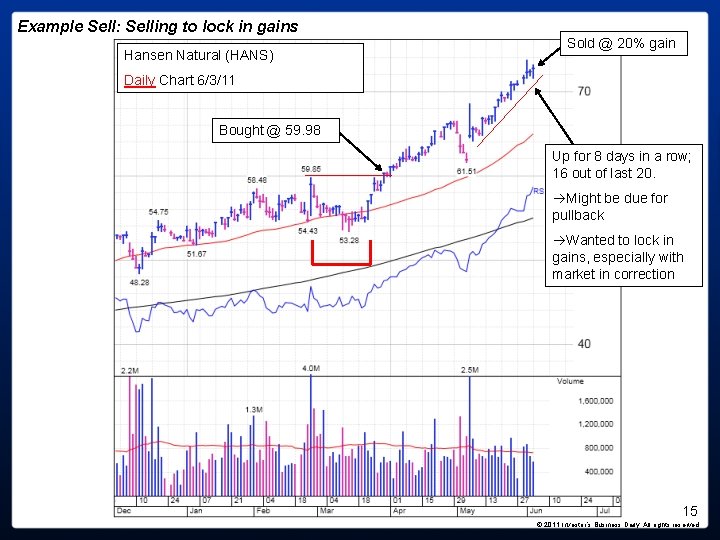
Example Sell: Selling to lock in gains Hansen Natural (HANS) Weekly Chart 6/3/11 Bought @ 59. 98 Sold on way up to lock in gains 6/3/11 Sold 225 shares Sell price: 71. 97 Purchase price: 59. 98 Gain/Loss: 20% Current Outlook: Market in correction Reasons for selling: - Hit target gain of 20% - With market in correction, wanted to protect gains - Other leaders in group dropping below 10 -week line 14 © 2011 Investor’s Business Daily. All rights reserved.
Example Sell: Selling to lock in gains Hansen Natural (HANS) Sold @ 20% gain Daily Chart 6/3/11 Bought @ 59. 98 Up for 8 days in a row; 16 out of last 20. Might be due for pullback Wanted to lock in gains, especially with market in correction 15 © 2011 Investor’s Business Daily. All rights reserved.
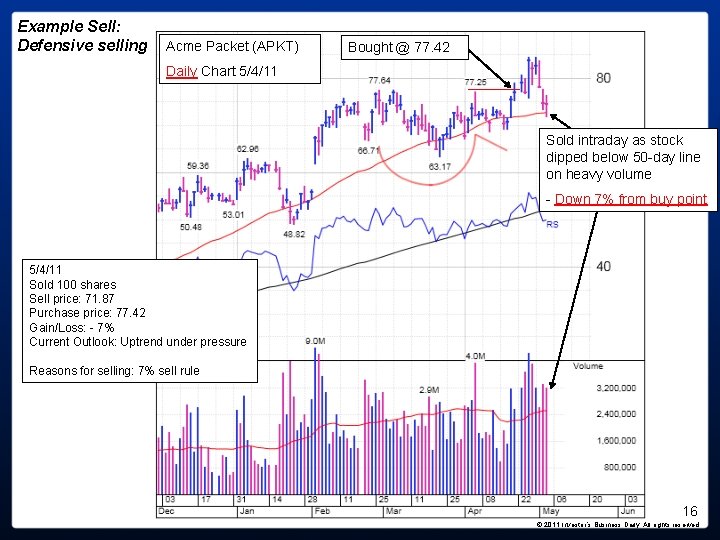
Example Sell: Defensive selling Acme Packet (APKT) Bought @ 77. 42 Daily Chart 5/4/11 Sold intraday as stock dipped below 50 -day line on heavy volume - Down 7% from buy point 5/4/11 Sold 100 shares Sell price: 71. 87 Purchase price: 77. 42 Gain/Loss: - 7% Current Outlook: Uptrend under pressure Reasons for selling: 7% sell rule 16 © 2011 Investor’s Business Daily. All rights reserved.
Your Discipline Pays Off Writing down your reasons for every buy and sell will force you to think through each trade before you make it. Makes it much easier to do an effective and thorough post-analysis. 17 © 2011 Investor’s Business Daily. All rights reserved.
How to Do a Profitable Post-Analysis Review your biggest winners and losers at least once a year 18 © 2011 Investor’s Business Daily. All rights reserved.
5 Questions to Ask as You Review Your Trades 19 © 2011 Investor’s Business Daily. All rights reserved.
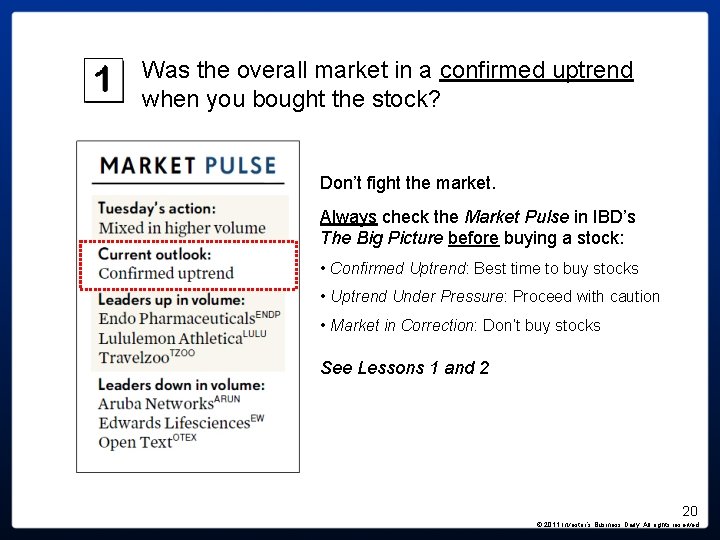
Was the overall market in a confirmed uptrend when you bought the stock? Don’t fight the market. Always check the Market Pulse in IBD’s The Big Picture before buying a stock: • Confirmed Uptrend: Best time to buy stocks • Uptrend Under Pressure: Proceed with caution • Market in Correction: Don’t buy stocks See Lessons 1 and 2 20 © 2011 Investor’s Business Daily. All rights reserved.
Did the stock have all the CAN SLIM® traits when you bought it? Review the pass, neutral and fail ratings in the IBD Stock Checkup you printed at the time of your purchase. Preparation Pays Off For best results, ask these questions before you buy! 21 © 2011 Investor’s Business Daily. All rights reserved.
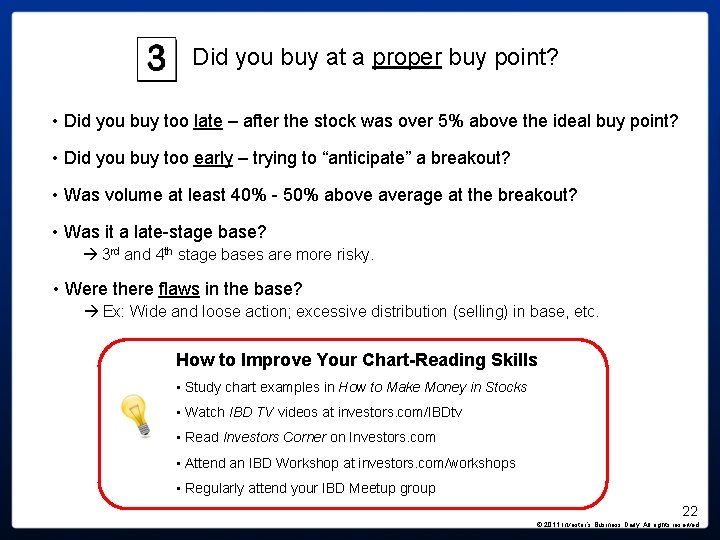
Did you buy at a proper buy point? • Did you buy too late – after the stock was over 5% above the ideal buy point? • Did you buy too early – trying to “anticipate” a breakout? • Was volume at least 40% - 50% above average at the breakout? • Was it a late-stage base? 3 rd and 4 th stage bases are more risky. • Were there flaws in the base? Ex: Wide and loose action; excessive distribution (selling) in base, etc. How to Improve Your Chart-Reading Skills • Study chart examples in How to Make Money in Stocks • Watch IBD TV videos at investors. com/IBDtv • Read Investors Corner on Investors. com • Attend an IBD Workshop at investors. com/workshops • Regularly attend your IBD Meetup group 22 © 2011 Investor’s Business Daily. All rights reserved.
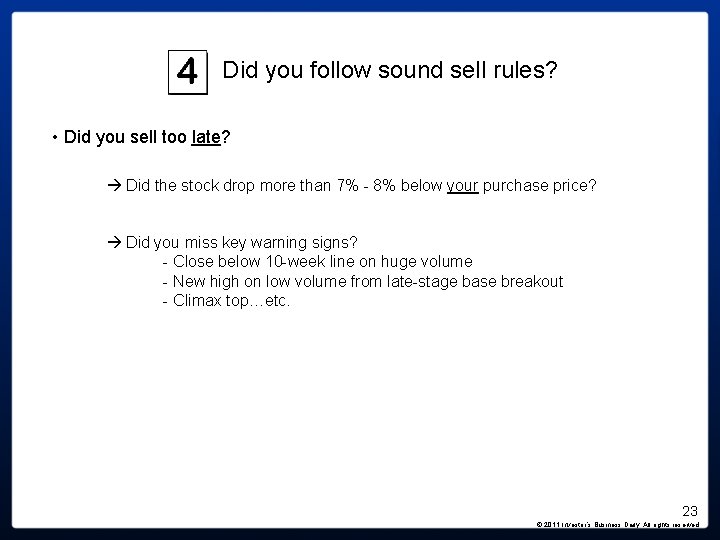
Did you follow sound sell rules? • Did you sell too late? Did the stock drop more than 7% - 8% below your purchase price? Did you miss key warning signs? - Close below 10 -week line on huge volume - New high on low volume from late-stage base breakout - Climax top…etc. 23 © 2011 Investor’s Business Daily. All rights reserved.
Did you follow sound sell rules? • Did you sell too early? Did the stock make a huge run after you sold it? Important! If you bought a big winner, but didn’t handle it properly, you must find out why – and make a specific rule to prevent that same mistake in the future. Learning to handle top growth stocks is key to making big profits. See slide 27 22 Sell Rules to Increase Profits Having trouble selling? See IBD’s exclusive series at: www. investors. com/22 Sell. Rules 24 © 2011 Investor’s Business Daily. All rights reserved.
Did you continually weed out laggards and focus your money on your best-performing stocks? To maximize your returns, you want your biggest gainers to be your biggest positions. Did you hold losing positions and sell your winners? Did you miss opportunities (e. g. , pullback to 10 -week line) to add to your strongest positions? Free Online Course: Managing Your Portfolio Under the “Education” tab on Investors. com. 25 © 2011 Investor’s Business Daily. All rights reserved.
What You Must Fix Identify and fix your 1 or 2 most serious mistakes. Preventing just 1 or 2 crucial errors can help significantly improve your future results. 26 © 2011 Investor’s Business Daily. All rights reserved.
The Most Serious Mistake You Must Fix Getting shaken out of a stock that later goes on to a huge gain. You must learn to identify which stocks have that potential and how to handle them. 27 © 2011 Investor’s Business Daily. All rights reserved.
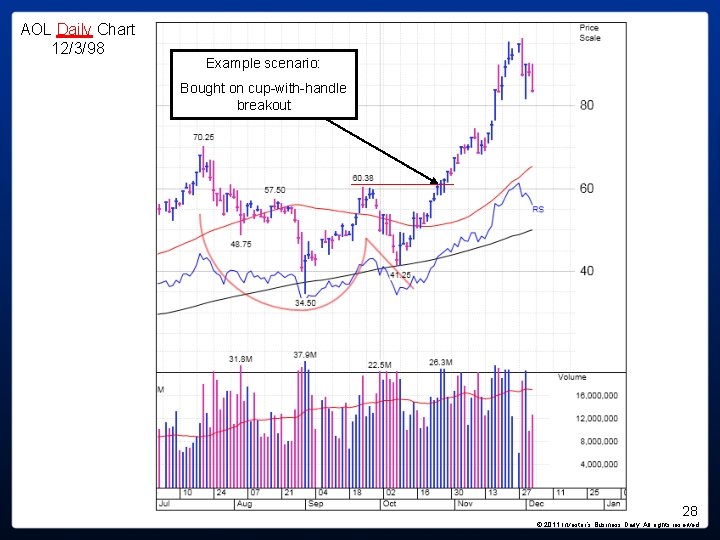
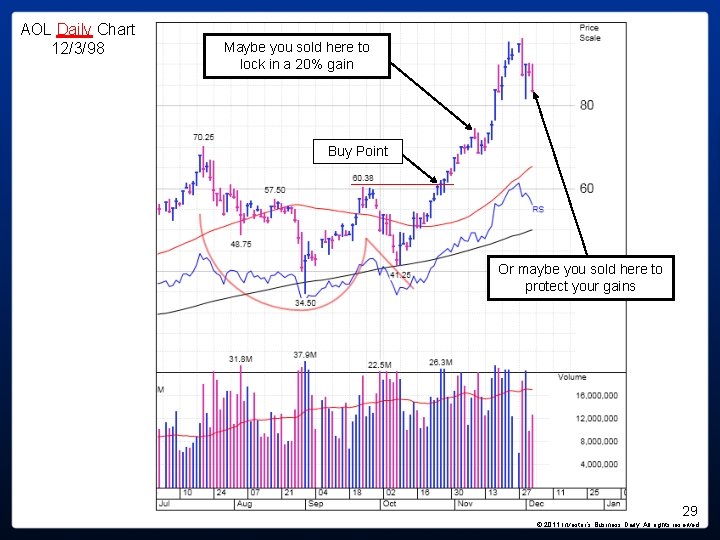
AOL Daily Chart 12/3/98 Example scenario: Bought on cup-with-handle breakout 28 © 2011 Investor’s Business Daily. All rights reserved.
AOL Daily Chart 12/3/98 Maybe you sold here to lock in a 20% gain Buy Point Or maybe you sold here to protect your gains 29 © 2011 Investor’s Business Daily. All rights reserved.
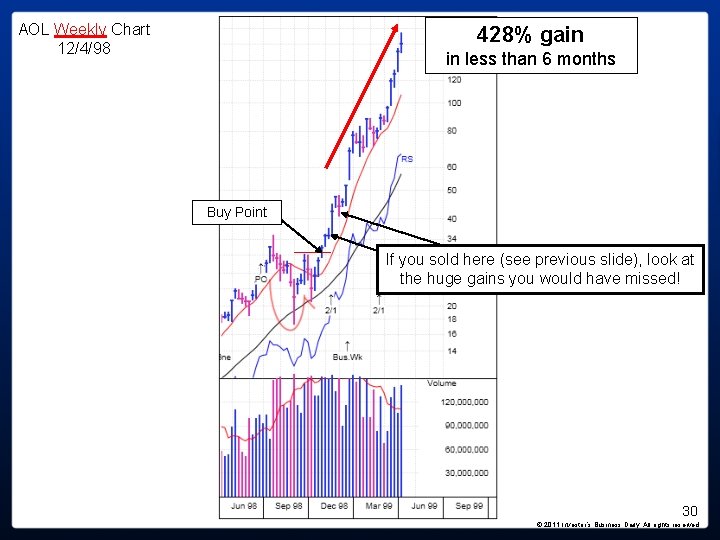
AOL Weekly Chart 12/4/98 428% gain in less than 6 months Buy Point If you sold here (see previous slide), look at the huge gains you would have missed! 30 © 2011 Investor’s Business Daily. All rights reserved.
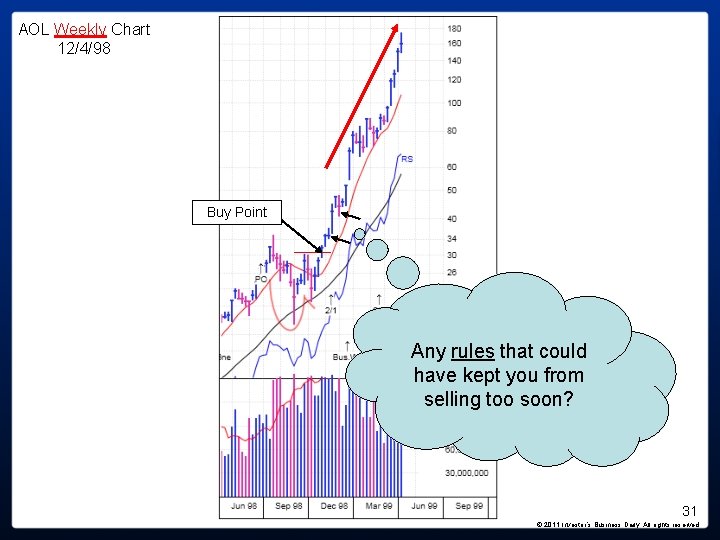
AOL Weekly Chart 12/4/98 Buy Point Any rules that could have kept you from selling too soon? 31 © 2011 Investor’s Business Daily. All rights reserved.
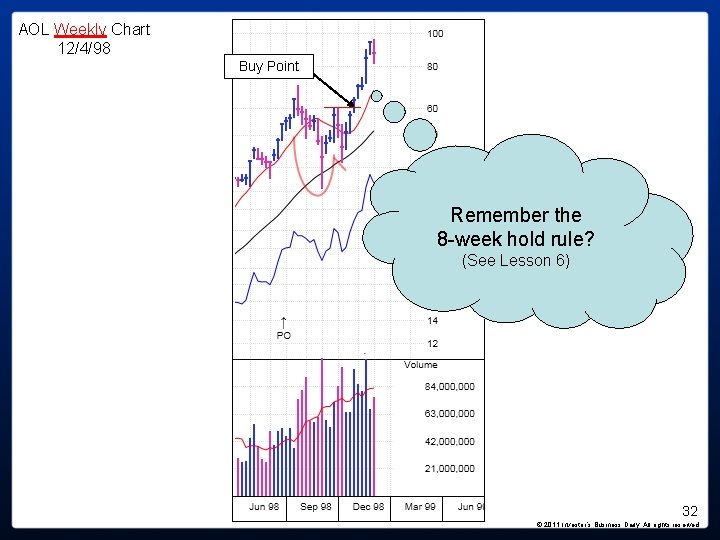
AOL Weekly Chart 12/4/98 Buy Point Remember the 8 -week hold rule? (See Lesson 6) 32 © 2011 Investor’s Business Daily. All rights reserved.
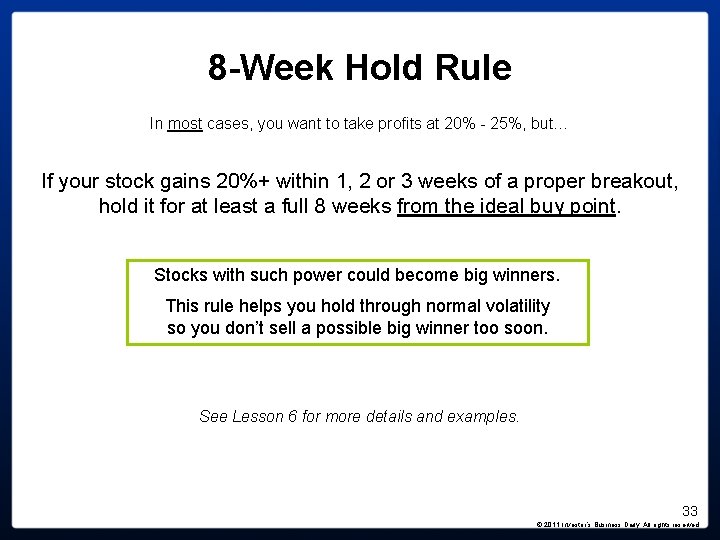
8 -Week Hold Rule In most cases, you want to take profits at 20% - 25%, but… If your stock gains 20%+ within 1, 2 or 3 weeks of a proper breakout, hold it for at least a full 8 weeks from the ideal buy point. Stocks with such power could become big winners. This rule helps you hold through normal volatility so you don’t sell a possible big winner too soon. See Lesson 6 for more details and examples. 33 © 2011 Investor’s Business Daily. All rights reserved.
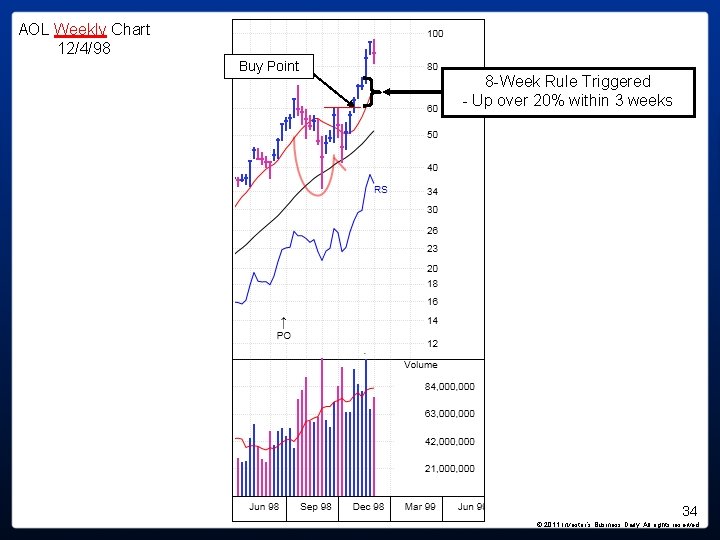
AOL Weekly Chart 12/4/98 Buy Point 8 -Week Rule Triggered - Up over 20% within 3 weeks 34 © 2011 Investor’s Business Daily. All rights reserved.
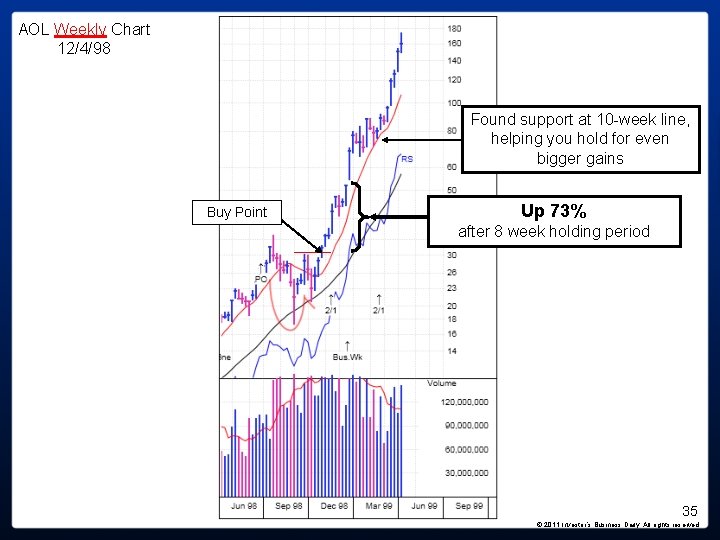
AOL Weekly Chart 12/4/98 Found support at 10 -week line, helping you hold for even bigger gains Buy Point Up 73% after 8 week holding period 35 © 2011 Investor’s Business Daily. All rights reserved.
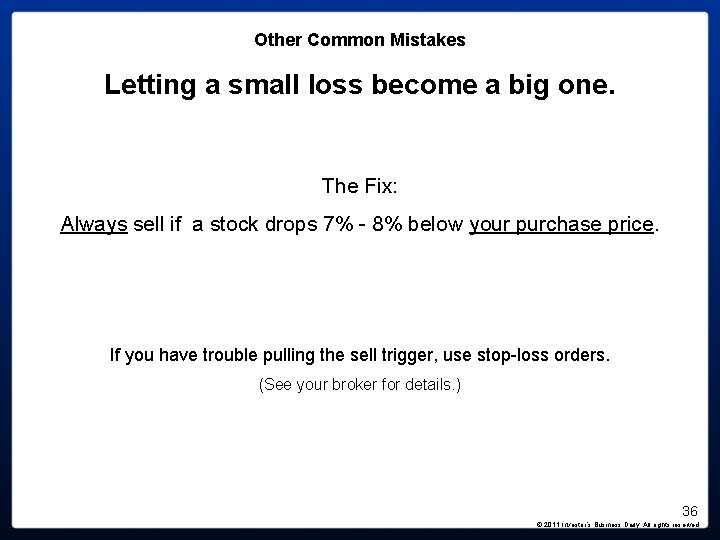
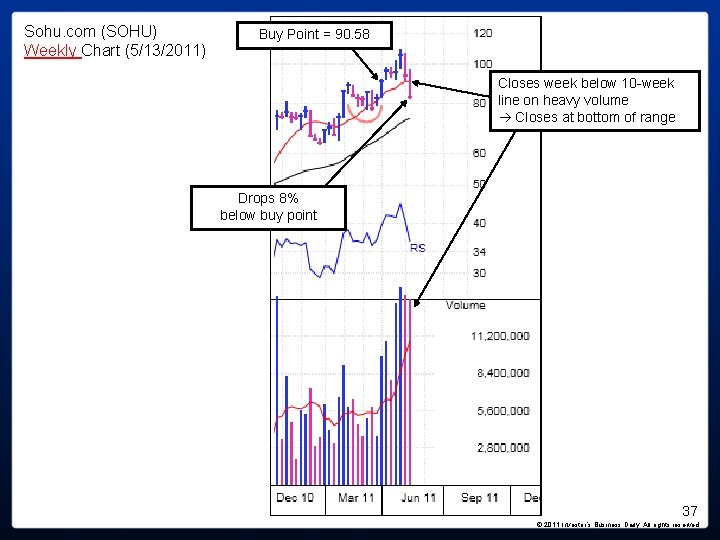
Other Common Mistakes Letting a small loss become a big one. The Fix: Always sell if a stock drops 7% - 8% below your purchase price. If you have trouble pulling the sell trigger, use stop-loss orders. (See your broker for details. ) 36 © 2011 Investor’s Business Daily. All rights reserved.
Sohu. com (SOHU) Weekly Chart (5/13/2011) Buy Point = 90. 58 Closes week below 10 -week line on heavy volume Closes at bottom of range Drops 8% below buy point 37 © 2011 Investor’s Business Daily. All rights reserved.
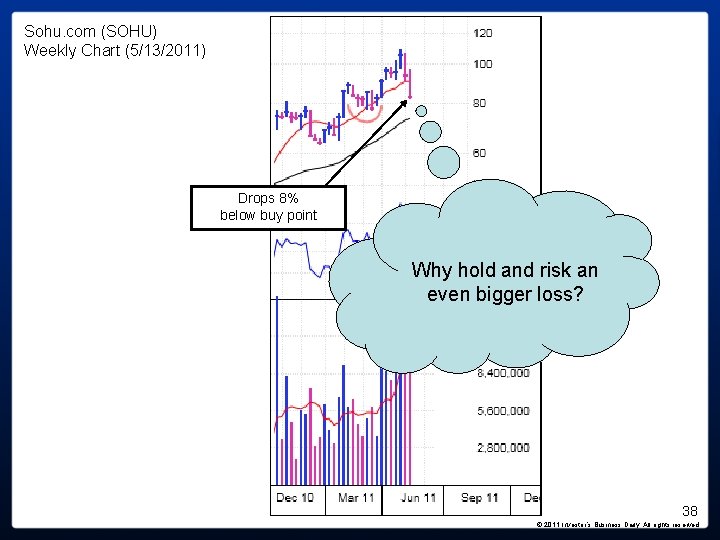
Sohu. com (SOHU) Weekly Chart (5/13/2011) Drops 8% below buy point Why hold and risk an even bigger loss? 38 © 2011 Investor’s Business Daily. All rights reserved.
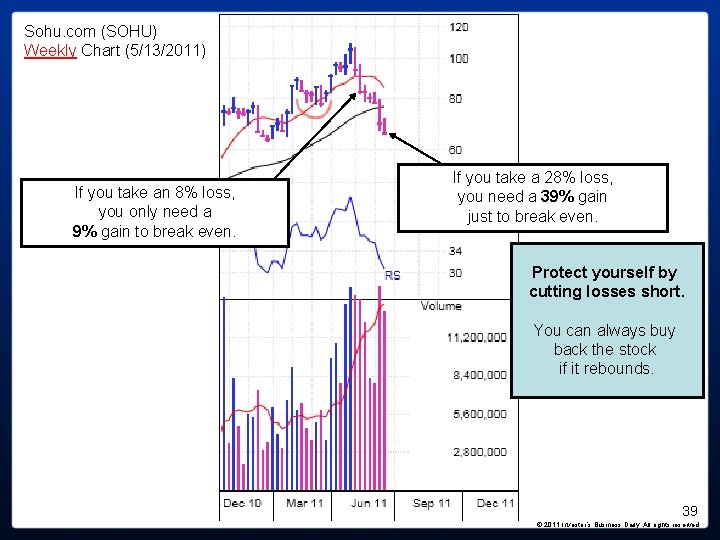
Sohu. com (SOHU) Weekly Chart (5/13/2011) If you take an 8% loss, you only need a 9% gain to break even. If you take a 28% loss, you need a 39% gain just to break even. Protect yourself by cutting losses short. You can always buy back the stock if it rebounds. 39 © 2011 Investor’s Business Daily. All rights reserved.
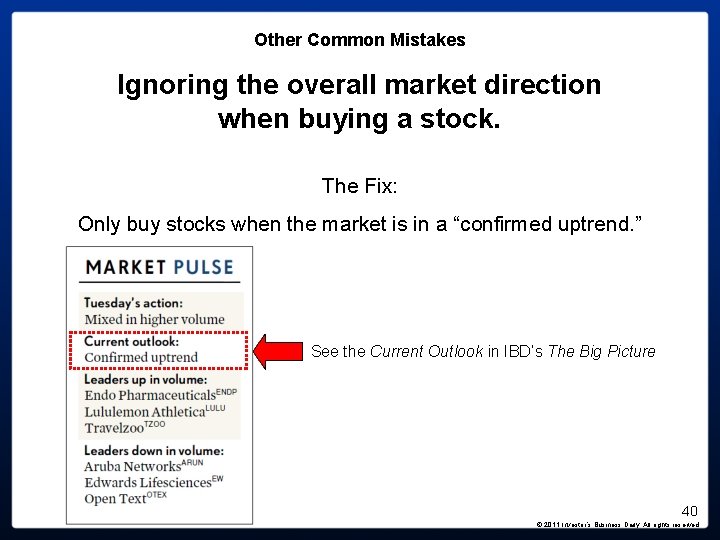
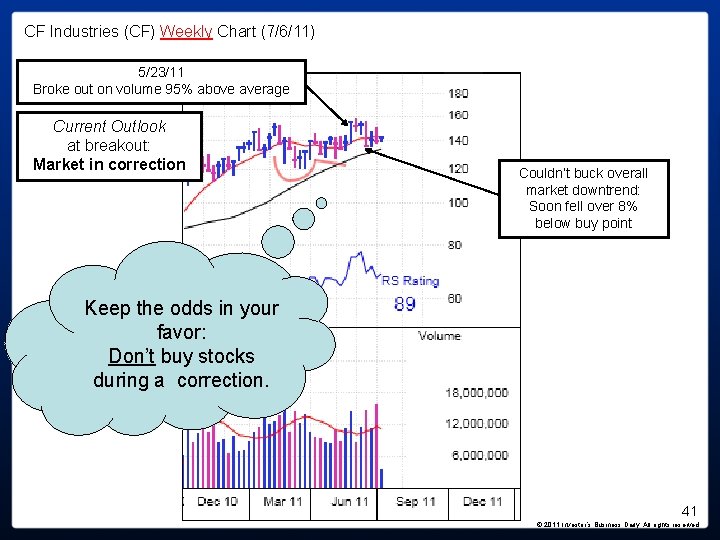
Other Common Mistakes Ignoring the overall market direction when buying a stock. The Fix: Only buy stocks when the market is in a “confirmed uptrend. ” See the Current Outlook in IBD’s The Big Picture 40 © 2011 Investor’s Business Daily. All rights reserved.
CF Industries (CF) Weekly Chart (7/6/11) 5/23/11 Broke out on volume 95% above average Current Outlook at breakout: Market in correction Couldn’t buck overall market downtrend: Soon fell over 8% below buy point Keep the odds in your favor: Don’t buy stocks during a correction. 41 © 2011 Investor’s Business Daily. All rights reserved.
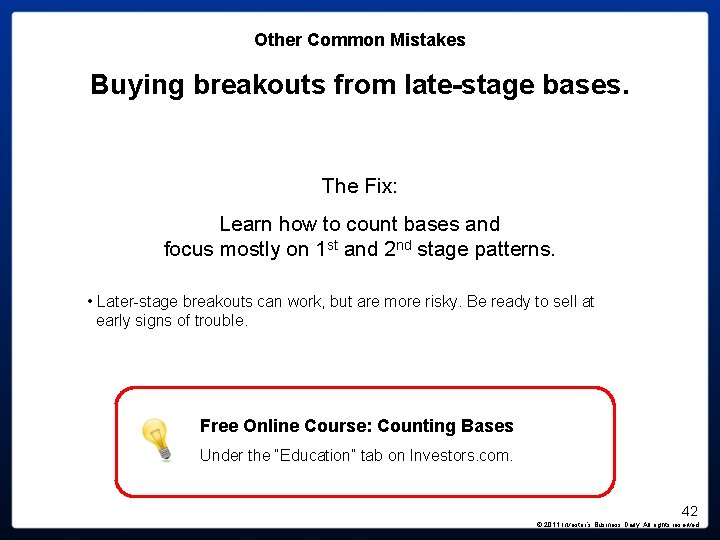
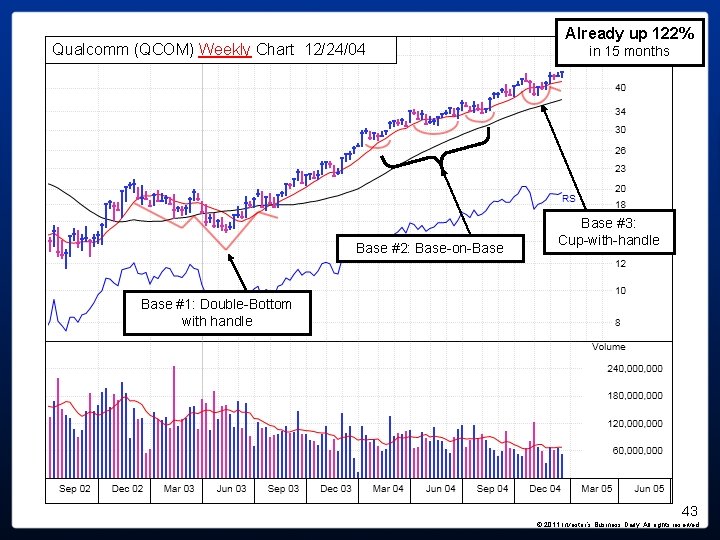
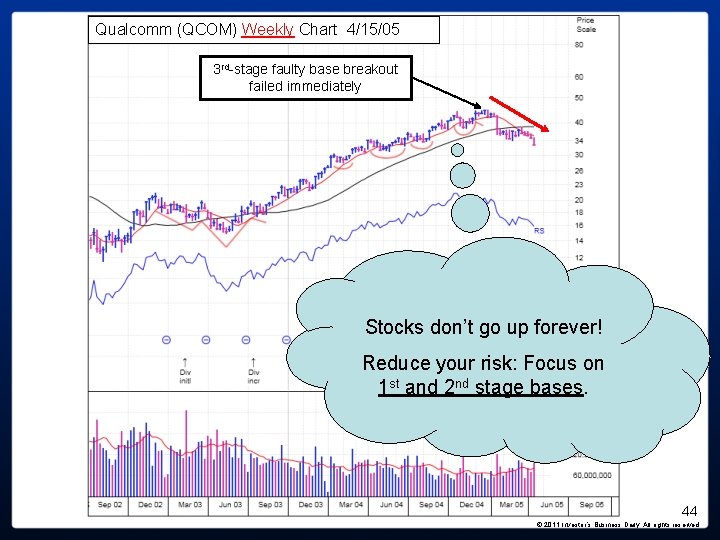
Other Common Mistakes Buying breakouts from late-stage bases. The Fix: Learn how to count bases and focus mostly on 1 st and 2 nd stage patterns. • Later-stage breakouts can work, but are more risky. Be ready to sell at early signs of trouble. Free Online Course: Counting Bases Under the “Education” tab on Investors. com. 42 © 2011 Investor’s Business Daily. All rights reserved.
Qualcomm (QCOM) Weekly Chart 12/24/04 Base #2: Base-on-Base Already up 122% in 15 months Base #3: Cup-with-handle Base #1: Double-Bottom with handle 43 © 2011 Investor’s Business Daily. All rights reserved.
Qualcomm (QCOM) Weekly Chart 4/15/05 3 rd-stage faulty base breakout failed immediately Stocks don’t go up forever! Reduce your risk: Focus on 1 st and 2 nd stage bases. 44 © 2011 Investor’s Business Daily. All rights reserved.
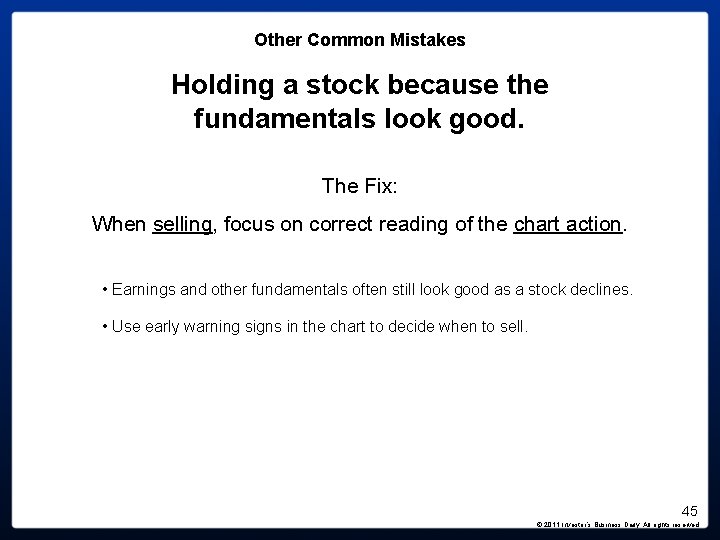
Other Common Mistakes Holding a stock because the fundamentals look good. The Fix: When selling, focus on correct reading of the chart action. • Earnings and other fundamentals often still look good as a stock declines. • Use early warning signs in the chart to decide when to sell. 45 © 2011 Investor’s Business Daily. All rights reserved.
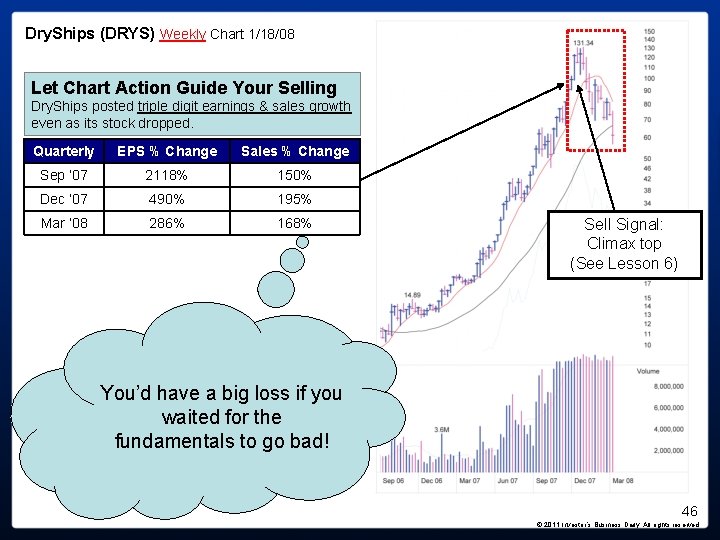
Dry. Ships (DRYS) Weekly Chart 1/18/08 Let Chart Action Guide Your Selling Dry. Ships posted triple digit earnings & sales growth even as its stock dropped. Quarterly EPS % Change Sales % Change Sep ’ 07 2118% 150% Dec ’ 07 490% 195% Mar ’ 08 286% 168% Sell Signal: Climax top (See Lesson 6) You’d have a big loss if you waited for the fundamentals to go bad! 46 © 2011 Investor’s Business Daily. All rights reserved.
Other Common Mistakes Chasing “extended” stocks. The Fix: Only buy a stock when it’s in a proper buying range: up to 5% above the ideal buy point. 47 © 2011 Investor’s Business Daily. All rights reserved.
Health. Spring (HS) Weekly Chart 1/14/11 Scenario Ideal Buy Point: 29. 48 Your purchase price: 31. 54 Proper Buying Range: 29. 48 – 30. 95 7% above ideal buy point (Up to 5% above ideal buy point) So what if I bought a little late…It’ll keep going up, right? 48 © 2011 Investor’s Business Daily. All rights reserved.
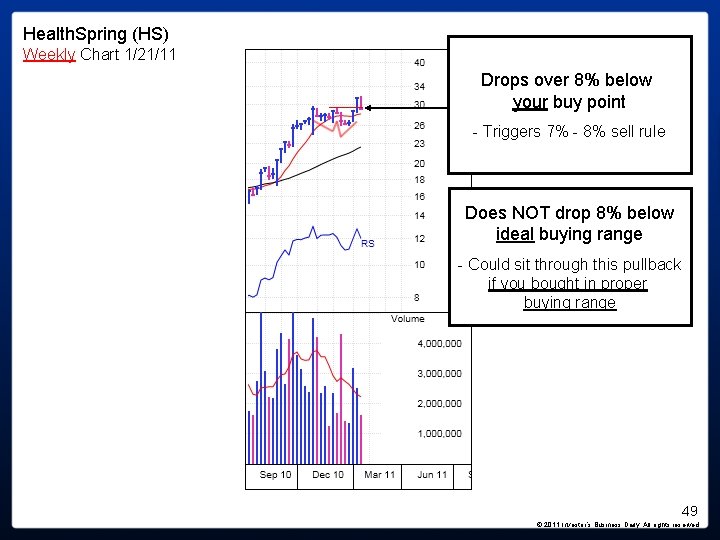
Health. Spring (HS) Weekly Chart 1/21/11 Drops over 8% below your buy point - Triggers 7% - 8% sell rule Does NOT drop 8% below ideal buying range - Could sit through this pullback if you bought in proper buying range 49 © 2011 Investor’s Business Daily. All rights reserved.
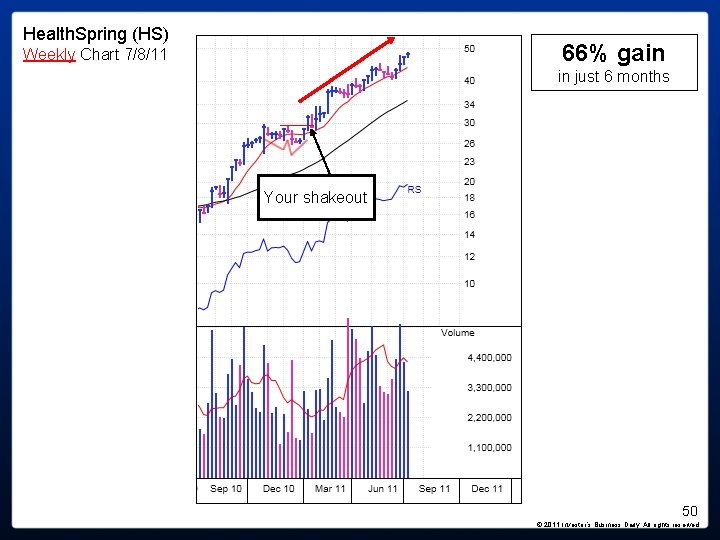
Health. Spring (HS) 66% gain Weekly Chart 7/8/11 in just 6 months Your shakeout 50 © 2011 Investor’s Business Daily. All rights reserved.
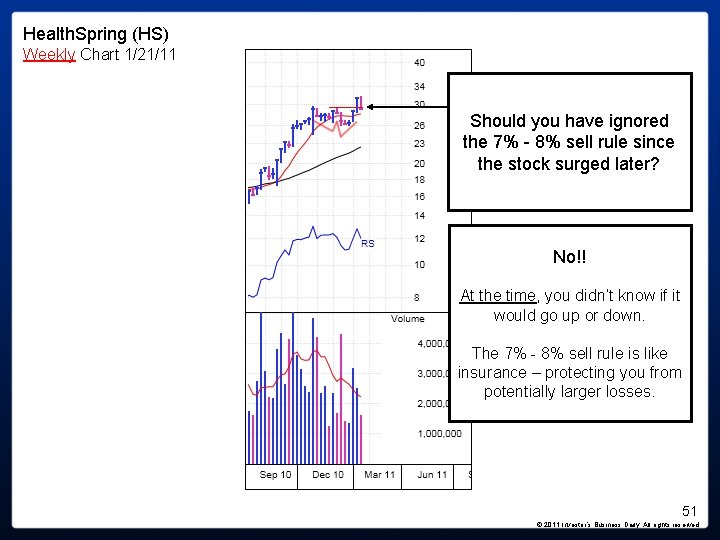
Health. Spring (HS) Weekly Chart 1/21/11 Should you have ignored the 7% - 8% sell rule since the stock surged later? No!! At the time, you didn’t know if it would go up or down. The 7% - 8% sell rule is like insurance – protecting you from potentially larger losses. 51 © 2011 Investor’s Business Daily. All rights reserved.
Health. Spring (HS) Weekly Chart 1/21/11 If you buy at a proper buy point in a market uptrend, leading stocks will rarely drop 8% below that ideal buy point. 52 © 2011 Investor’s Business Daily. All rights reserved.
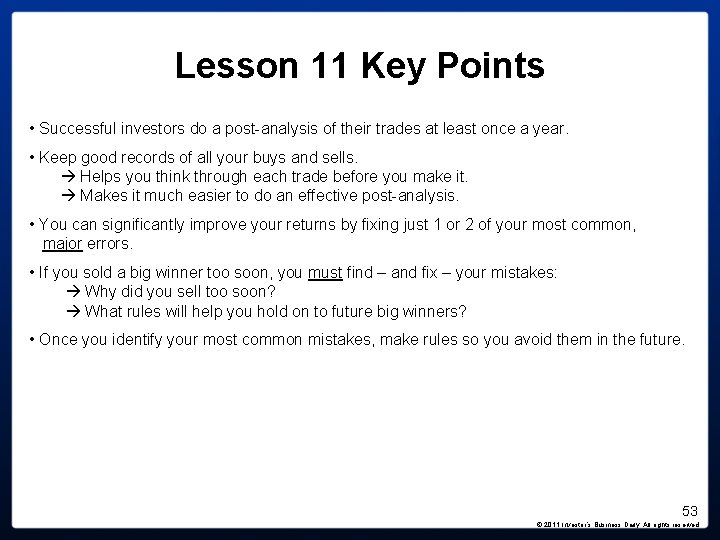
Lesson 11 Key Points • Successful investors do a post-analysis of their trades at least once a year. • Keep good records of all your buys and sells. Helps you think through each trade before you make it. Makes it much easier to do an effective post-analysis. • You can significantly improve your returns by fixing just 1 or 2 of your most common, major errors. • If you sold a big winner too soon, you must find – and fix – your mistakes: Why did you sell too soon? What rules will help you hold on to future big winners? • Once you identify your most common mistakes, make rules so you avoid them in the future. 53 © 2011 Investor’s Business Daily. All rights reserved.
Where to Learn More NEW! How to Make Money in Stocks Complete Investing System Includes How to Make Money in Stocks, Action Plan DVD, one month e. IBD subscription. Plus, a free Level I seminar in city of your choice. Free Online Courses: “Managing Your Portfolio” (See “Education” tab on Investors. com. ) Investor’s Corner: Daily investing lessons. (See “Education” tab on Investors. com) IBD Workshops: Beginning to advanced workshops on chart-reading, buy & sell rules, portfolio management and more. (See www. ibdevents. com) Learn how to spot buy and sell signals with the Market Wrap and Daily Stock Analysis videos. See “IBD TV” tab on Investors. com 54 © 2011 Investor’s Business Daily. All rights reserved.
Coming Next Month… Lesson 12: How to Profit by Picking Leading Stocks In Leading Sectors You’ll learn: a. How almost half of a stock’s move depends on the strength of its sector and industry group a. How to use IBD’s Relative Strength Rating to identify today’s leading stocks a. Where to easily find the top-performing stocks in the top-performing sectors using IBD …and more! Stay in Touch! Get the latest updates from IBD on Twitter and Facebook! www. facebook. com/investorsbusinessdaily www. twitter. com/IBDinvestors 55 © 2011 Investor’s Business Daily. All rights reserved.
The comments expressed here are based upon study and interpretation of available data as it relates to our historical models of the best-performing stocks. This is not a prospectus; no effort on our part with respect to sale or purchase of any securities is intended or implied. Any chart appearing in this material is for educational purposes and is not, and should not be construed as a recommendation or rating to buy or sell any security. It is possible that at this date or some subsequent date, the officers, directors and/or shareholders of Investor’s Business Daily, Inc. or their affiliates own securities or buy or sell securities listed in the following pages, or those not mentioned. © 2011 Investor’s Business Daily. All rights reserved. Investor’s Business Daily, IBD, CAN SLIM and corresponding logos are registered trademarks owned by Investor’s Business Daily, Inc. 56 © 2011 Investor’s Business Daily. All rights reserved.