INVESTMENT PHILOSOPHIES INVESTING 101 Aswath Damodaran www damodaran


 levered")


 well: Good venture")


 There is low or no")


 As you move from hours")


 115")

 In contrast to the studies of short term")


 Price is determined solely by")


 and less frequently elsewhere, firms")


- Slides: 185
INVESTMENT PHILOSOPHIES: INVESTING 101 Aswath Damodaran www. damodaran. com
What is an investment philosophy? What is it? An investment philosophy is a coherent way of thinking about markets, how they work (and sometimes do not) and the types of mistakes that you believe consistently underlie investor behavior. � Investment philosophy vs. Investment strategy: An investment strategy is much narrower. It is a way of putting into practice an investment philosophy. � In brief: An investment philosophy is a set of core beliefs that you can go back to in order to generate new strategies when old ones do not work. � 2
Ingredients of an Investment Philosophy Step 1: All investment philosophies begin with a view about how human beings learn (or fail to learn). Underlying every philosophy, therefore, is a view of human frailty - that they learn too slowly, learn too fast, tend to crowd behavior etc…. Step 2: From step 1, you generate a view about how markets behave and perhaps where they fail…. Your views on market efficiency or inefficiency are the foundations for your investment philosophy. Step 3: This step is tactical. You take your views about how investors behave and markets work (or fail to work) and try to devise strategies that reflect your beliefs. 3
Why do you need an investment philosophy? If you do not have an investment philosophy, you will find yourself: 1. Lacking a rudder or a core set of beliefs, you will be easy prey for charlatans and pretenders, with each one claiming to have found the magic strategy that beats the market. 2. Switching from strategy to strategy, you will have to change your portfolio, resulting in high transactions costs and you will pay more in taxes. 3. With a strategy that may not be appropriate for you, given your objectives, risk aversion and personal characteristics. In addition to having a portfolio that under performs the market, you are likely to find yourself with an ulcer or worse. 4
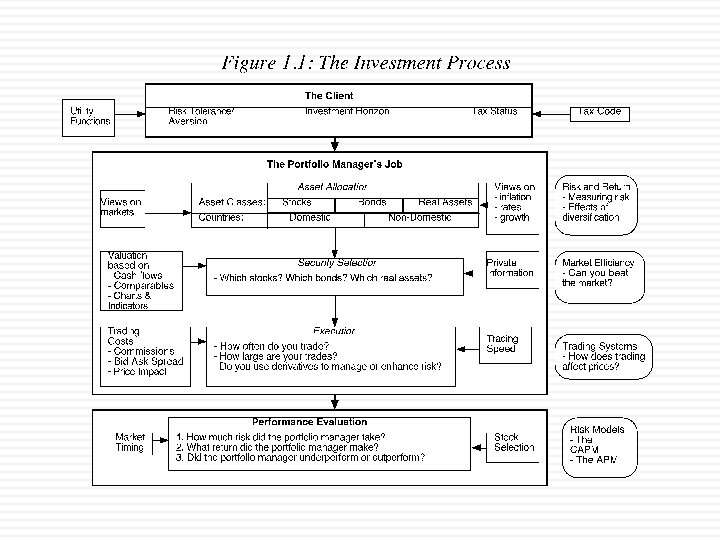
Investment Process & Philosophy
Categorizing Investment Philosophies � � Market Timing versus Asset Selection: With market timing, you bet on the movement of entire markets - financial as well as real assets. With asset selection, you focus on picking good investments within each market. Activist Investing and Passive Investing: With passive investing, you take positions in companies and hope that the market corrects its mistakes. With activist investing, you play a role (or provide the catalyst) in correcting market mistakes. Time Horizon: Some philosophies require that you invest for long time periods. Others are based upon short holding periods. Pricing versus Investing: In a pricing philosophy, you play a pricing game, hoping to buy at a low price and sell at a high one. In an investing philosophy, you buy when the price is lower than the value on the belief that the gap will close. 7
Developing an Investment Philosophy � Step 1: Acquire the tools of the trade Be able to assess risk and incorporate into investment decisions � Understand financial statements � Be aware of the frictions and the costs of trading � � � Step 2: Develop a point of view about how markets work and where they might break down Step 3: Find the philosophy that provides the best fit for you, given your Risk aversion � Time Horizon � Tax Status � 8
I. Investor Risk Preferences � The trade off between Risk and Return Most, if not all, investors are risk averse � To get them to take more risk, you have to offer higher expected returns � Conversely, if investors want higher expected returns, they have to be willing to take more risk. � � - Ways of evaluating risk Most investors do not know have a quantitative measure of how much risk that they want to take � Traditional risk and return models tend to measure risk in terms of volatility or standard deviation � 9
Summing Up on Risk Whether we measure risk in quantitative or qualitative terms, investors are risk averse. � The degree of risk aversion will vary across investors at any point in time, and for the same investor across time (as a function of his or her age, wealth, income and health) � Proposition 1: The more risk averse an investor, the less of his or her portfolio should be in risky assets (such as equities). � 10
II. Investor Time Horizon An investor’s time horizon reflects personal characteristics: Some investors have the patience needed to hold investments for long time periods and others do not. � need for cash. Investors with significant cash needs in the near term have shorter time horizons than those without such needs. � An investor’s time horizon will have an influence on both the kinds of assets that investor will hold in his or her portfolio and the weights of those assets. Proposition 2: The longer the time horizon of an investor, the greater the proportion of the portfolio that should be in “risky” investments (such as equities). 11
III. Tax Status and Portfolio Composition � Investors can spend only after-tax returns. Hence taxes do affect portfolio composition. � � � The portfolio that is right for an investor who pays no taxes might not be right for an investor who pays substantial taxes. Moreover, the portfolio that is right for an investor on one portion of his portfolio (say, his tax-exempt pension fund) might not be right for another portion of his portfolio (such as his taxable savings) The effect of taxes on portfolio composition and returns is made more complicated by: � � � The different treatment of current income (dividends, coupons) and capital gains The different tax rates on various portions of savings (pension versus non-pension) Changing tax rates across time 12
The most important lesson in investing Know your clients: When you are investing other peoples’ money, it is critical that you know those people, understand what makes them happy (or unhappy) and their risk aversion. Know yourself: It is even more important that you know yourself. Spend less time reading about what makes Warren Buffett tick and more time thinking about yourself. 13
Value and Price Discerning the Difference The pricing game and the value game. .
Value Process versus Price Process 15
Three views of “the gap” View of the gap Investment Strategies The Efficient Marketer The gaps between price and value, if they do occur, are random. Index funds The “value” extremist You view pricers as dilettantes who will move on to fad and fad. Eventually, the price will converge on value. Buy and hold stocks where value < price The pricing extremist Value is only in the heads of the “eggheads”. Even if it exists (and it is questionable), price may never converge on value. (1) Look for mispriced securities. (2) Get ahead of shifts in demand/momentum. 16
A Bird’s Eye View of Investment Philosophies 17
I. Intrinsic Valuation Investors Value versus Growth Investing Intrinsic value investors believe that growth is inherently speculative and that prudent investors should try to buy companies where the market value < intrinsic value of assets in place Intrinsic growth investors believe that growth is more likely to be misvalued because most investors give up. Consequently, they believe that there is more money to be had betting on the value of growth. 18
The valuer’s dilemma and ways of dealing with it… Uncertainty about the magnitude of the gap: Your estimate of value may be incorrect, making the gap a “fiction of your mind” Even the best intrinsic valuers know that they can be wrong (and sometimes very much so) about their estimates of value. � Consequently, they may see gaps that don’t exist and will therefore never close. � Uncertainty about gap closing: Even if you are right about value, you still may be uncertain about whether the gap will close and if so, when. � You can be right about value, but without a catalyst, the gap may get bigger, rather than smaller. 19
II. The Pricers Chartists and Technicians: If price is set by demand supply (and it is), these investors believe that the clues to future price movements lie in past prices and/or volume. In effect, they believe that poring over a stock’s trading history can give you early notice of coming shifts in demand/supply and therefore prices. Arbitrageurs: To the extent that the price of an asset is the only known variable, these investors believe that a true bargain requires you to be able to buy an asset at a price today in one market, while selling the same asset in a different market at exactly the same point in time. 20
The “pricers” dilemma. . No anchor: If you do not believe in intrinsic value and make no attempt to estimate it, you have no moorings when you invest. You will therefore be pushed back and forth as the price moves from high to low. In other words, everything becomes relative and you can lose perspective. Reactive: Without a core measure of value, your investment strategy will often be reactive rather than proactive. Crowds are fickle and tough to get a read on: The key to being successful as a pricer is to be able to read the crowd mood and to detect shifts in that mood early in the process. By their nature, crowds are tough to read and almost impossible to model systematically. 21
III. The Information Traders While both intrinsic valuation and pricing investors try to make judgments on the level of the price, information traders adopt a more agnostic (and what they feel is a less risky strategy). Rather then guess whether a stock is cheap or expensive, they try to make money by guessing the change in the price, in response to new information. This can take the form of either: Guessing whether the next information announcement will be good or bad news to the market (Example: Trading ahead of earnings reports) � Evaluating whether the price response to the latest information announcement was appropriate. (Example: Betting that stocks over react to “bad” earnings reports…) � 22
The information trader’s dilemma The value danger: If the intrinsic valuation investors are right and a stock is mispriced relative to intrinsic value, the change in the price in response to new information can be drowned out by the overall price correcting towards value. � The price danger: To the extent that the pricing process has its own dynamics, the effect of information on prices can be unpredictable (and costly). � 23
IV. The Market Timers As market timers see it, the big money to be made on investing is not in picking individual stock winners but in getting the direction of the overall market right. Market timers come in all forms, and in fact you can have market timers who are Intrinsic valuation investors, who value the entire market, compare to the price and hope that the gap closes. � Pricing investors, who believe that the future direction of the market can be gauged by looking at past price movements/ trading volume � Information traders, who feel that there is money to be made in looking at the overall market’s reactions to news events (usually macro). � 24
The market timers dilemma… Everyone does it: Everyone who invests is a market timer, with the only difference being one of degree. We all have views of the market, though me never admit to them, and those views mold how much we invest, in which markets we invest and when we invest. Consequently, it is a game that is played by tens of millions, making it much more difficult to win. No competitive advantage: To win at a game, you have to bring something to the table that is unique and difficult to replicate. It is not clear what “that” is, with market timing. 25
V. The Efficient Marketer The true believers: There a few efficient marketers who took a look at the random walk, read financial market theory and were convinced immediately that there is little or no chance that any of the afore mentioned philosophies had any chance of success. � The school of hard knocks: There are far more efficient marketers who have got there after years of experimenting with different philosophies, with little success with each. They are believers that nothing works because nothing has worked for them. � 26
So, what are you? � q q q q If you were asked to classify your investment philosophy, what would you classify yourself as? Intrinsic value investor Intrinsic growth investor Technical Analyst/ Chartist Arbitrageur Information trader Market Timer Efficient Marketer 27
The Righteous Ones: Intrinsic Value Investors
Three faces of value investing… Passive Screeners: Following in the Ben Graham tradition, you screen for stocks that have characteristics that you believe identify under valued stocks. � Contrarian Investors: These are investors who invest in companies that others have given up on, either because they have done badly in the past or because their future prospects look bleak. � Activist Value Investors: These are investors who invest in poorly managed and poorly run firms but then try to change the way the companies are run. � 29
I. The Passive Screener This approach to value investing can be traced back to Ben Graham and his screens to find undervalued stocks. � With screening, you are looking for companies that are cheap (in the market place) without any of the reasons for being cheap (high risk, low quality growth, low growth). � 30
a. Ben Graham’ Screens 1. PE of the stock has to be less than the inverse of the yield on AAA Corporate Bonds: 2. PE of the stock has to less than 40% of the average PE over the last 5 years. 3. Dividend Yield > Two-thirds of the AAA Corporate Bond Yield 4. Price < Two-thirds of Book Value 5. Price < Two-thirds of Net Current Assets 6. Debt-Equity Ratio (Book Value) has to be less than one. 7. Current Assets > Twice Current Liabilities 8. Debt < Twice Net Current Assets 9. Historical Growth in EPS (over last 10 years) > 7% 10. No more than two years of negative earnings over the previous ten years. 31
How well do Graham’s screen’s perform? Graham’s best claim to fame comes from the success of the students who took his classes at Columbia University. Among them were Charlie Munger and Warren Buffett. However, none of them adhered to his screens strictly. A study by Oppenheimer concluded that stocks that passed the Graham screens would have earned a return well in excess of the market. Mark Hulbert who evaluates investment newsletters concluded that newsletters that used screens similar to Graham’s did much better than other newsletters. However, an attempt by James Rea to run an actual mutual fund using the Graham screens failed to deliver the promised returns. 32
b. The Buffett Magic 33
Buffett’s Tenets Business Tenets: The business the company is in should be simple and understandable. The firm should have a consistent operating history, manifested in operating earnings that are stable and predictable. The firm should be in a business with favorable long term prospects. Management Tenets: The managers of the company should be candid. As evidenced by the way he treated his own 34
Updating Buffett’s record Berkshire Hathaway: The Fading Buffett Premium $400, 000 3. 00 2. 62 $350, 000 2. 42 2. 50 2. 27 $300, 000 $250, 000 1. 84 1. 90 1. 91 1. 87 1. 62 $200, 000 1. 82 1. 57 2. 00 1. 80 1. 61 1. 54 1. 52 1. 51 1. 37 1. 33 1. 21 1. 34 1. 29 1. 30 1. 50 1. 07 $150, 000 1. 00 $100, 000 0. 50 $50, 000 $0 1993 1994 1995 1996 1997 1998 1999 2000 2001 2002 2003 2004 2005 2006 2007 2008 2009 2010 2011 2012 2013 2014 2015 P/BV Ratio Market Cap 0. 00 BV of Equity 35
So, what happened? Imitators: His record of picking winners has attracted publicity and a crowd of imitators who follow his every move, buying everything be buys, making it difficult for him to accumulate large positions at attractive prices. Scaling problems: At the same time the larger funds at his disposal imply that he is investing far more than he did two or three decades ago in each of the companies that he takes a position in, creating a larger price impact (and lower profits) Macro game? The crises that have beset markets over the last few years have been both a threat and an opportunity for Buffett. As markets have staggered through the crises, the biggest factors driving stock prices and investment success have become macroeconomic unknowns and not the company-specific factors that Buffett has historically viewed as his competitive edge (assessing a company’s profitability and cash flows). 36
Be like Buffett? Markets have changed since Buffett started his first partnership. Even Warren Buffett would have difficulty replicating his success in today’s market, where information on companies is widely available and dozens of money managers claim to be looking for bargains in value stocks. In recent years, Buffett has adopted a more activist investment style and has succeeded with it. To succeed with this style as an investor, though, you would need substantial resources and have the credibility that comes with investment success. There are few investors, even among successful money managers, who can claim this combination. The third ingredient of Buffett’s success has been patience. As he has pointed out, he does not buy stocks for the short term but businesses for the long term. He has often been willing to hold stocks that he believes to be under valued through disappointing years. In those same years, he has faced no pressure from impatient investors, since stockholders in Berkshire Hathaway have such high regard for him. 37
c. Value Screens Price to Book ratios: Buy stocks where equity trades at less than book value or at least a low multiple of the book value of equity. � Price earnings ratios: Buy stocks where equity trades at a low multiple of equity earnings. � Dividend Yields: Buy stocks with high dividend yields. � 38
i. Price/Book Value Screens 39
Caveat Emptor on P/BV ratios A risky proxy? Fama and French point out that low price-book value ratios may operate as a measure of risk, since firms with prices well below book value are more likely to be in trouble and go out of business. Investors therefore have to evaluate for themselves whether the additional returns made by such firms justifies the additional risk taken on by investing in them. Low quality returns/growth: The price to book ratio for a stable growth firm can be written as a function of its ROE, growth rate and cost of equity: Companies that are expected to earn low returns on equity will trade at low price to book ratios. In fact, if you expect the ROE < Cost of equity, the stock should trade at below book value of equity. 40
ii. Price/Earnings Ratio Screens 41
What can go wrong? 1. 2. 3. Companies with high-risk earnings: The excess returns earned by low price earnings ratio stocks can be explained using a variation of the argument used for small stocks, i. e. , that the risk of low PE ratios stocks is understated in the CAPM. A related explanation, especially in the aftermath of the accounting scandals of recent years, is that accounting earnings is susceptible to manipulation. Tax Costs: A second possible explanation that can be given for this phenomenon, which is consistent with an efficient market, is that low PE ratio stocks generally have large dividend yields, which would have created a larger tax burden for investors since dividends were taxed at higher rates during much of this period. Low Growth: A third possibility is that the price earnings ratio is low because the market expects future growth in earnings to be low or even negative. Many low PE ratio companies are in mature businesses where the potential for growth is minimal. 42
iii. Dividend Yields 43
Determinants of Success at Passive Screening 1. Have a long time horizon: All the studies quoted above look at returns over time horizons of five years or greater. In fact, low price-book value stocks have underperformed high pricebook value stocks over shorter time periods. 2. Choose your screens wisely: Too many screens can undercut the search for excess returns since the screens may end up eliminating just those stocks that create the positive excess returns. 3. Be diversified: The excess returns from these strategies often come from a few holdings in large portfolio. Holding a small portfolio may expose you to extraordinary risk and not deliver the same excess returns. 4. Watch out for taxes and transactions costs: Some of the screens may end up creating a portfolio of low-priced stocks, which, in turn, create larger transactions costs. 44
The Value Investors’ Protective Armor Accounting checks: Rather than trust the current earnings, value investors often focus on three variants: � � � Normalized earnings, i. e. , average earnings over a period of time. Adjusted earnings, where investors devise their corrections to earnings for what they see as shortcomings in conventional accounting earnings. Owner’s earnings, where depreciation, amortization and other noncash charges are added back and capital expenditures to maintain existing assets is subtracted out. The Moat: The “moat” is a measure of a company’s competitive advantages; the stronger and more sustainable a company’s competitive advantages, the more difficult it becomes for others to breach the moat and the safer becomes the earnings stream. 45
A 2016 Update In the days of Ben Graham, running his screens on stocks required access to annual reports (that most people did not have), manpower to enter the numbers onto paper and time to compute the screens. Thus, any investor who actually went through these steps had a significant advantage over the rest of the market. Today, with data at our fingertips and screens available online, anyone can run these screens and find “cheap” stocks. There is no differential advantage left anymore. So, why should you expect to get rewarded for running screens? 46
II. Contrarian Value Investing: Buying the Losers � � In contrarian value investing, you begin with the proposition that markets over react to good and bad news. Consequently, stocks that have had bad news come out about them (earnings declines, deals that have gone bad) are likely to be under valued. Evidence that Markets Overreact to News Announcements Studies that look at returns on markets over long time periods chronicle that there is significant negative serial correlation in returns, I. e, good years are more likely to be followed by bad years and vice versal. � Studies that focus on individual stocks find the same effect, with stocks that have done well more likely to do badly over the next period, and vice versa. � 47
Winner and Loser portfolios 48
Loser Portfolios and Time Horizon 49
Determinants of Success at “Contrarian Investing” 1. Self Confidence: Investing in companies that everybody else views as losers requires a self confidence that comes either from past success, a huge ego or both. 2. Clients/Investors who believe in you: You either need clients who think like you do and agree with you, or clients that have made enough money of you in the past that their greed overwhelms any trepidiation you might have in your portfolio. 3. Patience: These strategies require time to work out. For every three steps forward, you will often take two steps back. 4. Stomach for Short-term Volatility: The nature of your investment implies that there will be high short term volatility and high profile failures. 5. Watch out for transactions costs: These strategies often lead to portfolios of low priced stocks held by few institutional investors. The transactions costs can wipe out any perceived excess returns quickly. 50
III. Activist Value Investing Passive investors buy companies with a pricing gap and hope (and pray) that the pricing gap closes. Activist investors buy companies with a value and/or pricing gap and provide the catalysts for closing the gaps. 51
1. Asset Deployment: Why assets may be deployed in sub-optimal uses… Ego, overconfidence and bias: The original investment may have been colored by any or all of these factors. Failure to adjust for risk: The original risk assessment may have been appropriate but the company failed to factor in changes in the project’s risk profile over time. Diffuse businesses: By spreading themselves thinly across multiple bsuinesses, it is possible that some of these businesses may be run less efficiently than if they were stand alone businesses, partly because accountability is weak and partly because of cross subsidies. Changes in business: Even firms that make unbiased and well reasoned judgments about their investments, at the time that they make them, can find that unanticipated changes in the business or sector can make good investments into bad ones. Macroeconomic changes: Value creating investments made in assets when the economy is doing well can reverse course quickly, if the economy slows down or goes into a recession. 53
Redeploying assets: Shut down or divestiture Shut down: If an investment is losing money and/or the company can reclaim the capital it originally invested in an investment that earns less than its cost of capital, you should shut it down. Divestiture: Divesting bad businesses will enhance value if and only if the divestiture value > continuing value of the bad business. The market reaction to asset divestitures is generally positive, but more so if the motive for the divestiture and the consequences are transparent. 54
And markets generally react positively to spin offs… 55
2. Capital Structure/ Financing 56
Cost of capital as a tool for assessing the optimal mix 57
Ways of adjusting financing mix Marginal recapitalization: A firm that is under (over) levered can use a disproportionately high (low) debt ratio to fund new investments. Total recapitalization: In a recapitalization, a firm changes its financial mix of debt and equity, without substantially altering its investments or asset holdings. If under levered, the firm can borrow money and buy back stock or do a debt for equity swap. If over levered, it can issue new equity to retire debt or offer its debt holders equity positions in the company. Leveraged acquisition: If a firm is under levered and the existing management is too conservative and stubborn to change, there is an extreme alternative. An acquirer can borrow money, implicitly using the target firm’s debt capacity, and buy out the firm. 58
3. Dividend policy 59
If you have too much cash… Stock Buybacks Dividends 2015 2014 2013 2012 2011 2010 2009 2008 2007 2006 2005 0. 00 2004 Proportion of cash from buybacks 10. 00% 2003 100. 00 2002 20. 00% 2001 200. 00 2000 30. 00% 1999 300. 00 1998 40. 00% 1997 400. 00 1996 50. 00% 1995 500. 00 1994 60. 00% 1993 600. 00 1992 70. 00% 1991 700. 00 1990 80. 00% 1989 800. 00 1988 Dividends and Buybacks (in billions) Dividends and Buybacks - US Companies 0. 00% Proportion from Buybacks 60
4. Corporate Governance To value corporate governance, consider two estimates of value for the same firm: � � In the first, you value the company run by the existing managers, warts and all, and call this the status quo value. In the second, you value the company run by “optimal” management and term this the “optimal” value. To the extent that there at least some dimensions where the incumbent managers are falling short, the latter should be higher than the former. The price at which the stock will trade in a reasonably efficient market will be a weighted average of these two value: � Expected value = (Probability of no change in management) (Status quo value) + Probability of change in management) (Optimal value) 61
a. Proxy contests At large publicly traded firms with widely dispersed stock ownership, annual meetings are lightly attended. For the most part, stockholders in these companies tend to stay away from meetings and incumbent managers usually get their votes by default, thus ensuring management approved boards. Activist investors compete with incumbent managers for the proxies of individual investors, with the intent of getting their nominees for the board elected. While they may not always succeed at winning majority votes, they do put managers on notice that they are accountable to stockholders. There is evidence that proxy contests occur more often in companies that are poorly run, and that they sometimes create significant changes in management policy and improvements in operating performance. 62
b. Change top management � The overall empirical evidence suggests that changes in management are generally are viewed as good news. 63
c. The Effects of Hostile Acquisitions on the Target Firm � Badly managed firms are much more likely to be targets of acquistions than well managed firms 64
How do markets react? 65
What returns do activist investors make for themselves? Overall returns: Activist mutual funds seem to have had the lowest payoff to their activism, with little change accruing to the corporate governance, performance or stock prices of targeted firms. Activist hedge funds, on the other hand, seem to earn substantial excess returns, ranging from 7 -8% on an annualized basis at the low end to 20% or more at the high end. Individual activists seem to fall somewhere in the middle, earning higher returns than institutions but lower returns than hedge funds. Volatility in returns: While the average excess returns earned by hedge funds and individual activists is positive, there is substantial volatility in these returns and the magnitude of the excess return is sensitive to the benchmark used and the risk adjustment process. Skewed distributions: The average returns across activist investors obscures a key component, which is that the distribution is skewed with the most positive returns being delivered by the activist investors in the top quartile; the median activist investor may very well just break even, especially after accounting for the cost of activism. 66
Can you make money following the activists? Reactive strategy: Since the bulk of the excess returns are earned in the days before the announcement of activism, there is little to be gained in the short term by investing in a stock, after it has been targeted by activist investors. You may be able to improve your returns by following the right activists, looking for performance cues at the targeted companies and hoping for a hostile acquisiton windfall. Overall, though, a strategy of following activist investors is likely to yield modest returns, at best, because you will be getting the scraps from the table. Proactive strategy: There is an alternate strategy worth considering, that may offer higher returns, that also draws on activist investing. You can try to identify companies that are poorly managed and run, and thus most likely to be targeted by activist investors. In effect, you are screening firms for low returns on capital, low debt ratios and large cash balances, representing screens for potential value enhancement, and ageing CEOs, corporate scandals and/or shifts in voting rights operating as screens for the management change. 67
Determinants of Success at Activist Investing 1. Have lots of capital: Since this strategy requires that you be able to put pressure on incumbent management, you have to be able to take significant stakes in the companies. 2. Know your company well: Since this strategy is going to lead a smaller portfolio, you need to know much more about your companies than you would need to in a screening model. 3. Understand corporate finance: You have to know enough corporate finance to understand not only that the company is doing badly (which will be reflected in the stock price) but what it is doing badly. 4. Be persistent: Incumbent managers are unlikely to roll over and play dead just because you say so. They will fight (and fight dirty) to win. You have to be prepared to counter. 5. Do your homework: You have to form coalitions with other investors and to organize to create the change you are pushing for. 68
The three biggest Rs of “Value investing” Rigid: The strategies that have come to characterize a great deal of value investing reveal an astonishing faith in accounting numbers (book value) and an equally stunning lack of faith in markets getting anything right. Righteous: Value investors have convinced themselves that they are better people than other investors. Index fund investors are viewed as “academic stooges”, growth investors are considered to be “dilettantes” and momentum investors are “lemmings”. Value investors consider themselves to be the grown ups in the investing game. Ritualistic: The rituals range from the benign (claim to have read “Security Analysis” by Ben Graham and every Berkshire Hathaway annual report) to the not-so-benign… 69
Value Investing: Where’s the beef? Excess returns relative to appropriate index (based on capitalization and philosophy) If value investing is the “best way to invest”, how do we explain the fact that active growth investors beat a passive growth index fund far more frequently and by far more than active value investors do, relative to a passive value fund? 70
Growth Investing Growth at a reasonable price
Who is a growth investor? The Conventional definition: An investor who buys high price earnings ratio stocks or high price to book ratio stocks. The Generic definition: An investor who buys growth companies where the value of growth potential is being under estimated. In other words, both value and growth investors want to buy under valued stocks. The difference lies mostly in where they think they can find these bargains and what they view as their strengths. 72
The many faces of growth investing � � The Small Cap investor: The simplest form of growth investing is to buy smaller companies in terms of market cap, expecting these companies to be both high growth companies and also expecting the market to under estimate the value of growth in these companies. The IPO investor: Presumably, stocks that make initial public offerings tend to be smaller, higher growth companies. The Passive Screener: Like the passive value screener, a growth screener can use screens - low PE ratios relative to expected growth, earnings momentum - to pick stocks. The Activist Growth investor: These investors take positions in young growth companies (even before they go public) and play an active role not only in how these companies are managed but in how and when to take them public. 73
I. Small Cap Investing One of the most widely used passive growth strategies is the strategy of investing in small-cap companies. � There is substantial empirical evidence backing this strategy, though it is debatable whether the additional returns earned by this strategy are really excess returns. � 74
The Small Firm Effect 75
Small Firm Effect Over Time Figure 4: Small Firm Premium over time- 1927 -2015 100. 00% 80. 00% Best year for small cap stocks Small cap stocks have earned 0. 33% LESS than expected (given market and risk between 1981 and 2015. 40. 00% 20. 00% -20. 00% 1927 1929 1931 1933 1935 1937 1939 1941 1943 1945 1947 1949 1951 1953 1955 1957 1959 1961 1963 1965 1967 1969 1971 1973 1975 1977 1979 1981 1983 1985 1987 1989 1991 1993 1995 1997 1999 2001 2003 2005 2007 2009 2011 2013 2015 Small Firm Return - Average 60. 00% Small cap stocks did worse than large cap stocks -40. 00% Year 76
And small cap stocks may not be riskier than large cap stocks � While it is undeniable that the stock returns for individual small cap stocks are much more volatile than large market cap stocks, a portfolio of small cap stocks has a distribution that is similar to the distribution for a large cap portfolio. 77
The Global Evidence 78
Determinants of Success at Small Cap Investing The importance of discipline and diversification become even greater, if you are a small cap investor. Since small cap stocks tend to be concentrated in a few sectors, you will need a much larger portfolio to be diversified with small cap stocks. In addition, diversification should also reduce the impact of estimation risk and some information risk. When investing in small cap stocks, the responsibility for due diligence will often fall on your shoulders as an investor, since there are often no analysts following the company. You may have to go beyond the financial statements and scour other sources (local newspapers, the firm’s customers and competitors) to find relevant information about the company. Have a long time horizon. 79
The importance of a long time horizon. . 80
II. Initial Public Offerings 81
More on IPO pricing… The average initial return is 15. 8% across a sample of 13, 308 initial public offerings. However, about 15% of all initial public offerings are over priced. Initial public offerings where the offering price is revised upwards prior to the offering are more likely to be under priced than initial public offerings where the offering price is revised downwards. Offering price Number of IPOs Average initial return % of offerings underpriced Revised down 708 3. 54% 53% Revised up 642 30. 22% 95% 82
IPO underpricing in Europe. . 83
What happens after the IPO? 84
The IPO Cycle 85
Determinants of Success at IPO investing Have the valuation skills to value companies with limited information and considerable uncertainty about the future, so as to be able to identify the companies that are under or over priced. Since this is a short term strategy, often involving getting the shares at the offering price and flipping the shares on the offering date, you will have to gauge the market mood and demand for each offering, in addition to assessing its value. In other words, a shift in market mood can leave you with a large allotment of overpriced shares in an initial public offering. Play the allotment game well, asking for more shares than you want in companies which you view as severely under priced and fewer or no shares in firms that are overpriced or that are priced closer to fair value. 86
III. The Passive Screener In passive screening, you look for stocks that possess characteristics that you believe identify companies where growth is most likely to be under valued. � Typical screens may include the ratio of price earnings to growth (called the PEG ratio) and earnings growth over time (called earnings momentum) � 87
a. Earnings Growth Screens � Historical Growth: Strategies that focus on buying stocks with high historical earnings growth show no evidence of generating excess returns because Earnings growth is volatile � There is substantial mean reversion in earnings growth rates. The growth rates of all companies tend to move towards the average. � Revenue growth is more predictable than earnings growth. � � Expected Earnings Growth: Picking stocks that have high expected growth rates in earnings does not seem to yield much in terms of high returns, because the growth often is over priced. 88
Correlation in growth… 89
b. High PE Ratio Stocks 90
But there are periods when growth outperfoms value. . 91
Especially when the yield curve is flat or downward sloping. . 92
And “active” growth investing seems to beat “active” value investing… When measured against their respective indices, active growth investors seem to beat growth indices more often than active value investors beat value indices. In his paper on mutual funds in 1995, Malkiel provides additional evidence on this phenomenon. He notes that between 1981 and 1995, the average actively managed value fund outperformed the average actively managed growth fund by only 16 basis points a year, while the value index outperformed a growth index by 47 basis points a year. He attributes the 31 basis point difference to the contribution of active growth managers, relative to value managers. 93
3. PE Ratios and Expected Growth Rates Strategy 1: Buy stocks that trade at PE ratios that are less than their expected growth rates. While there is little evidence that buying stocks with PE ratios less than the expected growth rate earns excess returns, this strategy seems to have gained credence as a viable strategy among investors. It is intuitive and simple, but not necessarily a good strategy. Strategy 2: Buy stocks that trade at a low ratio of PE to expected growth rate (PEG), relative to other stocks. On the PEG ratio front, the evidence is mixed. A Morgan Stanley study found that investing in stocks with low PEG ratios did earn higher returns than the S&P 500, before adjusting for risk. 94
Buy if PE < Expected Growth rate? This strategy can be inherently dangerous. You are likely to find a lot of undervalued stocks when interest rates are high. � Even when interest rates are low, you are likely to find very risky stocks coming through this screens as undervalued. � 95
A Low PEG Ratio = undervalued? 96
But low PEG stocks tend to be risky… 97
Determinants of Success at Passive Growth Investing Superior judgments on growth prospects: Since growth is the key dimension of value in these companies, obtaining better estimates of expected growth and its value should improve your odds of success. Long Time Horizon: If your underlying strategy is sound, a long time horizon increases your chances of earning excess returns. Market Timing Skills: There are extended cycles where the growth screens work exceptionally well and other cycles where they are counter productive. If you can time these cycles, you could augment your returns substantially. Since many of these cycles are related to how the overall market is doing, this boils down to your market timing ability. 98
4. Activist Growth Investing The first are venture capital funds that trace their lineage back to the 1950 s. One of the first was American Research and Development that provided seed money for the founding of Digital Equipment. The second are leveraged buyout funds that developed during the 1980 s, using substantial amounts of debt to take over publicly traded firms and make them private firms. Private equity funds that pool the wealth of individual investors and invest in private firms that show promise. This has allowed investors to invest in private businesses without either giving up diversification or taking an active role in managing these firms. Pension funds and institutional investors, attracted by the high returns earned by investments in private firms, have also set aside portions of their overall portfolios to invest in private equity. 99
The Process of Venture Capital Investing Provoke equity investor’s interest: Its capacity to do so will depend upon the business it is in and the track record of the managers in the firm. Pricing and Return Assessment: In the venture capital method, the earnings of the private firm are forecast in a future year, when the company can be expected to go public. Multiplied by an expected earnings multiple in a future year you get the exit or terminal value. This value is discounted back to the present at a target rate of return, which measures what venture capitalists believe is a justifiable return, given the risk that they are exposed to. Structuring the Deal: You have to negotiate two factors. � � First, the private equity investor has to determine what proportion of the value of the firm he or she will demand, in return for the private equity investment. Private equity investors draw a distinction between what a firm will be worth without their capital infusion (pre-money) and what it will be worth with the infusion (post-money). Optimally, they would like their share of the firm to be based upon the premoney valuation, which will be lower. Second, the private equity investor will impose constraints on the managers of the firm in which the investment is being made. This is to ensure that the private equity investors are protected and that they have a say in how the firm is run. 100
Post-deal Management Post-deal Management: Once the private equity investment has been made in a firm, the private equity investor will often take an active role in the management of the firm. Private equity investors and venture capitalists bring not only a wealth of management experience to the process, but also contacts that can be used to raise more capital and get fresh business for the firm. Exit: There are three ways in which a private equity investor can profit from an investment in a business. � � � The first and usually the most lucrative alternative is an initial public offering made by the private firm. While venture capitalists do not usually liquidate their investments at the time of the initial public offering, they can sell at least a portion of their holdings once they are traded. The second alternative is to sell the private business to another firm; the acquiring firm might have strategic or financial reasons for the acquisition. The third alternative is to withdraw cash flows from the firm and liquidate the firm over time. This strategy would not be appropriate for a high growth firm, but it may make sense if investments made by the firm no longer earn excess returns. 101
The Payoff to Private Equity and Venture Capital Investing 102
Determinants of Success at Growth Investing Pick your companies (and managers) well: Good venture capitalists seem to have the capacity to find the combination of ideas and management that make success more likely. Diversify: The rate of failure is high among private equity investments, making it critical that you spread your bets. The earlier the stage of financing – seed money, for example – the more important it is that you diversify. Support and supplement management: Venture capitalists are also management consultants and strategic advisors to the firms that they invest in. If they do this job well, they can help the managers of these firms convert ideas into commercial success. Protect your investment as the firm grows: As the firm grows and attracts new investment, you as the venture capitalist will have to protect your share of the business from the demands of those who bring in fresh capital. Know when to get out: Having a good exit strategy seems to be as critical as having a good entrance strategy. Know how and when to get out of an investment is critical to protecting your returns. 103
Smoke and Mirrors? Charting & Technical Analysis
The Random Walk Hypothesis 105
The Basis for Price Patterns 1. Investors are not always rational in the way they set expectations. These irrationalities may lead to expectations being set too low for some assets at some times and too high for other assets at other times. Thus, the next piece of information is more likely to contain good news for the first asset and bad news for the second. 2. Price changes themselves may provide information to markets. Thus, the fact that a stock has gone up strongly the last four days may be viewed as good news by investors, making it more likely that the price will go up today then down. 106
Serial correlation measures the correlation between price changes in consecutive time periods � Measure of how much price change in any period depends upon price change over prior time period. 0: imply that price changes in consecutive time periods are uncorrelated with each other >0: evidence of price momentum in markets <0: Evidence of price reversals � 107
Serial Correlation and Excess Returns � Serial correlation measures the correlation between price changes in consecutive time periods: 0: price changes carry no information for future price changes >0: evidence of price momentum in markets <0: Evidence of price reversals � From viewpoint of investment strategy, serial correlations can be exploited to earn excess returns. A positive serial correlation would be exploited by a strategy of buying after periods with positive returns and selling after periods with negative returns. � A negative serial correlation would suggest a strategy of buying after periods with negative returns and selling after periods with positive returns. � 108
1. Serial Correlation in really short-term returns (minutes, hours) There is low or no serial correlation: The earliest studies of serial correlation all looked at large U. S. stocks and concluded that the serial correlation in stock prices was small. Other studies confirmed these findings – of very low correlation, positive or negative - not only for smaller stocks in the United States, but also for other markets. The correlation that exists has more to do with market microstructure than inefficiency � � Market liquidity effect: If markets are not liquid, you will see serial correlation in index returns. Bid-ask spread effect: The bid-ask spread creates a bias in the opposite direction, if transactions prices are used to compute returns, since prices have a equal chance of ending up at the bid or the ask price. The bounce that this induces in prices will result in negative serial correlations in returns. 109
And it is really difficult to make money off really short term correlations. . 110
Returns on Filter Rule Strategies Value of X 0. 5% 1. 0% 2. 0% 3. 0% 4. 0% 5. 0% 6. 0% 8. 0% 10. 0% 12. 0% 14. 0% 16. 0% 18. 0% 20. 0% Return with Return Strategy Trades after costs No of Buy & Hold 11. 5% 5. 5% 0. . 2% -1. 7% 0. 1% -1. 9% 1. 3% 1. 7% 3. 0% 5. 3% 3. 9% 4. 2% 3. 6% 4. 3% -103. 6% -74. 9% -45. 2% -30. 5% -19. 5% -16. 6% -9. 4% -5. 0% -1. 4% 2. 3% 2. 0% 3. 0% 10. 4% 10. 3% 10. 1% 10. 0% 9. 7% 9. 6% 9. 4% 10. 3% 10. 0% 9. 8% 12, 514 8, 660 4, 764 2, 994 2, 013 1, 484 1, 071 653 435 289 224 172 139 110 111
2. Serial correlation in the short term (days, weeks) As you move from hours and days to weeks or a month, there seems to be some evidence that prices reverse. In other words, stocks that have done well over the last month are more likely to do badly in the next one and stocks that have done badly over the last month are more likely to bounce back. The reasons given are usually rooted in market over reaction, i. e, . that the stocks that have gone up (down) the most over the most recent month are ones where markets have over reacted to good (bad) news that came out about the stock over the month. The price reversaal than reflects markets correcting themselves. 112
Returns from Momentum in short term 113
3. Serial correlation in the medium term When time is defined as many months or a year, rather than a single month, there seems to be a tendency towards positive serial correlation. Jegadeesh and Titman present evidence of what they call “price momentum” in stock prices over time periods of several months – stocks that have gone up in the last six months tend to continue to go up whereas stocks that have gone down in the last six months tend to continue to go down. Between 1945 and 2008, if you classified stocks into deciles based upon price performance over the previous year, the annual return you would have generated by buying the stocks in th the top decile and held for the next year was 16. 5% higher than the return you would have earned on the stocks in the bottom decile. 114
Annual returns from momentum classes (based upon most recent year) 115
More “evidence” on momentum Volume effect: Momentum accompanied by higher trading volume is stronger and more sustained than momentum with low trading volume. Size effect: While some of the earlier studies suggest that momentum is stronger at small market cap companies, a more recent study that looks at US stocks from 1926 to 2009 finds the relationship to be a weak one, though it does confirm that there are sub periods (1980 -1996) where momentum and firm size are correlated. Upside vs Downside: The conclusions seem to vary, depending on the time period examined, with upside momentum dominating over very long time periods (1926 -2009) and downside momentum winning out over some sub-periods (such as the 1980 -1996). Growth effect: Price momentum is more sustained and stronger for higher growth companies with higher price to book ratios than for more mature companies with lower price to book ratios. 116
4. Long Term Serial Correlation (Years) In contrast to the studies of short term correlation, there is evidence of strong correlation in long term returns. � When long term is defined as months, there is positive correlation - a momentum effect. � When long term is defined as years, there is negative correlation - reversal in prices. The effect is much stronger for smaller companies. � 117
Evidence of long term correlation 118
The tipping point… Momentum works, until it does not. . 119
Seasonal and Temporal Effects on Prices � Empirical studies indicate a variety of seasonal and temporal irregularities in stock prices. Among them are: The January Effect: Stocks, on average, tend to do much better in January than in any other month of the year. � The Weekend Effect: Stocks, on average, seem to do much worse on Mondays than on any other day of the week. � The Mid-day Swoon: Stocks, on average, tend to do much worse in the middle of the trading day than at the beginning and end of the day. � � While these empirical irregularities provide for interesting conversation, it is not clear that any of them can be exploited to earn excess returns. 120
Foundations of Technical Analysis: What are the assumptions? (1) Price is determined solely by the interaction of supply & demand (2) Supply and demand are governed by numerous factors both rational and irrational. The market continually and automatically weighs all these factors. (A random walker would have no qualms about this assumption either. He would point out that any irrational factors are just as likely to be one side of the market as on the other. ) (3) Disregarding minor fluctuations in the market, stock prices tend to move in trends which persist for an appreciable length of time. ( Random walker would disagree with this statement. For any trend to persist there has to be some collective 'irrationality') (4) Changes in trend are caused by shifts in demand supply. These shifts no matter why they occur, can be detected sooner or later in the action of the market itself. (In the financial economist's view the market (through the price) will instantaneously reflect any shifts in the demand supply. 121
I. Markets overreact: The Contrarian Indicators Basis: Research in experimental psychology suggests that people tend to overreact to unexpected and dramatic news events. Empirical evidence: If markets overreact then (1) Extreme movements in stock prices will be followed by subsequent price movements in the opposite direction. (2) The more extreme the price adjustment, the greater will be the subsequent adjustment. Technical indicators 1. Odd-lot trading: The odd-lot rule gives us an indication of what the man on the street thinks about the stock. 2. Mutual Fund Cash positions: Historically, the argument goes, mutual fund cash positions have been greatest at the bottom of a bear market and lowest at the peak of a bull market. 3. Investment Advisory opinion: This is the ratio of advisory services that are bearish 122
II. Shifts in demand supply can be detected The Lessons in Price Patterns � � Market breadth: This is a measure of the number of stocks in the market which have advanced relative to those that have declined. The broader the market, the stronger the demand. Support and resistance lines: Much maligned by value investors, support and resistance lines still have adherents. A stock that breaks through a resistance line is destined to go up, whereas one that breaks through the support line has bad days ahead of it. Moving averages: A moving average line smooths out fluctuations and enables the chartist to see trends in the stock price. Volume indicators: Some technical analysts believe that there is information about future price changes in trading volume shifts. 123
III. Market learn slowly: The Momentum Investors Basis: The argument here is that markets learn slowly. Thus, investors who are a little quicker than the market in assimilating and understanding information will earn excess returns. In addition, if markets learn slowly, there will be price drifts and technical analysis can detect these drifts and take advantage of them. The Evidence: There is evidence of price momentum over short and medium times intervals. Momentum indicators: � � Relative Strength: The relative strength of a stock is the ratio of its current price to its average over a longer period (eg. six months). Trend Lines: You look past the day-to-day movements in stock prices at the underlying long-term trends. The simplest measure of trend is a trend line. 124
IV. Following the Smart Investors � � � This approach is the flip side of the contrarian approach. Instead of assuming that investors, on average, are likely to be be wrong, you assume that they are right. To make this assumption more palatable, you do not look at all investors but only at the smartest investors, who presumably know more than the rest of us. Indicators: � � Specialists Short Sales: The assumption is that specialists have more information about future price movements than other investors. Consequently, when they sell short, they must know that the stock is overvalued. Insider buying/selling: The ratio of insider buying to selling is often tracked for stocks with the idea that insiders who are buying must have positive information about a stock whereas insiders who are selling are likely to have negative information. 125
V. Markets are controlled by external forces: The Mystics The Elliot Wave: Elliot's theory is that the market moves in waves of various sizes, from those encompassing only individual trades to those lasting centuries, perhaps longer. "By classifying these waves and counting the various classifications it is possible to determine the relative positions of the market at all times". "There can be no bull of bear markets of one, seven or nine waves, for example. The Dow Theory: " The market is always considered as having three movements, all going at the same time. The first is the narrow movement (daily fluctuations) from day to day. The second is the short swing (secondary movements) running from two weeks to a month and the third is the main movement (primary trends) covering at least four years in its duration. 126
Determinants of Success at Technical Analysis Be aware: If you decide to use a charting pattern or technical indicator, you need to be aware of the investor behavior that gives rise to its success. You can modify or abandon the indicator if the underlying behavior changes. Back test: It is important that you back-test your indicator to ensure that it delivers the returns that are promised. In running these tests, you should pay particular attention to the volatility in performance over time and how sensitive the returns are to holding periods. Timely/Cheap trading: The excess returns on many of the strategies seem to depend upon timely trading. In other words, to succeed at some of these strategies, you may need to monitor prices continuously, looking for the patterns that would trigger trading. Goldilocks timing: Building on theme of time horizons, success at charting can be very sensitive to how long you hold an investment. 127
Trading on News?
Information and Value Investors attempt to assess the value of an asset based upon the information that they have about that asset at that point in time. � At the same time, different investors will arrive at different assessments of value for the same asset � � Because the information they have is different � Because they have different ways of processing the same information � The price is determined by demand supply. 129
Information and Prices in an Efficient Market 130
A Slow Learning Market… 131
An Overreacting Market 132
I. Trading on Private Information Insiders are managers, directors or major stockholders in firms. While they are constrained from trading ahead of information releases, they can still legally buy or sell stock in their companies. Analysts operate at the nexus of private and public information. To the extent that they “know” something about the company that the rest of us do not, their recommendations should convey information to the market. One way to examine whether private information can be used to earn excess returns is to look at whether insiders and analysts earn excess returns. 133
A. Insider Trading as a Leading Indicator of Stock prices. . 134
More on insider trading… Studies since support this finding, but it is worth noting that insider buying is a noisy signal – about 4 in 10 stocks where insiders are buying turn out to be poor investments, and even on average, the excess returns earned are not very large. In a study in 1998, Lakonishok and Lee take a closer look at the price movements around insider trading. They find that firms with substantial insider selling have stock returns of 14. 4% over the subsequent 12 months, which is significantly lower than the 22. 2% earned by firms with insider buying. However, they find that the link between insider trading and subsequent returns is greatest for small companies and that there is almost no relationship at larger firms. 135
Insider trading - updated The first is that the SEC has become more expansive in its definition of what constitutes insider information (to include any material non-public information, rather than just information releases from the firm) and more aggressive in its enforcement of insider trading laws. The second is that companies, perhaps in response to the SEC’s hard line on insider trading, have adopted more stringent policies restricting insiders from trading on information. Perhaps as a consequence, the price effect of insider trading has decreased over time and one study finds that the price effect of (legal) insider trading has almost disappeared since 2002, with the adoption of Regulation Fair Disclosure (FD), which restricted selective information disclosure by companies to a few investors or analysts, and Sarbanes-Oxley, which increased scrutiny of insider trading. 136
Can you follow insiders and make money? 137
Are some insiders more inside than others? Not all insiders have equal access to information. Top managers and members of the board should be privy to much more important information and thus their trades should be more revealing. A study by Bettis, Vickrey and Vickery finds that investors who focus only on large trades made by top executives, rather than total insider trading may, in fact, be able to earn excess returns. As investment alternatives to trading on common stock have multiplied, insiders have also become more sophisticated about using these alternatives. As an outside investor, you may be able to add more value by tracking these alternative investments. Knowledge about insider trading is more useful in some companies than in others. Insider buying or selling is likely to contain less information (and thus be less useful to investors) in companies where information is plentiful (both because of disclosure by the company and analysts following the company) and easy to assess. 138
Illegal Insider Trading: Is it profitable? When insiders are caught trading illegally, they almost invariably have made a killing on their investment. Clearly, some insiders made significant returns off their privileged positions. Almost all major news announcements made by firms are preceded by a price runup (if it is good news) or a price drop (if it is bad news). While this may indicate a very prescient market, it is much more likely that someone with access to the privileged information (either at the firm or the intermediaries helping the firm) is using the information to trade ahead of the news. In fact, the other indicator of insider trading is the surge in trading volume in both the stock itself and derivatives prior to big news announcements. In addition to having access to information, insiders are often in a position to time the release of relevant information to financial markets. One study find that insiders sell stock between 3 and 9 quarters before their firms report a break in consecutive earnings increases. They also find, for instance, that insider selling increases at growth firms prior to periods of declining earnings. 139
B. Analysts have access to public information and to the managers of the firm (and thus to private information). � Analysts make earnings forecasts for firms (and revise them) and recommendations on buy and sell. � 140
Who do analysts follow? 141
Determinants of analyst following… Market Capitalization: The larger the market capitalization of a firm, the more likely it is to be followed by analysts. Institutional Holding: The greater the percent of a firm’s stock that is held by institutions, the more likely it is to be followed by analysts. The open question, though, is whether analysts follow institutions or whether institutions follow analysts. Given that institutional investors are the biggest clients of equity research analysts, the causality probably runs both ways. Trading Volume: Analysts are more likely to follow liquid stocks. Here again, though, it is worth noting that the presence of analysts and buy (or sell) recommendations on a stock may play a role in increasing trading volume. 142
I. Earnings Forecasts Analysts spend a considerable amount of time estimating the earnings per share that companies will report in the next quarter. They also provide forecasts of earnings further out - up to 5 years. � Analysts also constantly update these forecasts as new information comes out. To the extent that there is information in these revisions, stock prices should react. � 143
Information in Earnings Forecasts 1. 2. 3. 4. 5. Firm-specific information that has been made public since the last earnings report: Analysts can use information that has come out about the firm since the last earnings report, to make predictions about future growth. Macro-economic information that may impact future growth : Analysts can update their projections of future growth as new information comes out about the overall economy and about changes in fiscal and monetary policy. Information revealed by competitors on future prospects: Analysts can also condition their growth estimates for a firm on information revealed by competitors on pricing policy and future growth. Private information about the firm: Analysts sometimes have access to private information about the firms they follow which may be relevant in forecasting future growth. Public information other than earnings: It has been shown, for instance, that other financial variables such as earnings retention, profit margins and asset turnover are useful in predicting future growth. Analysts can incorporate information from these variables into their forecasts. 144
The Quality of Earnings Forecasts The general consensus from studies that have looked at short-term forecasts (one quarter ahead to four quarters ahead) of earnings is that analysts provide better forecasts of earnings than models that depend purely upon historical data. The mean relative absolute error, which measures the absolute difference between the actual earnings and the forecast for the next quarter, in percentage terms, is smaller for analyst forecasts than it is forecasts based upon historical data. A study in 1978 measured the squared forecast errors by month of the year and computed the ratio of analyst forecast error to the forecast error from time-series models of earnings. It found that the time series models actually outperform analyst forecasts from April until August, but underperform them from September through January. The other study by O'Brien (1988) found that analyst forecasts outperform the time series model for one-quarter ahead and two-quarter ahead forecasts, do as well as the time series model for three-quarter ahead forecasts and do worse than the time series model for four-quarter ahead forecasts. 145
How about long term forecasts? There is little evidence to suggest that analysts provide superior forecasts of earnings when the forecasts are over three or five years. An early study by Cragg and Malkiel compared long-term forecasts by five investment management firms in 1962 and 1963 with actual growth over the following three years to conclude that analysts were poor long term forecasters. This view was contested in 1988 by Vander Weide and Carleton who found that the consensus prediction of five -year growth in the I/B/E/S was superior to historically oriented growth measures in predicting future growth. 146
Potential Pitfalls and possible use… The limitation of an earnings momentum strategy is its dependence on two of the weakest links in financial markets –earnings reports that come from firms (where accounting games skew earnings)and analyst forecasts of these earnings (which are often biased). To the extent that analysts influence trades made by their clients, they are likely to affect prices when they revise earnings. The more influential they are, the greater the effect they will have on prices, but the question is whether the effect is lasting. It is a short-term strategy that yields fairly small excess returns over investment horizons ranging from a few weeks to a few months. One way you may be able to earn higher returns from this strategy is to identify key analysts and build an investment strategy around forecast revisions made by them, rather than looking at consensus estimates made by all analysts. While forecast revisions and earnings surprises by themselves are unlikely to generate lucrative portfolios, they can augment other more long-term screening strategies. 147
II. Recommendations: Some background 148
Market Reaction… 149
Tempered by fears of bias… 150
Using Analyst Recommendations… 1. 2. 3. 4. Identify the analysts who are not only the most influential but also have the most content (private information. Recommendations backed up by numbers and a solid story have more heft to them. Screen out analysts where the potential conflicts of interest are too large for the recommendations to be unbiased. You should invest based upon the recommendations, preferably at the time the recommendations are made. Assuming that you still attach credence to the views of the recommending analysts, you should watch analysts for signals that they have changed or are changing their minds. 151
II. Trading on Public Information There is substantial information that comes out about stocks. Some of the information comes from the firm - earnings and dividend announcements, acquisitions and other news - and some comes from competitors. � Prices generally react to this information. � 152
A. Earnings Announcements Every quarter (in the U. S) and less frequently elsewhere, firms report their earnings for the most recent period. When firms make earnings announcements, they convey information to financial markets about their current and future prospects. The magnitude of the information, and the size of the market reaction, should depend upon how much the earnings report exceeds or falls short of investor expectations. In an efficient market, there should be an instantaneous reaction to the earnings report, if it contains surprising information, and prices should increase following positive surprises and down following negative surprises. 153
Market Reaction to Earnings Reports 154
The post-announcement drift? 155
By day of the week. . 156
The Consequence of Delays… 157
The Intraday reaction. . 158
And earnings quality matters… As firms play the earnings game, the quality of earnings has also diverged across companies. A firm that beats earnings estimates because it has more efficient operating should be viewed more favorably than one that beats estimates because it changed the way it valued inventory. Chan, Jegadeesh and Lakonishok examined firms that reported high accruals – i. e. the difference between accounting earnings and cash flows and argued that firms report high earnings without a matching increase in cashflow have poorer quality earnings. When they tracked a portfolio composed of these firms, they discovered that the high accrual year was usually the turning point in the fortunes of this firm, with subsequent years bring declining earnings and negative stock returns. 159
Can you make money of earnings announcements? One strategy is to buy stocks that report large positive earnings surprises, hoping to benefit from the drift. The evidence indicates that across all stocks, the potential for excess returns from buying after earnings announcements is very small. You can concentrate only on earnings announcements made by smaller, less liquid companies where the drift is more pronounced. In addition, you can try to direct your money towards companies with higher quality earnings surprises by avoiding firms with large accruals. Your biggest payoff is in investing in companies before large positive earnings surprises. You may be able to use a combination of quantitative techniques (time series models that forecast next quarter’s earnings based upon historical earnings) and trading volume (insiders do create blips in the volume) to try to detect these firms. Even if you are right only 55% of the time, you should be able to post high excess returns. 160
B. Acquisitions 161
Across different types of acquisitions… 162
The Effect on Acquirers. . Jensen and Ruback report excess returns of 4% for bidding firm stockholders around tender offers and no excess returns around mergers. Jarrell, Brickley and Netter, in their examination of tender offers from 1962 to 1985, note a decline in excess returns to bidding firm stockholders from 4. 4% in the 1960 s to 2% in the 1970 s to -1% in the 1980 s. Other studies indicate that approximately half of all bidding firms earn negative excess returns around the announcement of takeovers, suggesting that shareholders are skeptical about the perceived value of the takeover in a significant number of cases. 163
After the acquisition… Operating Evidence Mc. Kinsey and Co. examined 58 acquisition programs between 1972 and 1983 for evidence on two questions: (1) Did the return on the amount invested in the acquisitions exceed the cost of capital? (2) Did the acquisitions help the parent companies outperform the competition? They concluded that 28 of the 58 programs failed both tests, and six failed at least one test. In a follow-up study of 115 mergers in the U. K. and the U. S. in the 1990 s, Mc. Kinsey concluded that 60% of the transactions earned returns on capital less than the cost of capital, and that only 23% earned excess returns. In 1999, KPMG examined 700 of the most expensive deals between 1996 and 1998 and concluded that only 17% created value for the combined firm, 30% were value neutral and 53% destroyed value. 164
After the acquisition… Divestitures The most damaging piece of evidence on the outcome of acquisitions is the large number of acquisitions that are reversed within fairly short time periods. Mitchell and Lehn note that 20. 2% of the acquisitions made between 1982 and 1986 were divested by 1988. In a study published in 1992, Kaplan and Weisbach found that 44% of the mergers they studied were reversed, largely because the acquirer paid too much or because the operations of the two firms did not mesh. Studies that have tracked acquisitions for longer time periods (ten years or more) have found the divestiture rate of acquisitions rises to almost 50%, suggesting that few firms enjoy the promised benefits from acquisitions do not occur. In another study, 165
Takeover based investment strategies � � � The first and most lucrative, if you can pull it off, is to find a way (legally) to invest in a target firm before the acquisition is announced. The second is to wait until after the takeover is announced and then try to take advantage of the price drift between the announcement date and the day the deal is consummated. This is often called risk arbitrage. The third is also a post-announcement strategy, but it is a long-term strategy where you invest in firms that you believe have the pieces in place to deliver the promised synergy or value creation. 166
Preannouncement Trading Research indicates that the typical target firm in a hostile takeover has the following characteristics: � � It has under performed other stocks in its industry and the overall market, in terms of returns to its stockholders in the years preceding the takeover. It has been less profitable than firms in its industry in the years preceding the takeover. It has a much lower stock holding by insiders than do firms in its peer groups. It has a low price to book ratio & a low ratio of value to replacement cost. There are two ways in which we can use the findings of these studies to identify potential target firms. � � Develop a set of screens that incorporate the variables mentioned above. You could, for instance, invest in firms with market capitalizations below $ 5 billion, with low insider holdings, depressed valuations (low price to book ratios) and low returns on equity. The second and slightly more sophisticated variant is to estimate the probability of being taken over for every firm in the market using statistical techniques 167
Post-Announcement Trading In this strategy, you buy companies after acquisitions or mergers are completed because you believe that they will be able to deliver what they promise at the time of the merger – higher earnings growth and synergy. The likelihood of success seems to be greater In hostile acquisitions, where the management is replaced. � In mergers of like businesses than in conglomerate mergers � In cost-saving mergers than in growth-oriented mergers � In mergers where plans for synergy are made before the merger � In acquisitions of small companies by larger companies (as opposed to mergers of equals) � 168
C. Stock Splits 169
D. Dividend Changes 170
Have dividends become less informative? 171
Implementing an Information Based Strategy: Determinants of Success n n Identify the information around which your strategy will be built: Since you have to trade on the announcement, it is critical that you determine in advance the information that will trigger a trade. Invest in an information system that will deliver the information to you instantaneous: Many individual investors receive information with a time lag – 15 to 20 minutes after it reaches the trading floor and institutional investors. While this may not seem like a lot of time, the biggest price changes after information announcements occur during these periods. Execute quickly: Getting an earnings report or an acquisition announcement in real time is of little use if it takes you 20 minutes to trade. Immediate execution of trades is essential to succeeding with this strategy. Keep a tight lid on transactions costs: Speedy execution of trades usually goes with higher transactions costs, but these transactions costs can very easily wipe out any potential you may see for excess returns). Know when to sell: Almost as critical as knowing when to buy is knowing when to sell, since the price effects of news releases may begin to fade or even reverse after a while. 172
In closing. . If you can trade on private information, you can get ahead of market movements. Unfortunately, trading on private information is usually illegal. You can trade on information after it has been made public, taking advantage of systematic errors that markets make in how they react. If markets overreact, you will buy after bad news and sell after good news. If markets under react, you will buy after good news and sell after bad news. The evidence suggests that there is some price drift after news announcements, suggesting a slow learning market. The drift is small and you have to react quickly and have low transactions cost to earn excess returns. 173
Active Investor: To be or not to be?
The Greatest Disruption in History. . 175
And it is accelerating. . 176
The best ad for passive investing. . 177
Excuses, excuses. . The Collective: The truth is that if this study is done right, active investing collectively can never beat the market. In fact, active investors have to collective under perform the market by roughly their transactions costs/management fees. The Sub Group: Some sub-groups outperform the market and I belong to that sub-group. The Personal: I beat the market. It is the other guys who are the suckers. 178
a. The Collective: It’s a losers’ game Active versus Passive: During 2015, for instance, about 40% of money was invested in index funds and ETFs and about 60% in active investing of all types. The Active Share: The money invested in index funds and ETFs will track the index, with a very small percentage (about 0. 11%) going to cover the minimal transactions costs. Thus, active money managers have to start off with the acceptance that they will collectively cannot beat the index and that their costs will have to come out of these returns. The Outcome: Not surprisingly, therefore, active investors will collectively generate about 1% less than the index during every period and more than half will underperform the index. 179
b. Across Styles % of US Mutual Funds that beat their respective indices Value Growth Core All Large 82. 17% 86. 54% 88. 26% 84. 15% Mid-cap 70. 27% 81. 48% 76. 51% 76. 69% Small 92. 31% 91. 89% 91. 44% 90. 13% All Equity 88. 43% Real Estate 82. 64% S&P computes these percentages for the last year, the last 3 years & the last 10 years. There is not a single period or a single fund grouping where the number is <50%. 180
Across Countries Country Australia Europe Japan US Country Brazil Chile Mexico India Emerging South Africa One Year 59. 68% 31. 94% 46. 36% 74. 81% One Year 48. 02% 88. 37% 67. 35% 35. 79% 46. 45% 50. 63% Developed Markets Three Years Five Years 65. 69% 88. 43% 63. 77% 80. 63% 58. 20% 59. 33% 80. 85% 88. 43% Emerging Markets Three Years Five Years 70. 63% 72. 00% 83. 72% 93. 33% 63. 83% 76. 19% 46. 79% 56. 52% 59. 54% 54. 61% 63. 36% 74. 58% 181
c. The Winners don’t stay winning. . 182
And the ”smart” money does not stay smart for very long 183
The Roots of Active Investing Failure. . No core investment philosophy: Most active money managers have no core philosophy but instead think of investing in terms of strategies. This leads to � � Me-tooism: If your strategy does not work, you look at others who seem to be making money and imitate their strategies. This strategyswitching increases costs further. Survival investing: Many active money managers know that as long as they stay within shouting distance of their index benchmarks, they will not get fired. That leads to many active funds becoming quasi index funds. High Cost Structure: Weaned on a cost-plus system, the cost structures of many active investors are bloated with administrative costs that create no perceptible benefits. This absence of concern about costs also finds its way into how funds get run (in terms of transactions costs). 184
Should you be an active investor? If you are an individual investor, that judgment is yours to make and will depend upon what you bring to the table in terms of competitive advantages and how you plan to use them to create value from your activity. In the process, it is important that you � � a) b) c) d) Be honest with yourself about both your successes and failures. Recognize that there is no guarantee of investment heaven even if you follow every investment commandment. Here is my test. Assume that you have been an active investor all your life and that you are told on your death bed that your actively managed portfolio delivered 0. 5% less than you would have earned if you left your money in index funds for your entire lifetime. Which of the following would be your reaction? Rage at an Investment God that would allow this to happen Anger at yourself for having wasted so much of your life picking stocks Disbelief in the numbers and a demand that they be recomputed Serenity 185