
Investment and Economic Outlook Jeffrey Mortimer CFA Director
- Slides: 15
Investment and Economic Outlook Jeffrey Mortimer, CFA Director of Investment Strategy May 2018
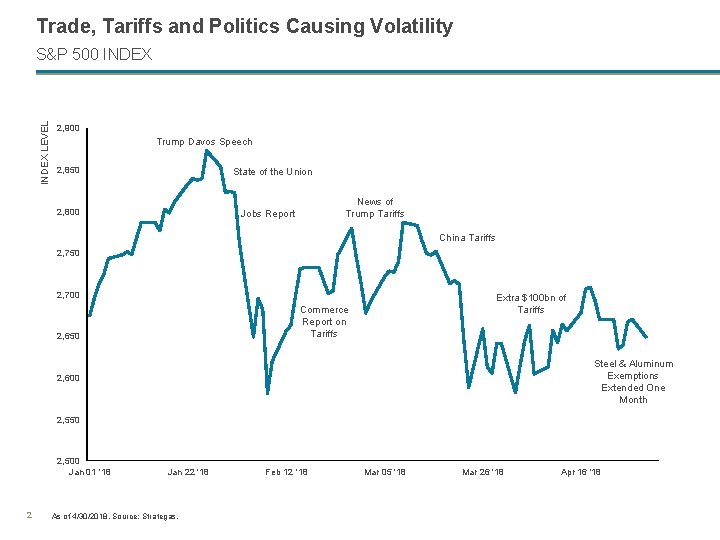
Trade, Tariffs and Politics Causing Volatility INDEX LEVEL S&P 500 INDEX 2, 900 Trump Davos Speech 2, 850 State of the Union 2, 800 News of Trump Tariffs Jobs Report China Tariffs 2, 750 2, 700 Extra $100 bn of Tariffs Commerce Report on Tariffs 2, 650 Steel & Aluminum Exemptions Extended One Month 2, 600 2, 550 2, 500 Jan 01 '18 2 Jan 22 '18 As of 4/30/2018. Source: Strategas. Feb 12 '18 Mar 05 '18 Mar 26 '18 Apr 16 '18
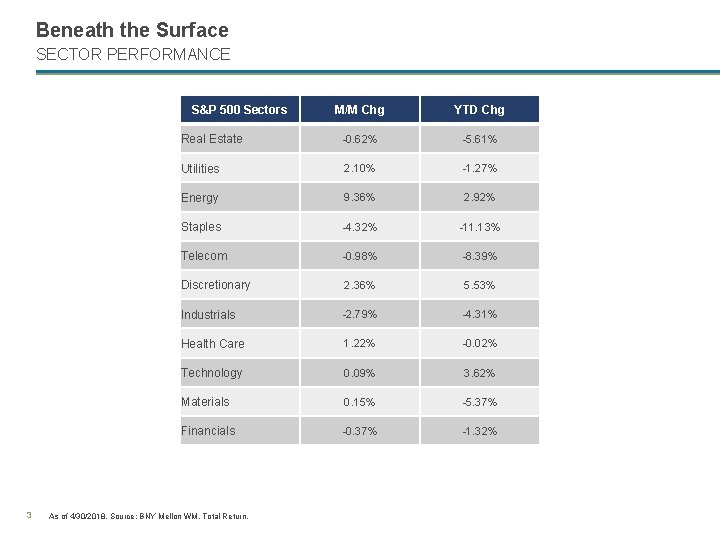
Beneath the Surface SECTOR PERFORMANCE S&P 500 Sectors 3 M/M Chg YTD Chg Real Estate -0. 62% -5. 61% Utilities 2. 10% -1. 27% Energy 9. 36% 2. 92% Staples -4. 32% -11. 13% Telecom -0. 98% -8. 39% Discretionary 2. 36% 5. 53% Industrials -2. 79% -4. 31% Health Care 1. 22% -0. 02% Technology 0. 09% 3. 62% Materials 0. 15% -5. 37% Financials -0. 37% -1. 32% As of 4/30/2018. Source: BNY Mellon WM. Total Return.
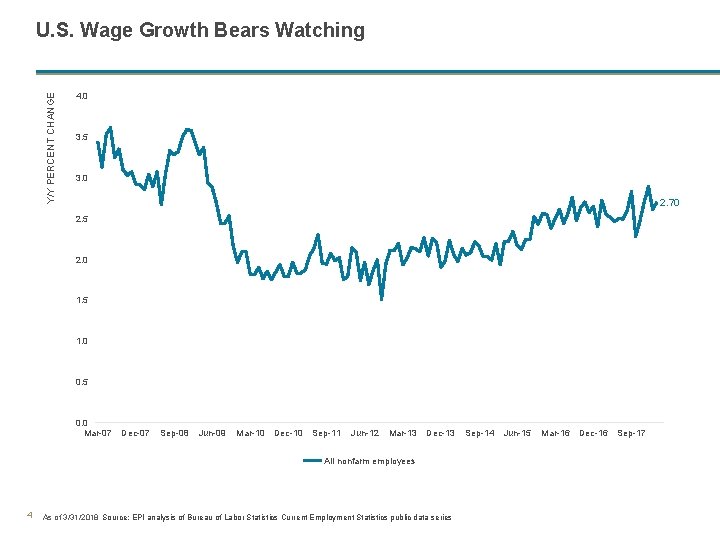
Y/Y PERCENT CHANGE U. S. Wage Growth Bears Watching 4. 0 3. 5 3. 0 2. 70 2. 5 2. 0 1. 5 1. 0 0. 5 0. 0 Mar-07 Dec-07 Sep-08 Jun-09 Mar-10 Dec-10 Sep-11 Jun-12 Mar-13 Dec-13 All nonfarm employees 4 As of 3/31/2018 Source: EPI analysis of Bureau of Labor Statistics Current Employment Statistics public data series Sep-14 Jun-15 Mar-16 Dec-16 Sep-17
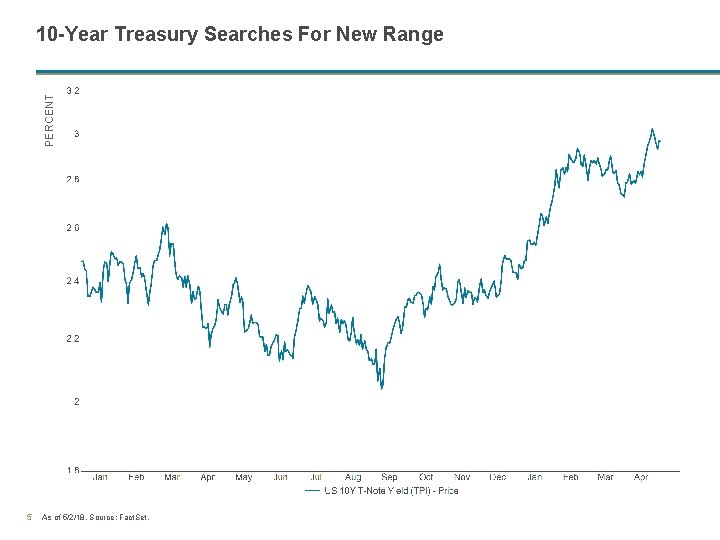
PERCENT 10 -Year Treasury Searches For New Range 5 As of 5/2/18. Source: Fact. Set.
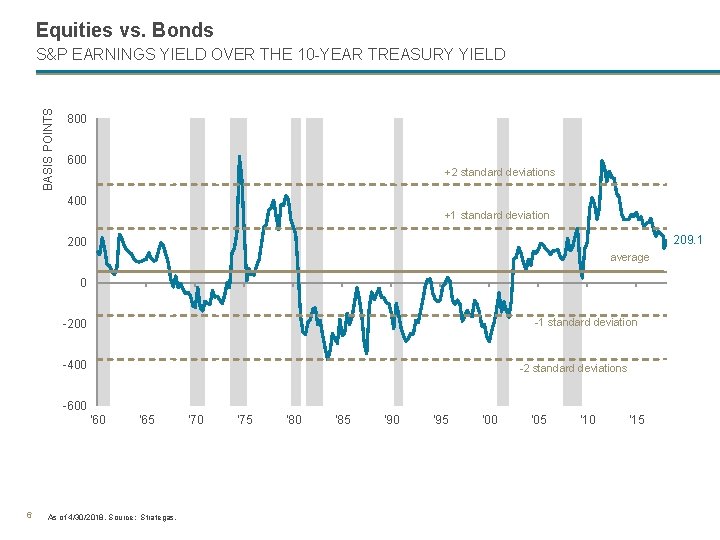
Equities vs. Bonds BASIS POINTS S&P EARNINGS YIELD OVER THE 10 -YEAR TREASURY YIELD 800 600 +2 standard deviations 400 +1 standard deviation 209. 1 200 average 0 -1 standard deviation -200 -400 -2 standard deviations -600 '60 6 '65 As of 4/30/2018. Source: Strategas. '70 '75 '80 '85 '90 '95 '00 '05 '10 '15
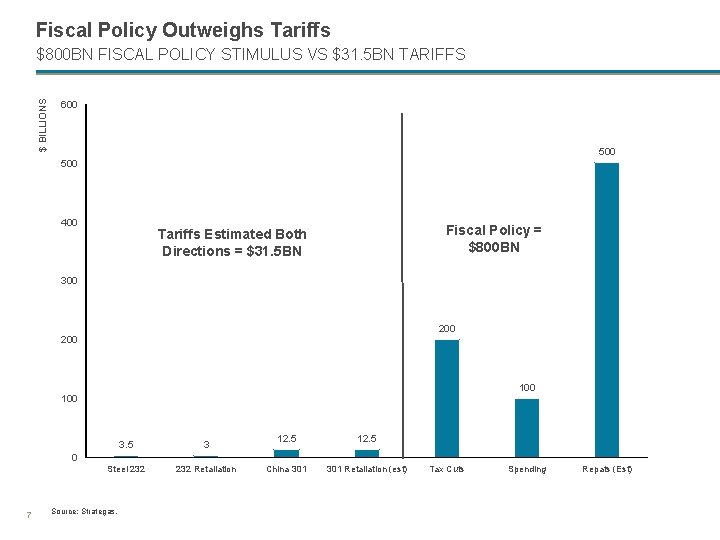
Fiscal Policy Outweighs Tariffs $ BILLIONS $800 BN FISCAL POLICY STIMULUS VS $31. 5 BN TARIFFS 600 500 400 Fiscal Policy = $800 BN Tariffs Estimated Both Directions = $31. 5 BN 300 200 100 3. 5 3 Steel 232 Retaliation 12. 5 China 301 Retaliation (est) 0 7 Source: Strategas. Tax Cuts Spending Repats (Est)
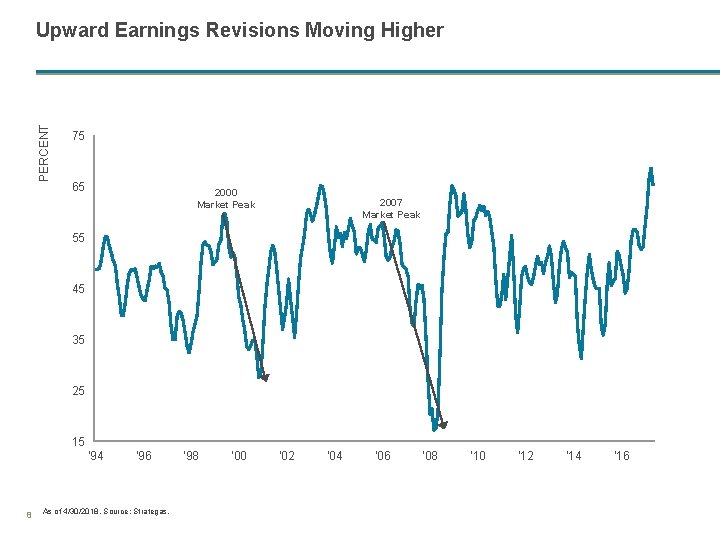
PERCENT Upward Earnings Revisions Moving Higher 75 65 2000 Market Peak 2007 Market Peak 55 45 35 25 15 '94 8 '96 As of 4/30/2018. Source: Strategas. '98 '00 '02 '04 '06 '08 '10 '12 '14 '16
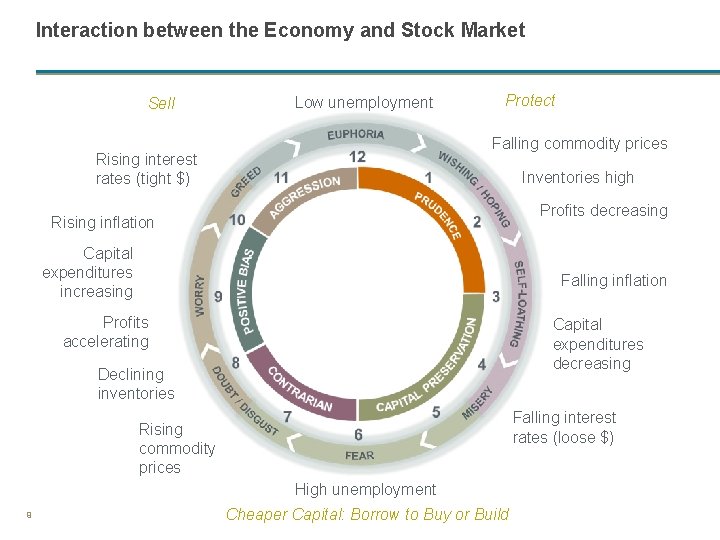
Interaction between the Economy and Stock Market Sell Low unemployment Protect Falling commodity prices Rising interest rates (tight $) Inventories high Profits decreasing Rising inflation Capital expenditures increasing Falling inflation Profits accelerating Capital expenditures decreasing Declining inventories Falling interest rates (loose $) Rising commodity prices High unemployment 9 Cheaper Capital: Borrow to Buy or Build
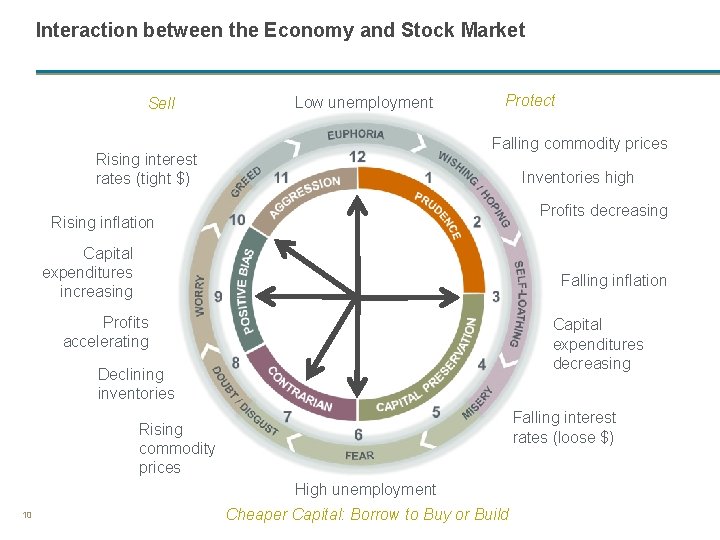
Interaction between the Economy and Stock Market Sell Low unemployment Protect Falling commodity prices Rising interest rates (tight $) Inventories high Profits decreasing Rising inflation Capital expenditures increasing Falling inflation Profits accelerating Capital expenditures decreasing Declining inventories Falling interest rates (loose $) Rising commodity prices High unemployment 10 Cheaper Capital: Borrow to Buy or Build
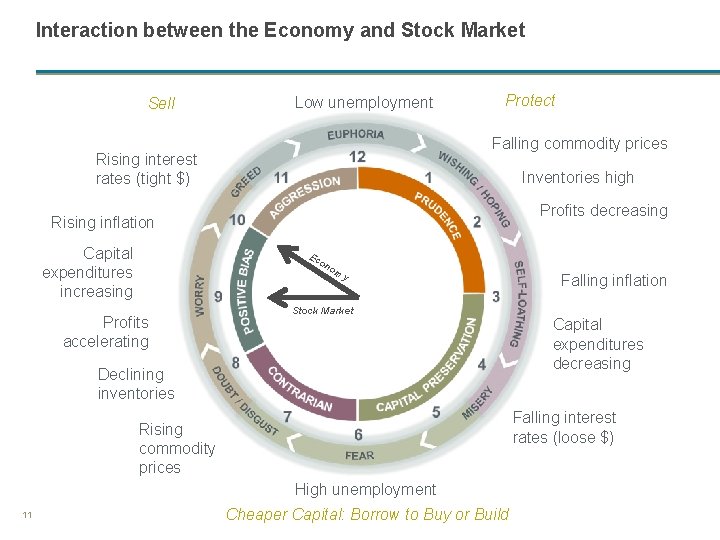
Interaction between the Economy and Stock Market Sell Low unemployment Protect Falling commodity prices Rising interest rates (tight $) Inventories high Profits decreasing Rising inflation Capital expenditures increasing Ec on Profits accelerating om y Stock Market Declining inventories Capital expenditures decreasing Falling interest rates (loose $) Rising commodity prices High unemployment 11 Falling inflation Cheaper Capital: Borrow to Buy or Build
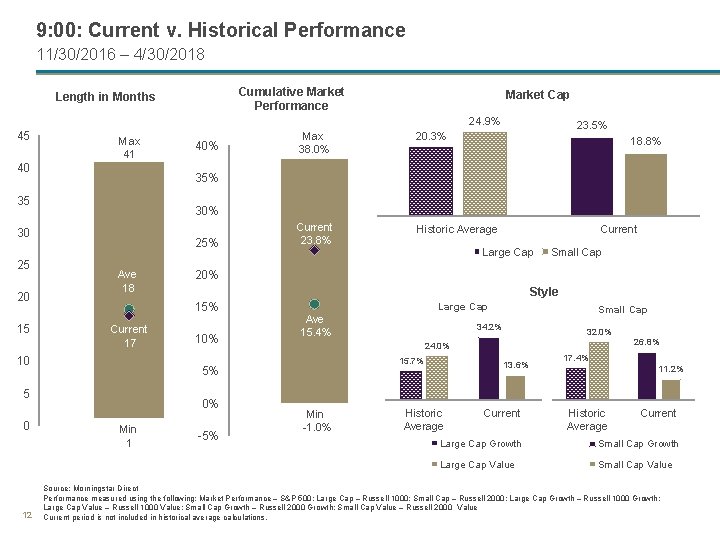
9: 00: Current v. Historical Performance 11/30/2016 – 4/30/2018 Cumulative Market Performance Length in Months Market Cap 24. 9% 45 Max 41 40 15 25% Ave 18 Current 17 10% 0% Min 1 Current Large Cap Small Cap Style Large Cap Ave 15. 4% -5% Small Cap 34. 2% 32. 0% 24. 0% 15. 7% 5% 5 12 Historic Average 18. 8% 20% 15% 10 0 Current 23. 8% 23. 5% 30 20 20. 3% 35 25 40% Max 38. 0% Min -1. 0% 13. 6% Historic Average Current 26. 8% 17. 4% 11. 2% Historic Average Current Large Cap Growth Small Cap Growth Large Cap Value Small Cap Value Source: Morningstar Direct Performance measured using the following: Market Performance – S&P 500; Large Cap – Russell 1000; Small Cap – Russell 2000; Large Cap Growth – Russell 1000 Growth; Large Cap Value – Russell 1000 Value; Small Cap Growth – Russell 2000 Growth; Small Cap Value – Russell 2000 Value Current period is not included in historical average calculations.
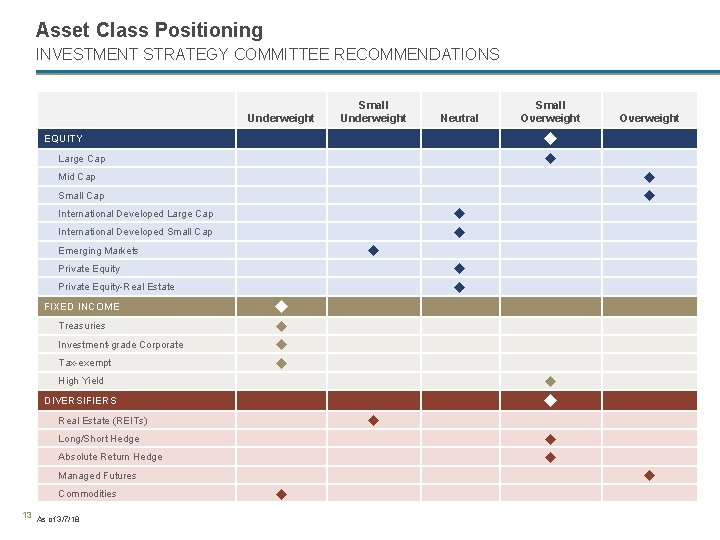
Asset Class Positioning INVESTMENT STRATEGY COMMITTEE RECOMMENDATIONS Underweight Small Underweight Neutral Small Overweight u EQUITY u Large Cap u u Mid Cap Small Cap u u International Developed Large Cap International Developed Small Cap u Emerging Markets u u Private Equity-Real Estate FIXED INCOME u Treasuries u u u Investment-grade Corporate Tax-exempt High Yield u DIVERSIFIERS u u Real Estate (REITs) u u Long/Short Hedge Absolute Return Hedge u Managed Futures Commodities 13 As of 3/7/18 Overweight u
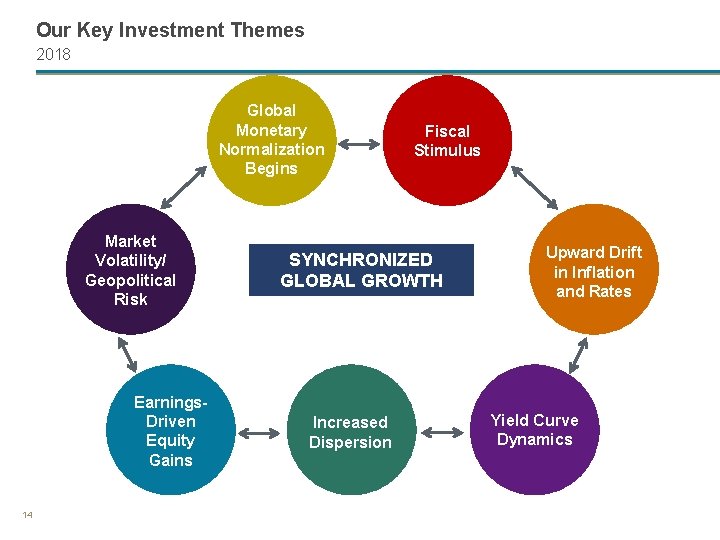
Our Key Investment Themes 2018 Global Monetary Normalization Begins Market Volatility/ Geopolitical Risk Earnings. Driven Equity Gains 14 Fiscal Stimulus SYNCHRONIZED GLOBAL GROWTH Increased Dispersion Upward Drift in Inflation and Rates Yield Curve Dynamics
Disclosure The information provided is for illustrative/educational purposes only. All investment strategies referenced in this material come with investment risks, including loss of value and/or loss of anticipated income. Past performance does not guarantee future results. No investment strategy or risk management technique can guarantee returns in any market environment. This material is not intended to constitute legal, tax, investment or financial advice. Effort has been made to ensure that the material presented herein is accurate at the time of publication. However, this material is not intended to be a full and exhaustive explanation of the law in any area or of all of the tax, investment or financial options available. The information discussed herein may not be applicable to or appropriate for every investor and should be used only after consultation with professionals who have reviewed your specific situation. BNY Mellon Wealth Management may refer clients to certain of its affiliated offering expertise, products and services which may be of interest to the client. Use of an affiliate after such a referral remains the sole decision of the client. Strategic Architecture is a service mark owned by The Bank of New York Mellon Corporation BNY Mellon Wealth Management conducts business through various operating subsidiaries of The Bank of New York Mellon Corporation. © 2018 The Bank of New York Mellon Corporation. All rights reserved. M 151157