Investment Analysis and Portfolio management Lecture 28 Course


")


 1. This model is used to calculate the required")

 Systematic risk in securities Systematic risk is risk that")


 of a security The systematic risk for an individual security")


- Slides: 29
Investment Analysis and Portfolio management Lecture: 28 Course Code: MBF 702
Outline • RECAP • CHOOSING AN INVESTMENT PORTFOLIO • To understand the capital asset pricing model and its uses in financial management • SYSTEMATIC AND UNSYSTEMATIC RISK • To apply the adjusted present value approach to decision making.
Choosing an investment portfolio • • Investor preferences Efficient portfolios and the efficient frontier The market portfolio Risk-free investments and choosing an investment portfolio The market premium The beta factor of a portfolio Systematic and unsystematic risk
Choosing an investment portfolio Risk-free investments and choosing an investment portfolio A stock market will have some risk-free investments. These are investments with no investment risk. In practice, government bonds denominated in the domestic currency are classified as risk-free investments. If a portfolio of risk-free investments is shown on a graph with the efficient frontier of portfolios and the market portfolio, it will be shown as a point on the y axis, where risk is zero. This is shown as Portfolio G in the graph below.
Choosing an investment portfolio
Choosing an investment portfolio The market portfolio does not include risk-free investments. Investors, however, may choose a portfolio consisting partly of the market portfolio and partly of riskfree investments. A straight line can be drawn from the portfolio that is 100% risk-free (Portfolio G) to touch the efficient frontier at a tangent. This will be at the market portfolio M. An investor can select any portfolio on this line, such as Portfolio P, to provide a mixture of risk-free investments and the market portfolio investments. The line that joins Portfolio G and the market portfolio M is called the capital market line. The capital market line (CML) shows all combinations of risk-free investments and market portfolio investments that investors may select.
Choosing an investment portfolio (Note: The CML extends beyond Portfolio M. Portfolios on this part of the CML are created when an investor uses all his own money and in addition borrows additional funds (at the risk-free rate of interest) to invest in market portfolio investments. This point is not important. ) The market premium If an investor invests in a portfolio of risk-free assets, he will receive the riskfree rate of return, which is the interest yield on those risk-free assets. To compensate an investor for investing in the market portfolio, the expected return must be higher than on risk-free investments. The market premium is the difference between the expected return on the market portfolio and a portfolio of risk-free investments.
Choosing an investment portfolio Market premium = Rm – Rf where: Rm is the market rate of return (the expected return on the market portfolio) Rf is the risk-free rate of return.
Choosing an investment portfolio The beta factor of a portfolio Any other portfolio on the capital market line must offer an expected return in excess of the risk-free rate. In the previous diagram, the expected return from Portfolio P can be stated as a formula: Expected return from Portfolio P: Rp = Rf + β(Rm – Rf) where: Rf is the expected return from Portfolio P β is a factor that represents the slope of the capital market line (and the element of risk in the portfolio compared with the risk in the market portfolio). It is called the beta factor.
Beta factors are explained in more detail later, in the section on the capital asset pricing model. At this stage, it is sufficient to note the following points: • • A beta factor can be calculated for every portfolio on the capital market line. The market portfolio has a beta factor of 1. Rm = Rf + 1(Rm – Rf) A portfolio of risk-free investments has a beta factor of 0. Rf = Rf + 0(Rm – Rf) A portfolio on the capital market line consisting of 50% market portfolio investments and 50% risk-free investments has a beta factor of 0. 5 [= (50% × 1) + (50% × 0)].
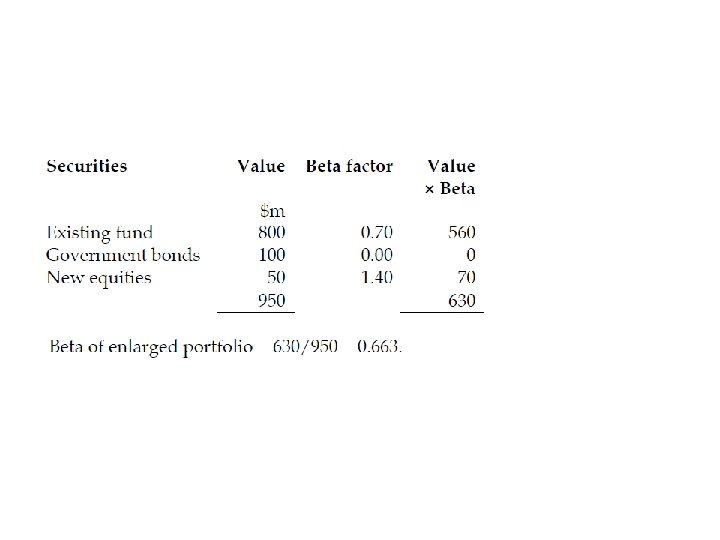
A beta factor can also be calculated for individual securities (shares or corporate bonds) in the market portfolio. The beta factor of a portfolio of securities is simply the weighted average of the beta factors of all the securities in the portfolio, with weightings to allow for the different market value of each security in the portfolio. Example A pension fund is adding two new investments to the portfolio of investments in its fund. The existing pension fund consists of securities with a market value of $800 million. These have a combined beta factor of 0. 70.
It is now adding an investment of $100 million in domestic government bonds and an investment if $50 million in equity shares that have a beta factor of 1. 4. Required Calculate the beta factor of the enlarged portfolio after the addition of the two new investments. Answer The government bonds are risk-free and have a beta factor of 0.
It was stated earlier that investors can reduce their investment risk by diversifying. However, not all risk can be eliminated, and there will be some risk that cannot be eliminated by diversification. • When the economy is weak and in recession, returns from the market as whole are likely to fall. Diversification will not protect investors against falling returns from the market as a whole • Similarly, when the economy is strong, returns from the market as a whole are likely to rise. Investors in all or most shares in the market will benefit from the general increase in returns.
Choosing an investment portfolio Therefore there are two types of risk: Systematic and unsystematic risk Unsystematic risk, which is risk that is unique to individual investments or securities, that can be eliminated through diversification. Systematic risk, or market risk. This is risk that cannot be diversified away, because it is risk that affects the market as a whole, and all investments in the market in the same way.
Implications of systematic and unsystematic risk for portfolio investment The distinction between systematic risk and unsystematic risk has important implications for investment. • Investors expect a return on their investment that is higher than the riskfree rate of return (unless they invest 100% in risk-free investments). • The higher expected return is to compensate investors for the higher investment risk. • By diversifying, and investing in a wide range of different securities, investors can eliminate unsystematic risk. This is because if some investments in the portfolio perform much worse than expected, others will perform much better. The good-performing and poor-performing investments ‘cancel each other out’.
• In a well-diversified portfolio, the unsystematic risk is therefore zero. Investors should therefore not require any additional return to compensate them for unsystematic risk. • The only risk for which investors should want a higher return is systematic risk. This is the risk that the market as a whole will perform worse or better than expected. In the earlier diagrams showing the efficient frontier of portfolios and the capital market line, the risk measurement for portfolios on the efficient frontier and the capital market line is systematic risk only.
Outline • To understand the capital asset pricing model and its uses in financial management; • To apply the adjusted present value approach to decision making. • SYSTEMATIC AND UNSYSTEMATIC RISK
Capital asset pricing model (CAPM) 1. This model is used to calculate the required return of a security / minimum return of a security / Project return ( R ) or the company (Ke) 2. It assumes a liner relationship between risk & return 3. In portfolio theory the total risk σ of a security is considered However in CAPM model only the systematic risk is considered on the grounds that the investor may reduce or completely eliminate the unsystematic risk by way of diversification Concepts that are used in portfolio theory can be applied to an analysis of risk in individual securities, such as the shares of individual companies. The CAPM establishes a relationship between investment risk and expected return for individual securities.
C A P M
Capital asset pricing model (CAPM) Systematic risk in securities Systematic risk is risk that cannot be eliminated by diversifying. Every individual security, with the exception of risk-free securities, has some systematic risk. Since investors can eliminate unsystematic risk through diversification in a portfolio, their only concern should be with the systematic risk of the securities they hold in their portfolio. The return that they expect to receive should be based on their assessment of systematic risk, rather than total risk (systematic + unsystematic risk) in the security. The systematic risk of a security can be compared with the systematic risk in the market portfolio as a whole.
A security might have a higher systematic risk than the market portfolio. This means that when the average market return rises, due perhaps to growth in the economy, the return from the security should rise by an even larger amount. Similarly, if the average market return falls due to a deterioration in business conditions, the return from the security will fall by an even larger amount. • A security might have a lower systematic risk than the market portfolio, so that when the average market return rises, the return from the security will rise, but by a smaller amount. Similarly, when the average market return falls, the return from the security will also fall, but by a smaller amount. • A risk-free security has no systematic risk, because returns on these securities are unaffected by changes in market conditions.
Measurement of systematic risk A well-diversified portfolio still has some degree of risk or variability. • This is due to the fact that all shares are sensitive to some degree to systematic risk. Systematic risk will affect the shares of all companies although some will be affected to a greater or lesser degree than others. • The degree to which a shares returns are affected by systematic risk depends upon that share's sensitivity to systematic risk. This sensitivity to systematic risk is measured by a beta factor.
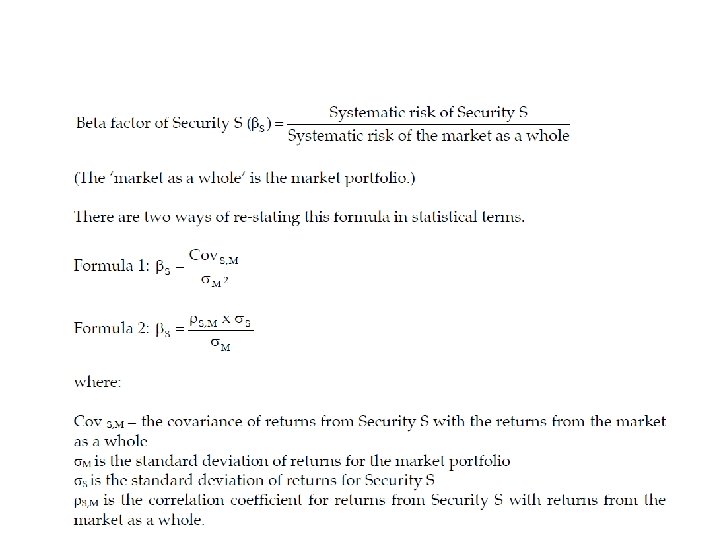
The beta factor (β) of a security The systematic risk for an individual security is measured as a beta factor. This is a measurement of the systematic risk of the security, in relation to the systematic risk of the market portfolio as a whole. Beta factors for quoted shares are measured using historic data and published. They are determined by comparing changes in a share's returns compared to changes in the market returns over a period. This can be illustrated by the Security Characteristic Line and gives an indication of the shares sensitivity to these market changes. The beta factor is estimated from these observations by determining the gradient or slope of the line of best fit through the observed points. The steeper the slope the more volatile the share and the higher the beta factor. The formula for calculating a security’s beta factor is as follows:
Example The annual returns on shares in Company Z have a standard deviation of 3. 58% and the standard deviation of market returns is 2. 72%. The correlation coefficient for returns on shares in Company Z and returns for the market as a whole is + 0. 85. The beta factor for shares in Company Z is:
Formula for the CAPM The beta factor for a risk-free security = 0. The beta factor for the market portfolio = 1. 0. When the beta factor for an individual security is greater than 1, the increase or fall in its expected return (ignoring unsystematic risk) will be greater than any given increase or decrease in the market return. When the beta factor for a security is less than 1, the security is relatively low-risk. The expected increase or decrease in its expected return (ignoring unsystematic risk) will be less than any given increase or decrease in the market return. The formula for the capital asset pricing model is used to calculate the expected return from a security (ignoring unsystematic risk).
A beta factor therefore simply describes a share's degree of sensitivity to general changes in the market's returns, caused by systematic risk.
Thank you