Investigation of skin optical clearing using twophoton microscopy


![Results: optical clearing using two-photon microscopy [3] Figure 1. Structural images of different skin](https://slidetodoc.com/presentation_image_h/2e26a62cd56fec2bbcf088e7049debbe/image-8.jpg "Results: optical clearing using two-photon microscopy [3] Figure 1. Structural images of different skin")
 and SHG (b) signals obtained")
 and")

 and HWN (b) Raman")
![Results: optical clearing using Confocal Raman microscopy in fingerprint region [4] Figure 5. Depth-dependent](https://slidetodoc.com/presentation_image_h/2e26a62cd56fec2bbcf088e7049debbe/image-13.jpg "Results: optical clearing using Confocal Raman microscopy in fingerprint region [4] Figure 5. Depth-dependent")


![Results: investigation of optical clearing influence on hydrogen bound water profiles [5] Figure 6.](https://slidetodoc.com/presentation_image_h/2e26a62cd56fec2bbcf088e7049debbe/image-17.jpg "Results: investigation of optical clearing influence on hydrogen bound water profiles [5] Figure 6.")

, DDAA–OH")
: hydrogen bonding state of water molecules")

![The results of presented studies has been published in the next articles: [1]Sdobnov, A.](https://slidetodoc.com/presentation_image_h/2e26a62cd56fec2bbcf088e7049debbe/image-22.jpg "The results of presented studies has been published in the next articles: [1]Sdobnov, A.")

- Slides: 23
Investigation of skin optical clearing using two-photon microscopy and Raman spectroscopy Anton Sdobnov 1, *, Maxim E. Darvin 2, Johannes Schleusener 2, Juergen Lademann 2, Valery Tuchin 3 OPTOELECTRONICS AND MEASUREMENT TECHNIQUES LABORATORY, UNIVERSITY OF OULU, FINLAND CENTER OF EXPERIMENTAL AND APPLIED CUTANEOUS PHYSIOLOGY, DEPARTMENT OF DERMATOLOGY, VENEROLOGY AND ALLERGOLOGY, CHARITÉ – UNIVERSITÄTSMEDIZIN BERLIN, CORPORATE MEMBER OF FREIE UNIVERSITÄT BERLIN, HUMBOLDT-UNIVERSITÄT ZU BERLIN, BERLIN INSTITUTE OF HEALTH, CHARITÉPLATZ 1, 10117 BERLIN, GERMANY 3 RESEARCH-EDUCATION INSTITUTE OF OPTICS AND BIOPHOTONICS, SARATOV NATIONAL RESEARCH STATE UNIVERSITY, RUSSIAN FEDERATION 1 2 *CORRESPONDING AUTHOR: E-MAIL: ANTON. SDOBNOV@OULU. FI
Optical clearing Currently, a large amount of optical methods and techniques such as optical coherence tomography (OCT), confocal Raman microscopy, Raman and coherent anti‐Stokes Raman spectroscopies (RS and CARS), laser scanning microscopy (LSM), multiphoton tomography (MPT), including CARS tomography, laser speckle contrast imaging (LSCI), etc. have been implemented for noninvasive skin diagnostics in dermatology and cosmetology. However, all of these optical techniques have a critical limitation associated with the limited penetration depth caused by strong light scattering of the stratum corneum (SC), living epidermis and dermis. In order to increase the probing depth, light focusing ability, spatial resolution of optical systems and image contrast, the optical clearing technique (OC) [1, 2], allowing for control of tissue optical properties, has been proposed.
Main mechanisms of tissue optical immersion clearing Three hypothesized mechanisms of tissue OC were suggested: §Matching of refractive indices (n) between tissue components and interstitial fluid (ISF) modified by an optical clearing agents (OCA) diffused into the tissue. §Reversible dissociation of collagen fibers §Tissue dehydration induced by hyperosmolarity of the applied agent. These and possibly other not known OC mechanisms usually works not independently but simultaneously with different relative contributions dependent on tissue and OCA and delivery method. However, some of the OCAs were found to be toxic and destructive for the skin. Also, OC can substantially influence the skin water content. As the hydration state and water bounding in the skin is of major interest in cosmetology and dermatology, the search for the most effective, low‐cost, and at the same time, non‐destructive and non‐toxic OCAs with controlable influence on the skin water content for clinical application became a hot topic in the last few years.
Materials and methods: Multiphoton tomography for application in dermatology is an imaging technique based on the two photon excitation of cutaneous fluorophores. The Two‐Photon Excited Auto Fluorescence (TPEAF) originates from NAD(P)H, keratin, elastin and melanin, while the second harmonic generation (SHG) is due to collagen I molecule response. The investigations were carried out using a commercially available two‐photon tomograph (Derma. Inspect, Jenlab Gmb. H, Jena, Germany) equipped with a tunable femtosecond titanium sapphire laser (Mai Tai XF, Spectra Physics, USA, 710– 920 nm, 100‐fs pulses at a repetition rate of 80 MHz). An objective lens with 40× magnification and NA = 1. 3 has been used. The lateral and axial resolutions in the skin are 0. 5 ± 0. 1 μm and 1. 6 ± 0. 4 μm, respectively.
Materials and methods: Confocal Raman microscopy The CRM measurements were performed using a skin composition analyzer appropriate for in vivo/ex vivo skin measurements (River. D International B. V. , Model 3510 SCA, Rotterdam, The Netherlands). The following settings were used to analyze skin in the high wavenumber (HWN) region (2000– 4000 cm− 1): excitation wavelength of 671 nm, oil objective of × 50 magnification with a spot size of ≤ 5 μm, laser power of 19 m. W on the skin surface and an exposure time of 1 s. For the determination of the skin surface position, the following settings were used: excitation wavelength of 785 nm for the fingerprint (FP) region (400– 2000 cm− 1), laser power of 20 m. W on the skin surface and an exposure time of 5 s. The spatial and axial resolutions of the instrument were ≤ 5 μm, and the spectral resolution was 2 cm− 1. The utilized doses of reference light were below the safety limit and did not influence the skin components.
Materials and methods: Skin Sample Preparation Measurements were performed on fresh porcine ear skin. Porcine ear skin was obtained on the day of sacrifice, cleaned with cold running water, dried using a paper towel, and stored in a refrigerator at +5 °C not more than 2 days. To standardize initial condition of skin samples in order to get reproducible results on optical clearing efficiency, and reduce the influence of artifacts, before OCA application, skin samples were left for 30 min at room temperature (+20 °C). In order to increase OCA penetration into the skin, the stratum corneum was partially removed using the following procedure: 1. Hair together with superficial SC was removed from the skin by shaving with a disposable razor. 2. The tape stripping procedure was performed (15 strips). 3. The skin surface was defatted with ethanol for 5 s.
Materials and methods: Optical Clearing Agents For the investigation of the optical clearing effect, two OCAs were chosen: §Glycerol which is the most frequently used OCA as its biocompatibility and pharmacokinetics renders it suitable for skin. The refractive index for 100% solution was n = 1. 474. Viscosity and osmolarity was 1410 cp and 10. 87 Osm l− 1, respectively. §Iohexol, N, N′‐bis(2, 3‐dihydroxypropyl)‐ 5‐[N‐(2, 3‐dihydroxypropyl)‐acetamido]‐ 2, 4, 6‐ triiodoisophthalamide, a non‐ionic, water‐soluble radiographic contrast medium with a molecular weight of 821. 14 g mol− 1 manufactured by GE Healthcare Ireland, Cork, Ireland, known by the trademark Omnipaque™ (300). The refractive index for 100% solution was n = 1. 432. Viscosity and osmolarity was 11. 8 cp and 0. 465 Osm l− 1, respectively.
Results: optical clearing using two-photon microscopy [3] Figure 1. Structural images of different skin layers obtained ex vivo for porcine ear skin samples at application of different Omnipaque. TM and glycerol solutions. Red color corresponds to TPEAF signal channel. Green color corresponds to SHG signal channel.
Figure 2. Averaged depth-dependent intensity profiles of TPEAF (a) and SHG (b) signals obtained ex vivo for porcine ear skin samples at application of different Omnipaque. TM and glycerol solutions; SD –standard deviations of TPEAF and SHG signals; depth-dependent indices of optical clearing efficiency (OCE) calculated for signal intensities of TPEAF (c) and SHG (d) signals. Index of the optical clearing efficiency has been calculated as a ratio between intensity after and before optical clearing.
Figure 3. Comparison of skin epidermal layer structure on 35 μmdepth: without (a) and with [(b)–(d)] OCA treatment; 100% Omnipaque. TM (b); 40% glycerol (c); 100% glycerol (d). It is clearly seen that glycerol causes greater cells shrinkage due strong dehydration.
Conclusions for two-photon measurements The results show that a topical application of glycerol or Omnipaque. TM solutions onto the skin for 60 min significantly improved the depth and contrast of the MPT signals. By utilizing 40%, 60% and 100% glycerol, and 60% and 100% Omnipaque. TM it was demonstrated that both agents improve autofluorescence and SHG (second harmonic generation) signals from the skin. At the applied concentrations and agent time exposure, glycerol is more effective than Omnipaque TM. However, tissue shrinkage and cell morphology changes were found for highly concentrated glycerol solutions. Omnipaque. TM, on the contrary, increases the safety and has no or minimal tissue shrinkage during the optical clearing process. Moreover Omnipaque. TM allows for robust multimodal optical/X‐ray imaging with automatically matched optically cleared and X‐ray contrasted tissue volumes. These findings make Omnipaque. TM more prospective than glycerol for some particular application.
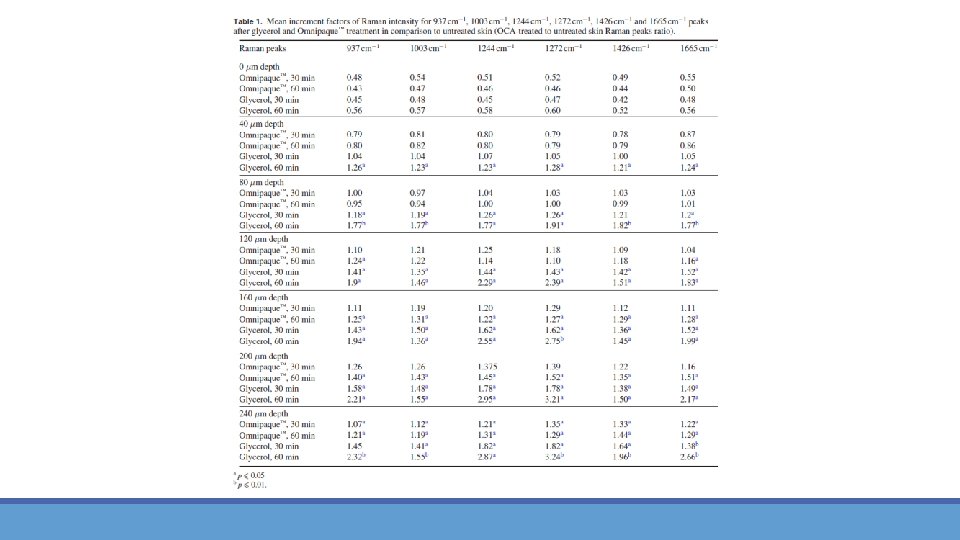
Raman spectra for optical clearing agents Figure 4. FP (a) and HWN (b) Raman spectra of 70% glycerol in water (red line) and 100% Omnipaque™ solution (blue line). Fig. 4 shows the Raman spectra in the FP (a) and HWN (b) regions for the Omnipaque. TM and glycerol solutions. In the HWN region both agents have a signal in the 3100– 3700 cm‐ 1 (CO–H and OH vibrations of OCAs) and in the 2910‐ 2965 cm‐ 1 (CH 2 vibrations of OCAs), which are superimposed with water and protein Raman peaks of the skin. Previous results showed that at the same study conditions, Omnipaque. TM penetrates up to 35– 40 µm depth into porcine skin within 60 min treatment, while glycerol reaches to the depth of 160 µm. Therefore, OCA’s own Raman peaks in the HWN region can possibly affect results of the spectral analysis of the skin.
Results: optical clearing using Confocal Raman microscopy in fingerprint region [4] Figure 5. Depth-dependent Raman spectra of porcine skin without OCA treatment (a), after 30 min (b) and 60 min (c) of 100% Omnipaque™ treatment and after 30 min (d) and 60 min (e) of 70% glycerol in water solution treatment. The dotted vertical lines indicate Omnipaque™-related Raman peaks at 774 and 1516 cm− 1 (b) and (c) and glycerol-related Raman peaks at 486 and 1056 cm− 1 (d) and (e).
To show the collagen hydration, the 938/922 cm− 1 peak ratio was calculated as a potential spectroscopic marker of collagen hydration. The 922 cm− 1 and 938 cm− 1 peaks correspond to the stretching vibration of C–C bond (νC–C) and vibration of skeletal C–C stretching mode of collagen chains, respectively. The 938/922 cm− 1 peak ratio increases with the increasing collagen hydration.
Conclusions for investigation of optical clearing influence on collagen hydration The intensity of the skin‐related Raman peaks significantly increased starting from the depth 160 μm for Omnipaque™ and 40 μm for glycerol (p � 0. 05) after 60 min of treatment. The OCAs’ influence on the collagen hydration in the deep‐located dermis was investigated. Both OCAs induce skin dehydration, but the effect of glycerol treatment (30 min and 60 min) is stronger. The obtained results demonstrate that with increasing the treatment time, both glycerol and Omnipaque™ solutions improve the optical clearing of porcine skin making the deep‐located dermal regions able for investigations. At the used concentrations and time intervals, glycerol is more effective than Omnipaque™. However, Omnipaque™ is more promising than glycerol for future in vivo applications as it is an already approved pharmaceutic substance without any known impact on the skin structure.
Results: investigation of optical clearing influence on hydrogen bound water profiles [5] Figure 6. Gaussian function-based deconvolution procedure of the porcine skin (depth 80 µm) Raman spectrum (black – skin; green – lipids; red – proteins; blue – DAA-OH, DA-OH, and free-OH water types). The deconvolution procedure of the porcine skin Raman peaks in the HWN region was performed using 10 Gaussian functions (see Fig. 6) for each investigated depth. 4 Gaussian functions centered at around 2850, 2880, 2930 and 2980 cm‐ 1 have been chosen to model the lipid‐keratin band (2820– 3030 cm‐ 1). The spectral range of 3000– 3800 cm− 1, representing the OH vibration of water with low contribution of proteins, was deconvoluted using 6 Gaussian functions. The AUCs of the water–related 4 Gaussian functions centered at 3005, 3277, 3458 and 3604 cm− 1, which correspond to tightly hydrogen bound water molecules (DAA–OH, single donor–double acceptor), strongly hydrogen bound water (DDAA–OH, double donor–double acceptor), weakly hydrogen bound water (DA–OH, single donor–single acceptor) and free water (superposition of very weakly bound water type DDA–OH, double donor–single acceptor and unbound OH), were calculated. Also, 2 Gaussian functions centered at around 3060 and 3330 cm‐ 1 have been chosen to model the unsaturated methylene stretching band of keratin and NH vibration band of keratin, respectively. The total water content was calculated as a ratio of the sum of the AUCs of all 4 hydrogen bound water types to the protein content (AUC of the Gaussian function centered at 2930 cm ‑ 1).
Table 3. Depth–dependent AUC values of DAA–OH, DA–OH and free–OH water types normalized to the protein peak. “*” and “**” represent the significant differences between untreated and OCA‐treated skin with p<0. 05 and p<0. 01, respectively. DAA–OH water band to protein band ratio (tightly hydrogen bound water) Depth, Untreated µm DA–OH water band to protein band ratio (weakly hydrogen bound water) Omnipaque TM, 30 Omnipaque TM, 60 Glycerol, Depth, min 30 min 60 min µm Untreated Omnipaque TM, 30 Omnipaque TM, 60 Glycerol, min 30 min 60 min 0 0. 14± 0. 02 0. 11± 0. 02 0. 13± 0. 01 0. 08± 0. 01* 0. 07± 0. 01* 0 3. 37± 0. 23 3. 55± 0. 22 3. 66± 0. 23 3. 65± 0. 26 3. 33± 0. 27 40 0. 17± 0. 01 0. 15± 0. 02 0. 13± 0. 01* 0. 09± 0. 01** 0. 08± 0. 01** 40 5. 40± 0. 20 5. 70± 0. 23 6. 20± 0. 17* 4. 02± 0. 16** 2. 99± 0. 16** 80 0. 17± 0. 01 0. 14± 0. 01* 0. 11± 0. 01* 0. 10± 0. 01* 0. 06± 0. 01** 80 5. 59± 0. 19 5. 23± 0. 18 4. 95± 0. 12* 3. 76± 0. 15** 2. 89± 0. 17** 120 0. 16± 0. 01 0. 14± 0. 01 0. 11± 0. 02* 0. 11± 0. 01* 0. 05± 0. 02** 120 5. 69± 0. 18 5. 0± 0. 18 5. 25± 0. 18* 3. 65± 0. 16** 2. 52± 0. 19** 160 0. 16± 0. 01 0. 13± 0. 01 0. 12± 0. 01* 0. 09± 0. 01** 0. 06± 0. 01** 160 5. 91± 0. 16 5. 61± 0. 19 5. 09± 0. 19* 3. 91± 0. 20** 2. 93± 0. 28** 200 0. 16± 0. 02 0. 14± 0. 02 0. 12± 0. 01* 0. 08± 0. 01** 0. 05± 0. 01** 200 6. 12± 0. 35 5. 1± 0. 25* 5. 00± 0. 24* 3. 81± 0. 28** 2. 79± 0. 27** DDAA–OH water band to protein band ratio (strongly hydrogen bound water) Depth, Untreated µm Free–OH water band to protein band ratio (unbound water) Omnipaque TM, 30 Omnipaque TM, 60 Glycerol, Depth, min 30 min 60 min µm Untreated Omnipaque TM, 30 Omnipaque TM, 60 Glycerol, min 30 min 60 min 0 2. 93± 0. 2 3. 12± 0. 2 3. 20± 0. 26 3. 44± 0. 24 2. 91± 0. 25 0 0. 32± 0. 03 0. 42± 0. 03* 0. 38± 0. 05 0. 44± 0. 05* 0. 37± 0. 04 40 4. 79± 0. 17 5. 08± 0. 16 5. 26± 0. 17 3. 49± 0. 16** 2. 71± 0. 16** 40 0. 59± 0. 04 0. 57± 0. 04 0. 62± 0. 05 0. 46± 0. 04** 0. 32± 0. 04** 80 4. 86± 0. 13 4. 51± 0. 17 4. 25± 0. 16* 3. 23± 0. 18** 2. 54± 0. 16** 80 0. 63± 0. 05 0. 60± 0. 04 0. 55± 0. 04 0. 51± 0. 04** 0. 25± 0. 04** 120 4. 95± 0. 18 4. 63± 0. 15 4. 53± 0. 19* 3. 13± 0. 17** 2. 19± 0. 14** 120 0. 59± 0. 05 0. 57± 0. 04 0. 55± 0. 06 0. 48± 0. 05* 0. 27± 0. 05** 160 4. 88± 0. 16 4. 75± 0. 16 4. 27± 0. 16* 3. 40± 0. 16** 2. 37± 0. 15** 160 0. 60± 0. 05 0. 57± 0. 07 0. 50± 0. 05 0. 40± 0. 05** 0. 26± 0. 04** 200 4. 96± 0. 27 4. 62± 0. 24 4. 16± 0. 26* 3. 12± 0. 27** 2. 29± 0. 26** 200 0. 62± 0. 05 0. 55± 0. 05 0. 49± 0. 05* 0. 40± 0. 04** 0. 25± 0. 04**
Figure 7. The depth dependent distribution of the relative percentage of DAA–OH (a), DDAA–OH (b), DA–OH (c) and free–OH (d) water types in the untreated skin (thick red line) and in the skin treated with Omnipaque. TM for 30 min / 60 min (blue solid line / green dotted line) and in the skin treated with glycerol for 30 min / 60 min (purple solid line / orange dotted line). SC – stratum corneum; SSp – stratum spinosum; PD – papillary dermis; RD – reticular dermis.
Figure 8. Skin depth profiles of the (a): hydrogen bonding state of water molecules (determined by the weakly bound / strongly bound water molecule types ratio) and (b): total water content (determined by the ratio of full water to proteins content). Thick red line – untreated skin; blue solid line / green dotted line – skin treated with Omnipaque. TM for 30 min / 60 min; purple solid line / orange dotted line – skin treated with glycerol for 30 min / 60 min. SC – stratum corneum; SSp – stratum spinosum; PD – papillary dermis; RD – reticular dermis.
Conclusions for investigation of optical clearing influence on hydrogen bound water profiles In the present ex vivo study on optical clearing of porcine ear skin using 100% Omnipaque. TM and 70% glycerol in water as a OCAs, the changes of full water content and of water molecule types separated by their hydrogen bounding strength (i. e. , tightly hydrogen bound, strongly hydrogen bound, weakly hydrogen bound and unbound water types), were investigated using CRM. The reduction in water concentration was calculated as an average decrease in the 40– 200 µm depths, where the water shows the lowest concentration gradient, in comparison to untreated skin (100%). It was shown that the application of Omnipaque. TM for 30 min does not result in significant changes in skin full water profile and only a tendency to reduction has been observed (≈4. 4% reduction). An application of Omnipaque. TM for 60 min caused significant loss of the water content (p<0. 05) starting from 80 μm down to 200 µm (≈8. 3% reduction), which is related to the significant decrease of tightly bound (≈26. 1% reduction), strongly bound (≈7. 9% reduction) and weakly bound (≈7. 5% reduction) water types in all depths. For the specific depth of 40 µm, Omnipaque. TM–treated skin shows an increase of water concentration on ≈5. 0% for 30 min and ≈11. 4% for 60 min application. The application of 70% glycerol for 30 min and 60 min give rise to highly significant reduction of the full water content (p<0. 01) from 40 μm to 200 µm skin depth (≈33. 1% and ≈51. 3% reduction, respectively). The water types %–reduction looks as follows: strongly bound (≈33. 0% and ≈50. 4% reduction, respectively), weakly bound (≈33. 2% and ≈51. 1% reduction, respectively), tightly bound (≈42. 3% and ≈63. 6% reduction, respectively), unbound (≈28. 7% and ≈55. 4% reduction, respectively). Thus, the skin dehydration induced by the application of glycerol (60 min), glycerol (30 min), Omnipaque. TM (60 min), and Omnipaque. TM (30 min) is equal to 51. 3%, 33. 1%, 8. 3%, and 4. 4%, respectively. As weakly bound and strongly bound water types together represent approx. 93% of total water content in the skin, they are mostly involved in the interaction with OCAs. Nevertheless, the most mobile unbound water type, which is approx. 5% in the skin, is also involved in OCA‐induced water flux in the skin.
The results of presented studies has been published in the next articles: [1]Sdobnov, A. Yu, et al. "Recent progress in tissue optical clearing for spectroscopic application. " Spectrochimica Acta Part A: Molecular and Biomolecular Spectroscopy 197 (2018): 216‐ 229. [2]Sdobnov, A. Yu, et al. "Methods for optical skin clearing in molecular optical imaging in dermatology. " Biochemistry (Moscow) 84. 1 (2019): 144‐ 158. [3]Sdobnov, Anton, et al. "A comparative study of ex vivo skin optical clearing using two‐photon microscopy. " Journal of biophotonics 10. 9 (2017): 1115‐ 1123. [4]Sdobnov, Anton Yu, et al. "Confocal Raman microscopy supported by optical clearing treatment of the skin—influence on collagen hydration. " Journal of Physics D: Applied Physics 50. 28 (2017): 285401. [5]Sdobnov, Anton Y. , et al. "Hydrogen bound water profiles in the skin influenced by optical clearing molecular agents—Quantitative analysis using confocal Raman microscopy. " Journal of biophotonics 12. 5 (2019): e 201800283.
Thank you for your attention!