Investigation of Ionic Liquids by Positron Annihilation Lifetime

Investigation of Ionic Liquids by Positron Annihilation Lifetime Spectroscopy G. Dlubek 1†, Yang. Yu 2, R. Krause-Rehberg 2, W. Beichel 3 and I. Krossing 3 1 ITA Institut für Innovative Technologien, Köthen, Germany 2 Martin-Luther-Universität Halle, Institut für Physik, 06099 Halle(Saale) Germany 3 Institut für Anorganische Chemie, Albert-Ludwigs-Universität Freiburg, Albertstraße 21, D-79104 Freiburg i. Br. , Germany Sep. 5 th. 2011

Outline § Free volume influence to molecular transport property § Fürth theory § Ionic Liquids § Experiment results and discussion § Conclusion
,")
Free volume influence to molecular transport property l Permeation properties (small molecules in polymer), viscosity, viscoelasticity, glass transition, volume recovery, mechanical properties l Fluidity: Doolittle: l Mobility: Cohen-Turnbull Equation: l Permeability coefficient: l Selectivity: l Ionic conductivity:

Fürth’s hole theory: n P Ref: Dlubek, G. , Yu, Yang, et al. , Free volume in imidazolium triflimide ([C 3 MIM][NTf 2]) ionic liquid from positron lifetime: Amorphous, crystalline, and liquid states. The Journal of Chemical Physics, 2010. 133(12): p. 124502 -10. [Fürth, R. Mathematical Proceedings of the Cambridge Philosophical Society, 1941. ] Ts
: ¨ Definition: organic salts with melting points below 100 o. C")
Ionic Liquids (ILs): ¨ Definition: organic salts with melting points below 100 o. C or even room temperature(RTILs). ¨ Structure: organic cations paired with organic or inorganic anions. [BMIM]+ [OTf]- [BF 4]- [PF 6]- [NTf 2]- [Cl]- [B(hfip)4]- Ionic formulae of the ionic liquids studied in this work.
![Experiment results and discussion [BMIM][BF 4]: The mean, < 3 >, and the standard](http://slidetodoc.com/presentation_image/b0641bf42f7750f03b37d9694178bef8/image-6.jpg "Experiment results and discussion [BMIM][BF 4]: The mean, < 3 >, and the standard")
Experiment results and discussion [BMIM][BF 4]: The mean, < 3 >, and the standard deviation, 3, of the o-Ps lifetime distribution as a function of temperature T during cooling and heating of [BMIM][BF 4]. Tg indicates the glass transition temperature and Tk the “knee” temperature. The intensity I 3 of the o-Ps lifetime as a function of temperature T during cooling and heating of [BMIM][BF 4].
![[BMIM][BF 4]: Number-weighted mean <vh> (spheres) and standard deviation h (squares) of the hole](http://slidetodoc.com/presentation_image/b0641bf42f7750f03b37d9694178bef8/image-7.jpg "[BMIM][BF 4]: Number-weighted mean <vh> (spheres) and standard deviation h (squares) of the hole")
[BMIM][BF 4]: Number-weighted mean <vh> (spheres) and standard deviation h (squares) of the hole size calculated from positron lifetime. Plot of the specific volume from PVT experiment under 0 MPa vs the mean hole volume at supercooled liquid state (between Tg and Tk). The line is a linear fit of the data.
![[BMIM][NTf 2]: The mean, < 3 > (squares), and the standard deviation, 3](http://slidetodoc.com/presentation_image/b0641bf42f7750f03b37d9694178bef8/image-8.jpg "[BMIM][NTf 2]: The mean, < 3 > (squares), and the standard deviation, 3")
[BMIM][NTf 2]: The mean, < 3 > (squares), and the standard deviation, 3 (spheres), of the o. Ps lifetime distribution as a function of temperature T during cooling and heating of [BMIM][NTf 2]. The o-Ps intensity I 3 as a function of temperature during cooling and heating of [BMIM][NTf 2]
![[BMIM][NTf 2]: Plot of the specific volume from PVT experiment under 0 MPa vs](http://slidetodoc.com/presentation_image/b0641bf42f7750f03b37d9694178bef8/image-9.jpg "[BMIM][NTf 2]: Plot of the specific volume from PVT experiment under 0 MPa vs")
[BMIM][NTf 2]: Plot of the specific volume from PVT experiment under 0 MPa vs the mean hole volume at supercooled liquid state (between Tg and Tk). The line is a linear fit of the data. Nh’ = 0. 179 x 1021 g-1 Vocc = 0. 6405 cm 3/g.
![[BMIM][OTf]: The mean, < 3>, and the standard deviation, 3, of the o-Ps lifetime](http://slidetodoc.com/presentation_image/b0641bf42f7750f03b37d9694178bef8/image-10.jpg "[BMIM][OTf]: The mean, < 3>, and the standard deviation, 3, of the o-Ps lifetime")
[BMIM][OTf]: The mean, < 3>, and the standard deviation, 3, of the o-Ps lifetime distribution as a function of temperature T during cooling and heating of [BMIM][OTf]. Tcr and Tm show the temperatures of crystallization (during cooling) and melting. The o-Ps intensity I 3.
![[BMIM][PF 6]: The mean, < 3>, and the standard deviation, 3, of the o-Ps](http://slidetodoc.com/presentation_image/b0641bf42f7750f03b37d9694178bef8/image-11.jpg "[BMIM][PF 6]: The mean, < 3>, and the standard deviation, 3, of the o-Ps")
[BMIM][PF 6]: The mean, < 3>, and the standard deviation, 3, of the o-Ps lifetime distribution as a function of temperature T during cooling and heating of [BMIM][PF 6]. 4 shows an additional o-Ps lifetime, which appears after transformation of the cr-II into the cr-I phase. The two o-Ps intensities I 3 and I 4.
![[BMIM][PF 6]: Plot of the specific volume from PVT experiment under 0 MPa vs](http://slidetodoc.com/presentation_image/b0641bf42f7750f03b37d9694178bef8/image-12.jpg "[BMIM][PF 6]: Plot of the specific volume from PVT experiment under 0 MPa vs")
[BMIM][PF 6]: Plot of the specific volume from PVT experiment under 0 MPa vs the mean hole volume at supercooled liquid state. The line is a linear fit of the data. Nh’ = 0. 376 x 1021 g-1 Vocc = 0. 6670 cm 3/g.
![[BMIM][Cl]: The mean, < 3>, and the standard deviation, 3, of the o-Ps](http://slidetodoc.com/presentation_image/b0641bf42f7750f03b37d9694178bef8/image-13.jpg "[BMIM][Cl]: The mean, < 3>, and the standard deviation, 3, of the o-Ps")
[BMIM][Cl]: The mean, < 3>, and the standard deviation, 3, of the o-Ps lifetime distribution as a function of temperature T during cooling and heating of [BMIM][Cl]. 4 shows an additional o-Ps lifetime which appears after crystallization. The two o-Ps intensities I 3 and I 4.
![[BMIM][Cl]: Plot of the specific volume from PVT experiment under 0 MPa vs the](http://slidetodoc.com/presentation_image/b0641bf42f7750f03b37d9694178bef8/image-14.jpg "[BMIM][Cl]: Plot of the specific volume from PVT experiment under 0 MPa vs the")
[BMIM][Cl]: Plot of the specific volume from PVT experiment under 0 MPa vs the mean hole volume at supercooled liquid state. The line is a linear fit of the data. Nh’ = 0. 584 x 1021 g-1 Vocc = 0. 8822 cm 3/g.
![[BMIM][B(hfip)4]: The mean, < 3>, and the standard deviation, 3, of the o-Ps lifetime](http://slidetodoc.com/presentation_image/b0641bf42f7750f03b37d9694178bef8/image-15.jpg "[BMIM][B(hfip)4]: The mean, < 3>, and the standard deviation, 3, of the o-Ps lifetime")
[BMIM][B(hfip)4]: The mean, < 3>, and the standard deviation, 3, of the o-Ps lifetime distribution as a function of temperature T during cooling and heating of [BMIM][B(hfip)4].
![Summarized parameters from experiment results for the ionic liquids. [BMIM]+ [Cl]- [BF 4]- [PF](http://slidetodoc.com/presentation_image/b0641bf42f7750f03b37d9694178bef8/image-16.jpg "Summarized parameters from experiment results for the ionic liquids. [BMIM]+ [Cl]- [BF 4]- [PF")
Summarized parameters from experiment results for the ionic liquids. [BMIM]+ [Cl]- [BF 4]- [PF 6]- [OTf]- [NTf 2]- [B(hfip)4]- Tg(K)(DSC) 225 188 -190 190 -194 186 Tm/Tcr (DSC) 341/290 283/220 286/254 271/232 Tg(PALS) 230 ± 5 K 190± 3 K 188 ± 3 K 190± 5 K Tk 335 ± 5 K 280± 5 K 285 ± 5 K 270± 5 K Tg/Tk 0. 687 0. 679 0. 660 0. 704 Vocc_sp(cm 3/g) (PALS) 0. 8822 0. 7574 0. 6670 0. 6405 Nf(1021 g-1) 0. 584 0. 442 0. 376 0. 179 Vocc(Å3)(PALS) 256 284 315 446 fh (Tg) 0. 025 (230 K) 0. 030 (190 K) 0. 034 (188 K) 0. 022 (190 K) fh (Tk) 0. 070 (335 K) 0. 079 (280 K) 0. 088 (285 K) 0. 061 (270 K)
![Hole volumes comparison with molecular volume [BMIM]+ [Cl] [BF 4] [PF 6] [OTf] [NTf](http://slidetodoc.com/presentation_image/b0641bf42f7750f03b37d9694178bef8/image-17.jpg "Hole volumes comparison with molecular volume [BMIM]+ [Cl] [BF 4] [PF 6] [OTf] [NTf")
Hole volumes comparison with molecular volume [BMIM]+ [Cl] [BF 4] [PF 6] [OTf] [NTf 2] Vm = V(A+X ) (Å3) 240 269 30 305 29 327 36 428 36 V([X] ) (Å3) 47± 13 73 9 107 10 129 7 232 15 liquid (< 3>, ns; 2. 50 2. 85 3. 03 3. 28 3. 505 <vh>, Å3) 115 5 150 5 180 5 215 5 240 5 glass, 140 K ( 3, ns ; 1. 25 1. 40 1. 60 <vh>, Å3)) 36 3 47 3 61 3 crystal (< 3> ns) 0. 78 1. 50/1. 25 1. 70 1. 45 [B(hfip)4] 759 556 4. 35 340 5 1. 70 - 2. 00 The hole volumes of various ILs in the liquid (filled circles) and in the glass (140 K, empty circles) states as function of the molecular volume Vm = V(A+X ). The straight lines are linear fits constrained to pass zero, the dashed line shows a quadratic fit.

Hole volume comparison with Fürth theory Comparison of the mean hole volumes <vh> for the liquid or supercooled liquid and glassy states of the ionic liquids under investigation. Filled symbols: cooling, empty symbols: heating. Free volume calculated by Fürth theory is shown as line in the graph. [Fürth, R. Mathematical Proceedings of the Cambridge Philosophical Society, 1941. ]

Viscosity and conductivity
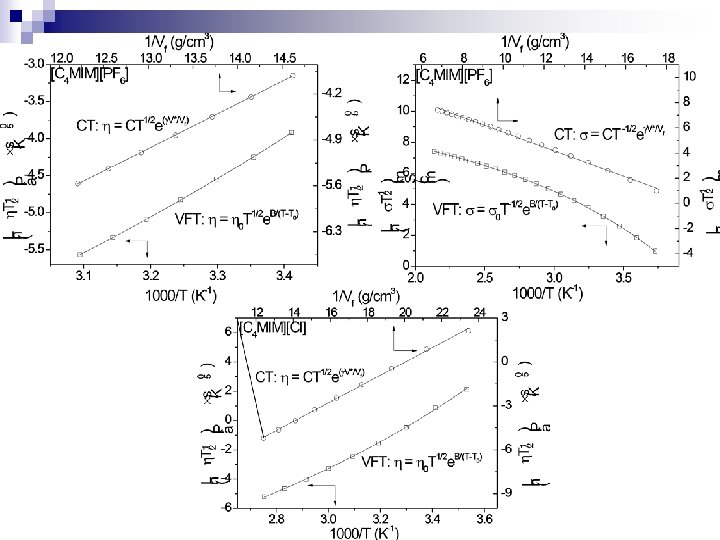
![[BMIM]+ [Cl] [BF 4] [PF 6] [NTf 2] -16. 5 2256 162. 1 -13.](http://slidetodoc.com/presentation_image/b0641bf42f7750f03b37d9694178bef8/image-21.jpg "[BMIM]+ [Cl] [BF 4] [PF 6] [NTf 2] -16. 5 2256 162. 1 -13.")
[BMIM]+ [Cl] [BF 4] [PF 6] [NTf 2] -16. 5 2256 162. 1 -13. 2 1154 149. 8 -12. 5 1094 166. 2 -11. 9 810 164. 9 -13. 5 0. 673 -11. 0 0. 462 -13. 9 0. 683 -11. 4 0. 313 10. 72 888 163. 6 10. 52 914 172. 5 9. 40 666 170. 5 10. 95 0. 516 11. 58 0. 593 9. 30 0. 283 0. 813629 0. 644766 0. 720126 1. 0571 0. 9178 0. 509612 0. 460619

Conclusion § Important information of the local free volume in the amorphous (glass, supercooled liquid, true liquid) and crystalline phases of ionic liquids as well as the corresponding phase transitions can be obtained from PALS. § The o-Ps mean lifetime < 3> shows different behaviour indicating different phases (smaller values in crystalline phase due to dense packing of the material). § The parameters I 3 also responds to phase transition by sharp value change. Low value in supercooled and true liquid, due to solvation of e+, precursor of Ps. § The knee temperature Tk coincidents with melting temperature of corresponding crystalline structure for [NTf 2], [PF 6] and [Cl] samples. § The local free volume from PALS displays a systematic relationship with molecular volume. § Fitting result of viscosity and conductivity by CT equation shows the free volume influence to molecular transport property.

More Results: http: //positron. physik. uni-halle. de/ Thanks for your time and patience!

Structural dynamic:
- Slides: 25