Investigating distribution Sampling Investigating distribution In our first

Investigating distribution Sampling

Investigating distribution • In our first lesson we discovered that a number of environmental factors will affect the distribution of organisms. What were those factors Temperature Light Water Oxygen Carbon Dioxide Nutrients Can you explain/suggest why these factors affect distribution?

Key maths skills • Define the following terms in as few words as possible, then find them for these numbers: 249352425 • • Mean Mode Median Range � Mean: add up all the numbers and then divide by the number of numbers (answer: 36/9 = 4) � Mode: the value that occurs most often (answer: 2) � Median: the "middle" value in the list of numbers when they are arranged in numerical order (answer: 2 2 2 3 4 4 5 5 9) � Range: the difference between the largest and smallest values (answer: 9 – 2 = 7)

Sampling techniques • There are two key sampling techniques that you must learn • 1) Random sampling using quadrats: in areas where distribution is quite uniform • 2) systematic sampling using transects: used to observe changes in distribution across areas of the habitat

Random sampling

Investigating distribution • On the next slide you need to find out how many daisies are growing in the field • You have 15 secs to come up with your own answer
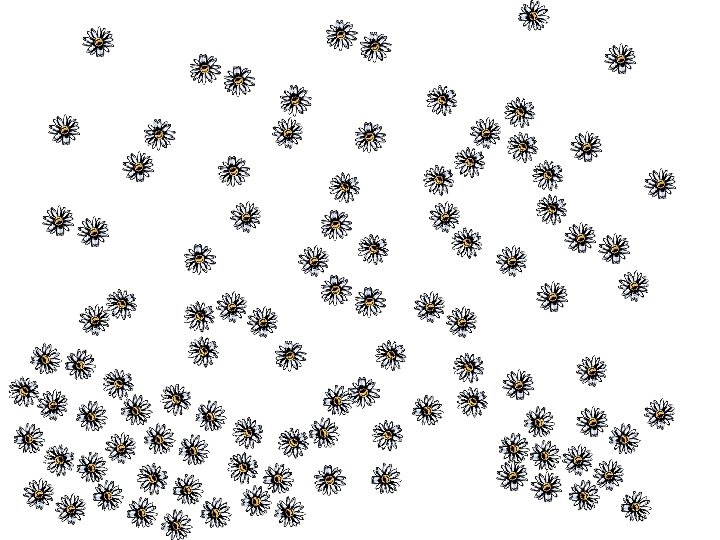

Estimating numbers of plants • How many did you count? How did you do it • The answer should have been 103 • Clearly trying to count the daisies in this way would take to long and be too difficult, so we must estimate the number in a logical way, keeping in mind the need to – Avoid bias – Get an accurate reading that is representative of the area • How could you refine your approach to the above challenege, to get a more accurate value of the number of daisies

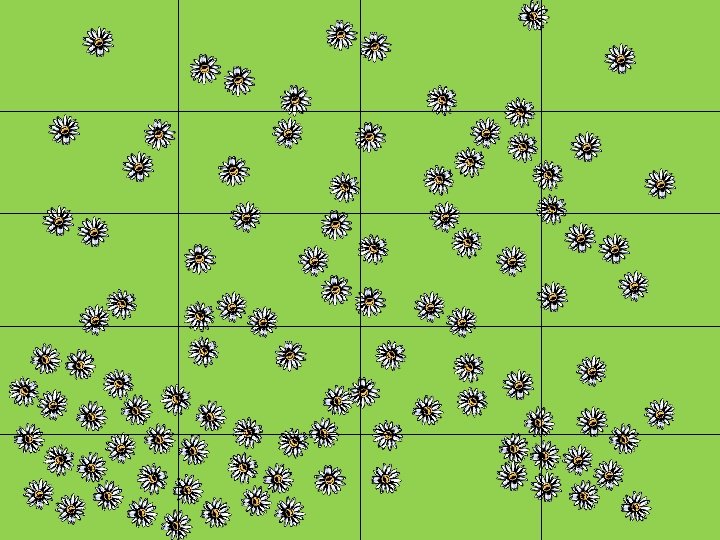
1. Divide the area into a grid using tape measures 2. Generate random numbers (using random number tables or a calculator): avoids bias 3. Use pairs of the random numbers as co-ordinates to place the quadrats in the field 4. Use a large number of quadrats to be representative of the area and to improve reliability of the results 5. Count the numbers of daisies in each quadrat 6. Find the mean/average number of daises in each quadrat 7. Multiply the mean number of daisies in 1 quadrat by the total number of quadrats that would fit into the field

Putting it in practise to get a new estimate

12 11 10 9 8 7 6 5 4 3 2 1 0 1 2 3 4 5 6 7 8 9 10 11 12 13 14

Try again on the next slide • There were 103 daisies in the field. • Try estimating the number of daisies again on the next slide • Your plan should have involved the following steps: – Select at 3 quadrats and count how many daisies are in each – find the mean number of daisies per quadrat – Multiply the mean by the number of quadrats that would fit into the field to get your estimated total number of daisies. – Try this method a second time with three different quadrats, then try it with 6 and see if there is a big difference in your values. – Why is it better to use 6 quadrats – What is the down side to using 6 quadrats

Problem solving 1. Some daisies are partly in and out of the quadrat Solution 1: count those 50% or more inside the quadrat ignore those less than 50% inside Solution 2: count the daises partly in on 2 sides only.

Problem solving 2. Solution Estimate percentage cover Solution How do you estimate percentage cover when you have distribution like that shown in the diagram? ? ? Count all squares that are at least 50% covered and ignore squares that are less than 50% covered Counting the number of a particular species in a quadrat can be difficult if…. . • There is a large number of the species • It is difficult to determine individual plants of the species

Work sheet • Do work sheet estimating numbers of daisies

Building a transect • Transects are used to investigate how distribution changes across an environmental gradient • In other words, how species change as the conditions in the habitat change • This can provide insight into what species require for survival

How does species distribution change as you move from inside the woodland out into the open field? First stretch a tape measure from under the trees out into the field this is the transect Place quadrats At regular intervals Along the transect Record the desired information • Number of different species in the quadrat (there are daisies, plantain, thistle, dandelions etc) • Number of a particular species in quadrat(there are 20 daisies) • Percentage cover of a species Repeat with more transects to get data that is representative of the area

Why is it important to find the numbers of different species in habitats? • To determine the stability of a habitat/ecosystem • To look at seasonal changes in species • To identify the impact of human influence • To identify warning signs about species decline • To identify the conditions needed for survival • To inform conservation measures

- Slides: 20