
Inventory Management Distribution Requirements Planning Lecture 11 ESD
Inventory Management Distribution Requirements Planning Lecture 11 ESD. 260 Fall 2003 Caplice
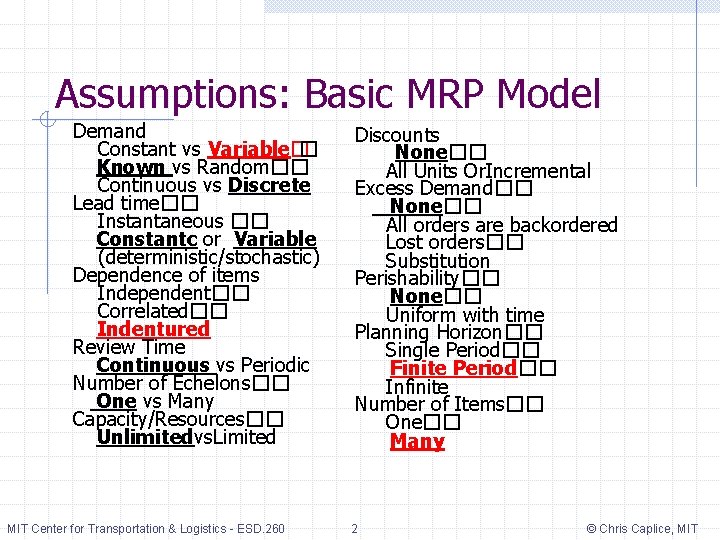
Assumptions: Basic MRP Model Demand Constant vs Variable� � Known vs Random�� Continuous vs Discrete Lead time�� Instantaneous �� Constantc or Variable (deterministic/stochastic) Dependence of items Independent�� Correlated�� Indentured Review Time Continuous vs Periodic Number of Echelons�� One vs Many Capacity/Resources�� Unlimitedvs. Limited MIT Center for Transportation & Logistics - ESD. 260 Discounts None�� All Units Or. Incremental Excess Demand�� None�� All orders are backordered Lost orders�� Substitution Perishability�� None�� Uniform with time Planning Horizon�� Single Period�� Finite Period�� Infinite Number of Items�� One�� Many 2 © Chris Caplice, MIT
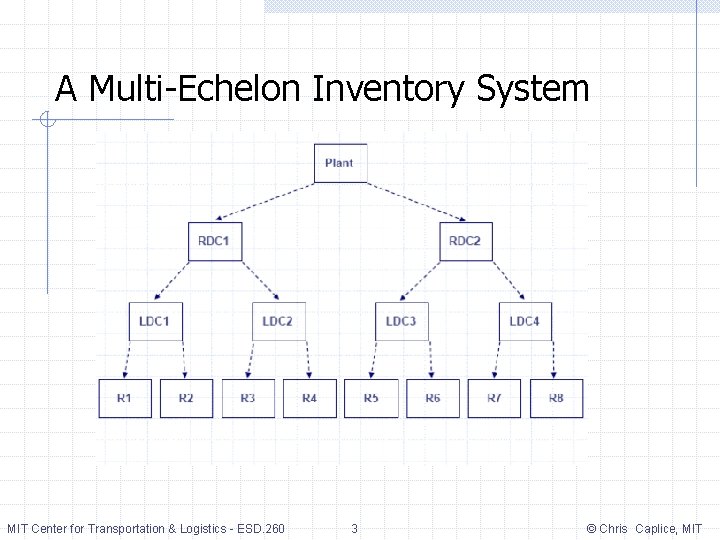
A Multi-Echelon Inventory System MIT Center for Transportation & Logistics - ESD. 260 3 © Chris Caplice, MIT
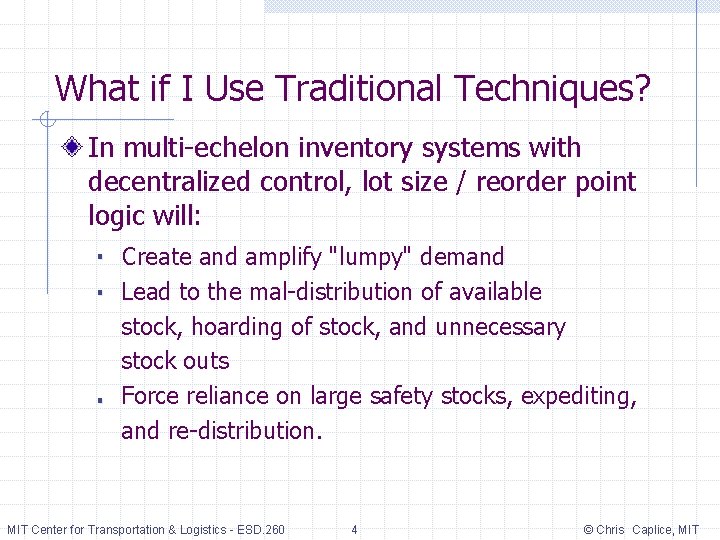
What if I Use Traditional Techniques? In multi-echelon inventory systems with decentralized control, lot size / reorder point logic will: ■ ■ ■ Create and amplify "lumpy" demand Lead to the mal-distribution of available stock, hoarding of stock, and unnecessary stock outs Force reliance on large safety stocks, expediting, and re-distribution. MIT Center for Transportation & Logistics - ESD. 260 4 © Chris Caplice, MIT
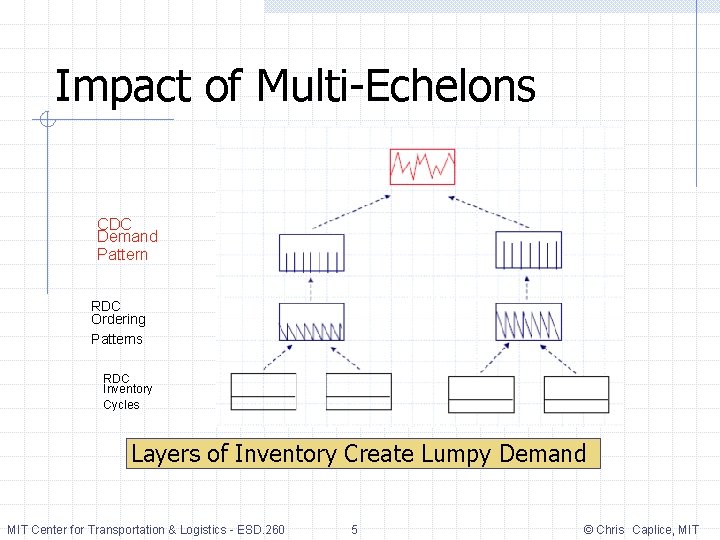
Impact of Multi-Echelons CDC Demand Pattern RDC Ordering Patterns RDC Inventory Cycles Layers of Inventory Create Lumpy Demand MIT Center for Transportation & Logistics - ESD. 260 5 © Chris Caplice, MIT
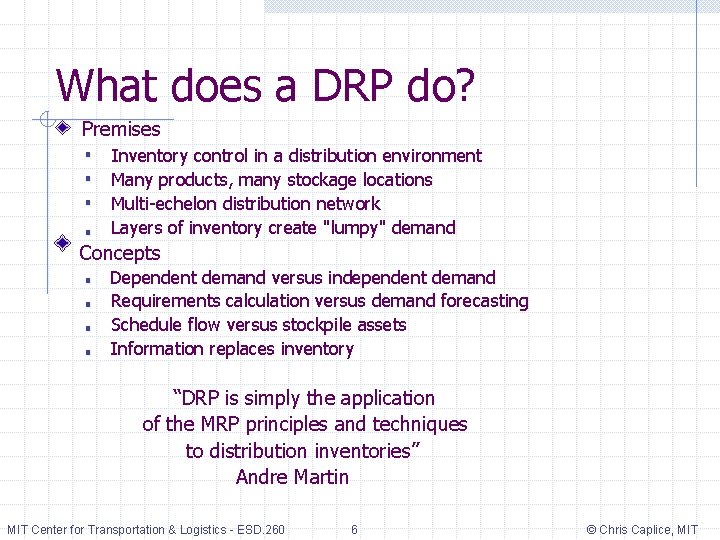
What does a DRP do? Premises ■ ■ Inventory control in a distribution environment Many products, many stockage locations Multi-echelon distribution network Layers of inventory create "lumpy" demand Concepts ■ ■ Dependent demand versus independent demand Requirements calculation versus demand forecasting Schedule flow versus stockpile assets Information replaces inventory “DRP is simply the application of the MRP principles and techniques to distribution inventories” Andre Martin MIT Center for Transportation & Logistics - ESD. 260 6 © Chris Caplice, MIT
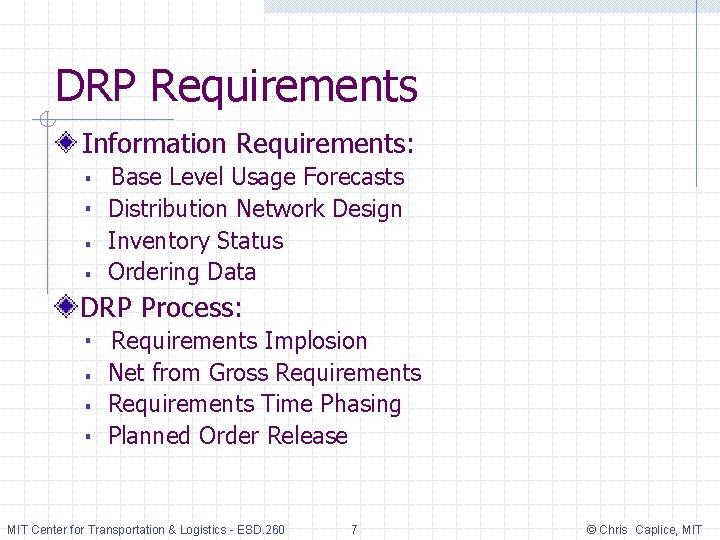
DRP Requirements Information Requirements: ■ ■ Base Level Usage Forecasts Distribution Network Design Inventory Status Ordering Data DRP Process: ■ ■ Requirements Implosion Net from Gross Requirements Time Phasing Planned Order Release MIT Center for Transportation & Logistics - ESD. 260 7 © Chris Caplice, MIT
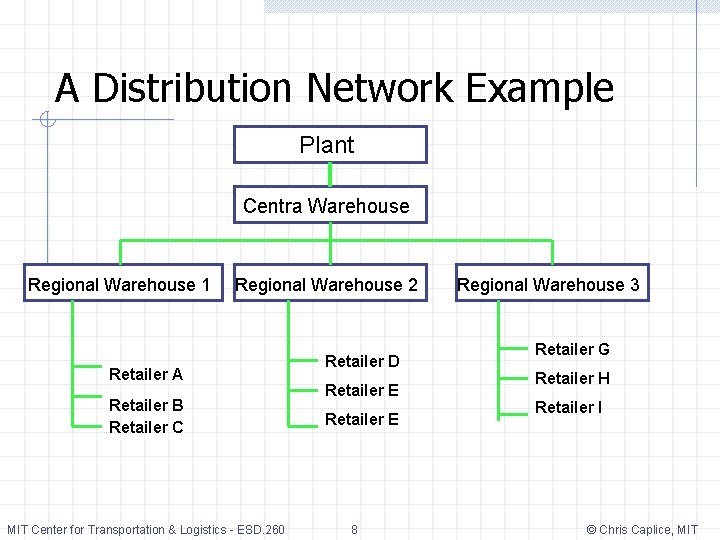
A Distribution Network Example Plant Centra Warehouse Regional Warehouse 1 Regional Warehouse 2 Retailer A Retailer B Retailer C MIT Center for Transportation & Logistics - ESD. 260 Retailer D Retailer E 8 Regional Warehouse 3 Retailer G Retailer H Retailer I © Chris Caplice, MIT
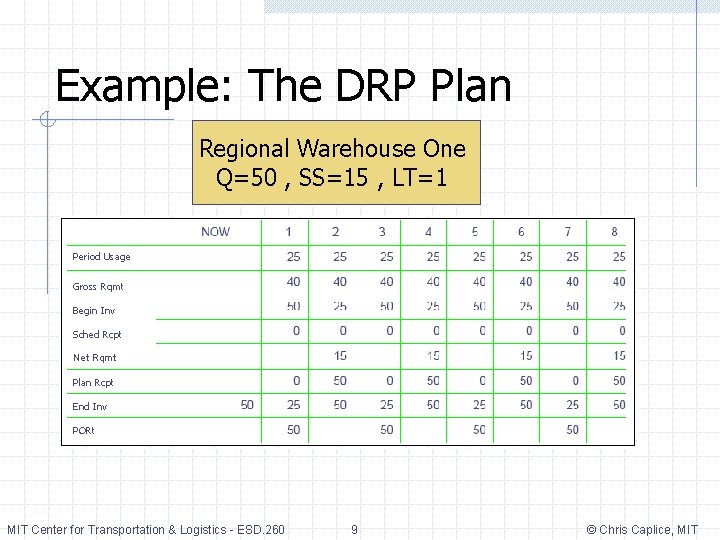
Example: The DRP Plan Regional Warehouse One Q=50 , SS=15 , LT=1 Period Usage Gross Rqmt Begin Inv Sched Rcpt Net Rqmt Plan Rcpt End Inv PORt MIT Center for Transportation & Logistics - ESD. 260 9 © Chris Caplice, MIT
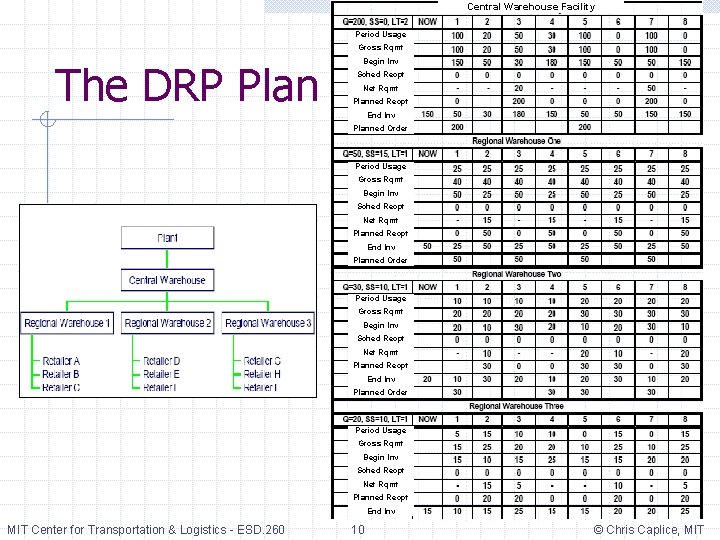
Central Warehouse Facility Period Usage Gross Rqmt The DRP Plan Begin Inv Sched Recpt Net Rqmt Planned Recpt End Inv Planned Order Period Usage Gross Rqmt Begin Inv Sched Recpt Net Rqmt Planned Recpt End Inv MIT Center for Transportation & Logistics - ESD. 260 10 © Chris Caplice, MIT
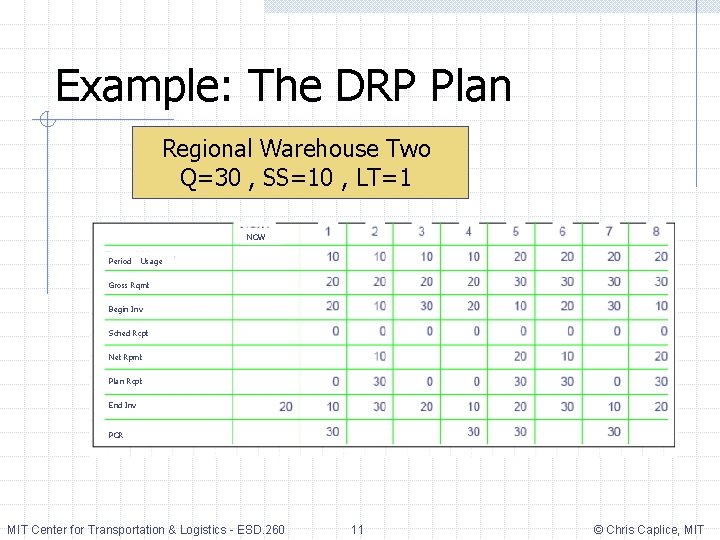
Example: The DRP Plan Regional Warehouse Two Q=30 , SS=10 , LT=1 NOW Period Usage Gross Rqmt Begin Inv Sched Rcpt Net Rpmt Plan Rcpt End Inv POR MIT Center for Transportation & Logistics - ESD. 260 11 © Chris Caplice, MIT
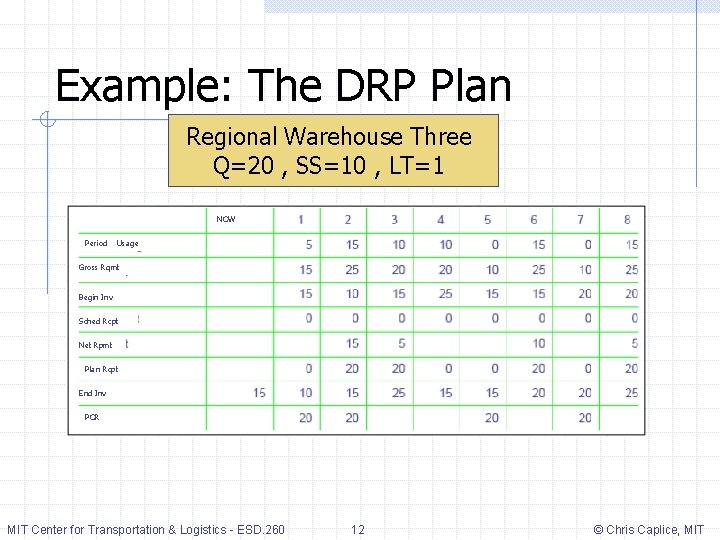
Example: The DRP Plan Regional Warehouse Three Q=20 , SS=10 , LT=1 NOW Period Usage Gross Rqmt Begin Inv Sched Rcpt Net Rpmt Plan Rcpt End Inv POR MIT Center for Transportation & Logistics - ESD. 260 12 © Chris Caplice, MIT
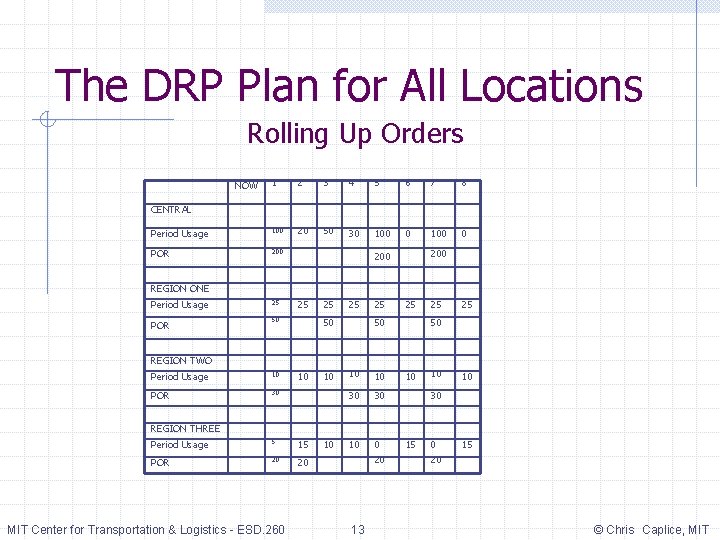
The DRP Plan for All Locations Rolling Up Orders 1 2 3 4 5 6 7 8 Period Usage 100 20 50 30 100 0 POR 200 NOW CENTRAL 200 REGION ONE Period Usage POR 25 25 50 REGION TWO Period Usage 10 POR 30 10 10 30 30 10 10 10 30 REGION THREE Period Usage 5 15 POR 20 20 MIT Center for Transportation & Logistics - ESD. 260 10 20 13 15 0 15 20 © Chris Caplice, MIT
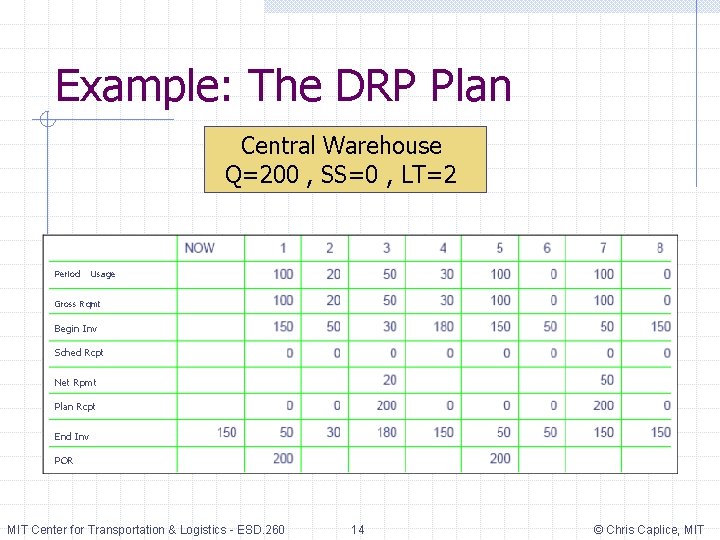
Example: The DRP Plan Central Warehouse Q=200 , SS=0 , LT=2 Period Usage Gross Rqmt Begin Inv Sched Rcpt Net Rpmt Plan Rcpt End Inv POR MIT Center for Transportation & Logistics - ESD. 260 14 © Chris Caplice, MIT
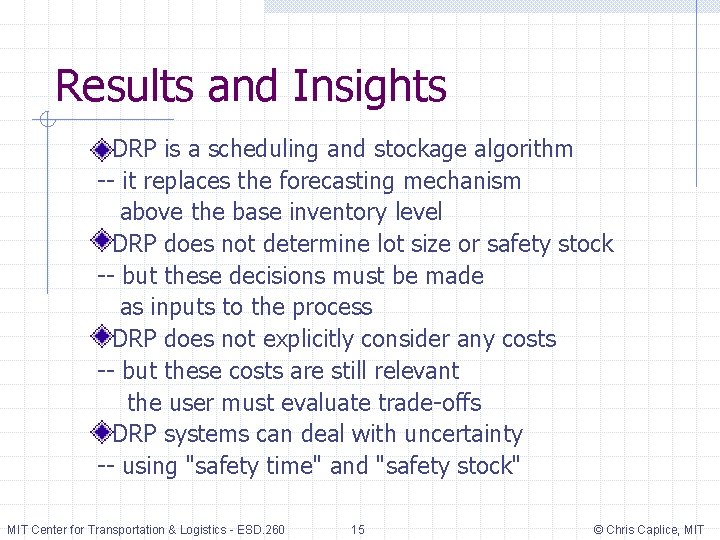
Results and Insights DRP is a scheduling and stockage algorithm -- it replaces the forecasting mechanism above the base inventory level DRP does not determine lot size or safety stock -- but these decisions must be made as inputs to the process DRP does not explicitly consider any costs -- but these costs are still relevant the user must evaluate trade-offs DRP systems can deal with uncertainty -- using "safety time" and "safety stock" MIT Center for Transportation & Logistics - ESD. 260 15 © Chris Caplice, MIT
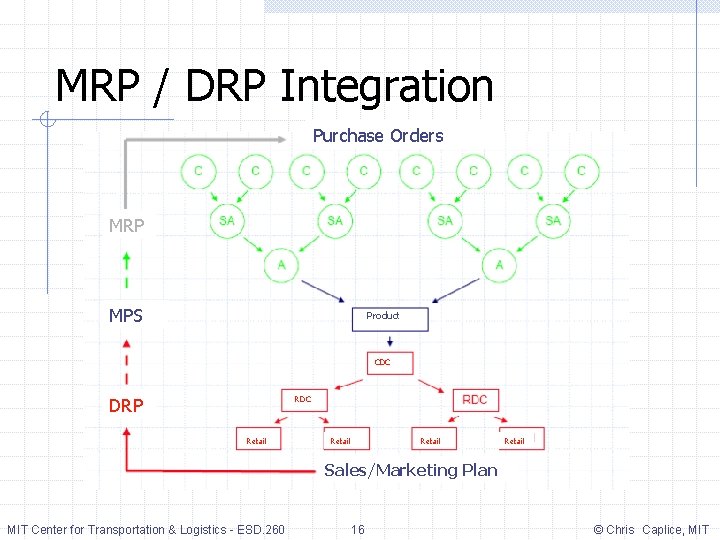
MRP / DRP Integration Purchase Orders MRP MPS Product CDC DRP RDC Retail Sales/Marketing Plan MIT Center for Transportation & Logistics - ESD. 260 16 © Chris Caplice, MIT
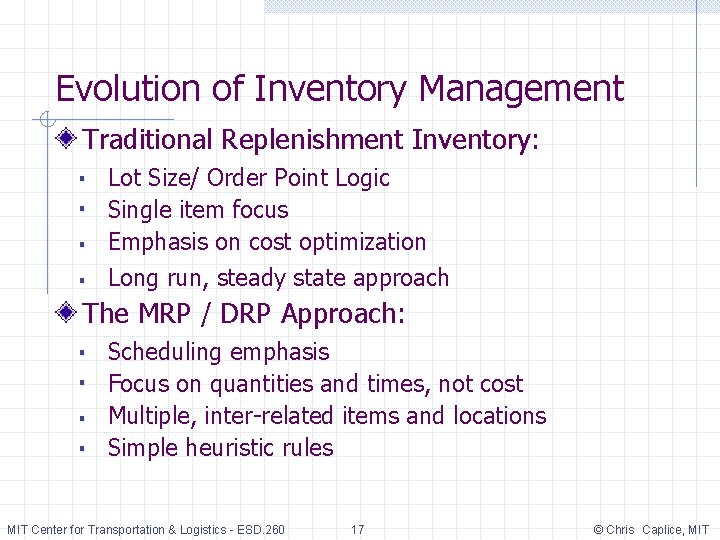
Evolution of Inventory Management Traditional Replenishment Inventory: ■ ■ Lot Size/ Order Point Logic Single item focus Emphasis on cost optimization Long run, steady state approach The MRP / DRP Approach: ■ ■ Scheduling emphasis Focus on quantities and times, not cost Multiple, inter-related items and locations Simple heuristic rules MIT Center for Transportation & Logistics - ESD. 260 17 © Chris Caplice, MIT
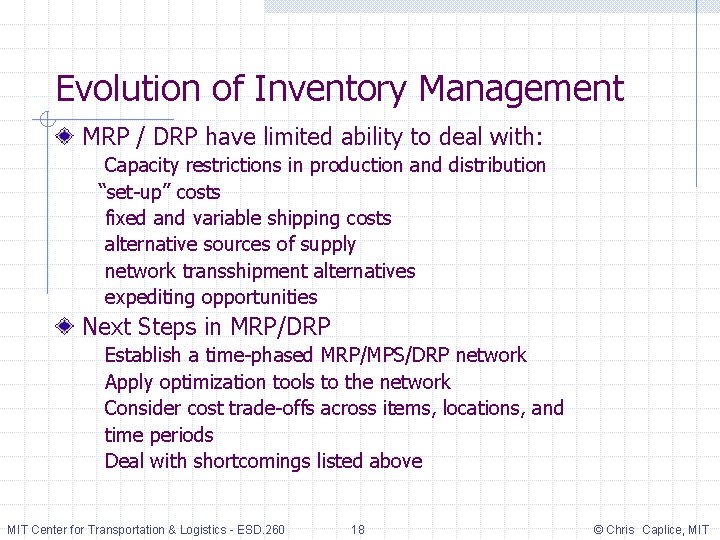
Evolution of Inventory Management MRP / DRP have limited ability to deal with: Capacity restrictions in production and distribution “set-up” costs fixed and variable shipping costs alternative sources of supply network transshipment alternatives expediting opportunities Next Steps in MRP/DRP Establish a time-phased MRP/MPS/DRP network Apply optimization tools to the network Consider cost trade-offs across items, locations, and time periods Deal with shortcomings listed above MIT Center for Transportation & Logistics - ESD. 260 18 © Chris Caplice, MIT
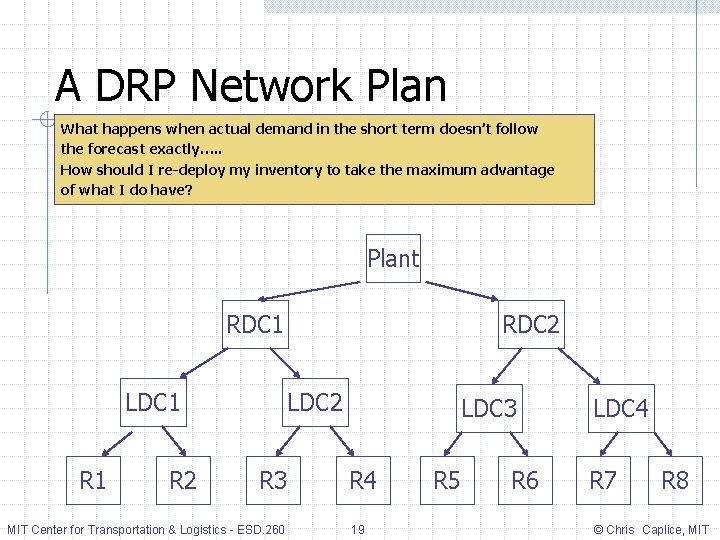
A DRP Network Plan What happens when actual demand in the short term doesn’t follow the forecast exactly…. . How should I re-deploy my inventory to take the maximum advantage of what I do have? Plant RDC 1 LDC 1 R 2 RDC 2 LDC 2 R 3 MIT Center for Transportation & Logistics - ESD. 260 LDC 3 R 4 19 R 5 R 6 LDC 4 R 7 R 8 © Chris Caplice, MIT
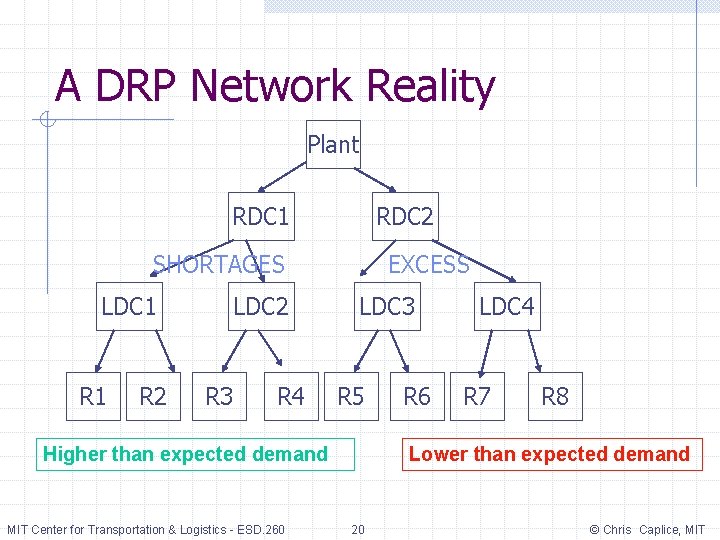
A DRP Network Reality Plant RDC 1 RDC 2 SHORTAGES LDC 1 R 2 LDC 2 R 3 R 4 EXCESS LDC 3 R 5 Higher than expected demand MIT Center for Transportation & Logistics - ESD. 260 R 6 LDC 4 R 7 R 8 Lower than expected demand 20 © Chris Caplice, MIT
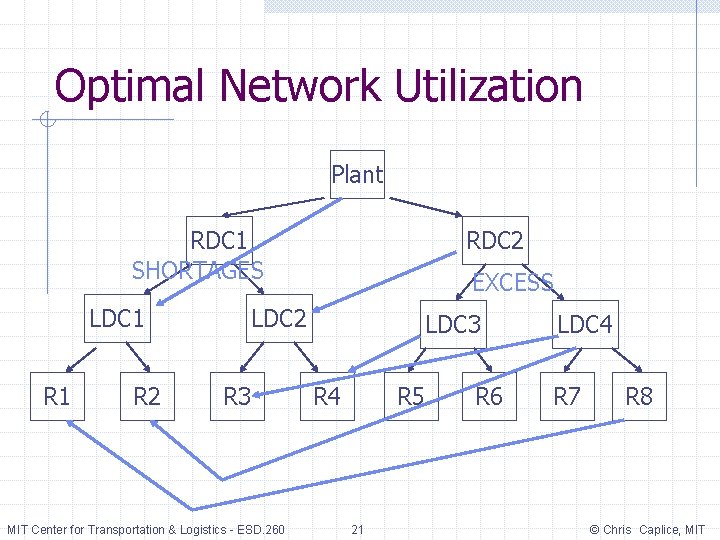
Optimal Network Utilization Plant RDC 1 SHORTAGES LDC 1 R 2 RDC 2 EXCESS LDC 2 R 3 MIT Center for Transportation & Logistics - ESD. 260 LDC 3 R 4 R 5 21 R 6 LDC 4 R 7 R 8 © Chris Caplice, MIT
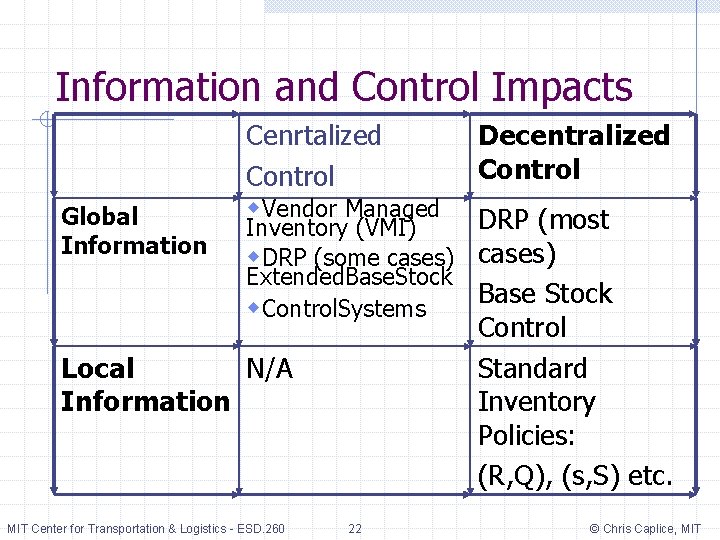
Information and Control Impacts Global Information Cenrtalized Control w. Vendor Managed Decentralized Control DRP (most Inventory (VMI) w. DRP (some cases) Extended. Base. Stock Base Stock w. Control. Systems Control Standard Inventory Policies: (R, Q), (s, S) etc. Local N/A Information MIT Center for Transportation & Logistics - ESD. 260 22 © Chris Caplice, MIT
- Slides: 22