Inventory Management Definition of Inventory Management Inventory management


 Store has to follow the minimum")

 It is")
 GOODS")

 is an unique identifier for each")


 – 2. Subdepartment:")


: Stock Turn Table Brand Total /val Val.")
 – Stock to Sales Ratio • •")
 – Stock to Sales Ratio • How do")
 – Days of Supply • • Days of")
 – Turn • • • We know that")
 – Turn • Now, take this report and")
 – Sell Through Percentage • • Sell Through")
 – Gross Margin Return on Investment • •")
 – Gross Margin Return on Investment • •")


- Slides: 53
Inventory Management Definition of Inventory Management • Inventory management is primarily about specifying the size and placement of stocked goods. Inventory management is required at different locations within a facility or within multiple locations of a supply network to protect the regular and planned course of production against the random disturbance of running out of materials or goods. • The scope of inventory management also concerns the fine lines between replenishment lead time, carrying costs of inventory, asset management, inventory forecasting, inventory valuation, inventory visibility, future inventory price forecasting, physical inventory, available physical space for inventory, quality management, replenishment, returns and defective goods and demand forecasting.
Inventory management • Activities employed in maintaining the optimum number or amount of each inventory item. • The objective of inventory management is to provide uninterrupted production, sales, and/or customer-service levels at the minimum cost. • Since for many companies inventory is the largest item in the current assets category, inventory problems can and do contribute to losses or even business failures
Importance and advantages of inventory management • Inventory management is important for managing costs, detecting shrinkage and maximizing the customer shopping experience. • Prevents stock-outs and overstock using instore location level tracking • Maximizes staff availability to customers for improved customer service • and satisfaction • Streamlines in-store processes for increased efficiency • Streamlines management of store-labor expenses for reduced costs
Importance and advantages of inventory management • Improves control of inventory management, for reduced carrying costs • Minimizes the need for extensive staff training • Facilitates the rapid delivery of merchandise to the sales floor, so that customers find the items they want • Assists with maintaining accurate perpetual inventory with full inventory stock count capability
Functions of inventory Controller • Track and manage all of the inventory for the business • Evaluate how well some groups of products do in sales • Provides analysis for comparison shopping with competitors • Collect data on the sales and inventory of individual stores using SKU • Allows you to accurately review your inventory
Functions of inventory Controller • Ensure Inventory accuracy and maintain Inventory integrity at the store • Maintain Out of stock / Over stock Reports Weekly and the same has to send to respective store managers and ASM • Ensure that the daily Brand stock count as a part inventory checks with respect to physical stocks vs. system stocks. This is done to reduce stock variance. • Weekly Brand analysis • Maintain Out of stock / Over stock Reports Weekly and the same has to send to respective store managers • Allocation Vs picking efficiency (Ensure the allocation qty and picking qty are same 100%)
Reasons to have Good inventory control • The process of managing the timing and the quantities of goods to be ordered and stocked, so that demands can be met satisfactorily and economically. • The possible reasons for carrying inventories are: uncertainty about the size of future demands; uncertainty about the duration of lead time for deliveries. • Continuous-review and fixed-interval are two different modes of operation of inventory control systems. • The former means the records are updated every time items are withdrawn from stock. • When the inventory level drops to a critical level called reorder point, a replenishment order is issued. • Under fixed-interval policies, the status of the inventory at each point in time does not have to be known. The review is done periodically. • Uncertainties of future demand play a major role in the cost of inventories. That is why the ability to better-forecast future demand can substantially reduce the inventory expenditures of a firm.
Order placing and issue purchase order to vendor Vendor Head Office Stocks Transfer to Warehouse Stocks Receipt Confirmation to HO • Recpit of stocks • Checking as per purchase order • Scanning process • Cross dock(GRN) • Picking as per store wise • Stn Creation • Dispatch to Store
Warehousing operations to Retail stores • Receiving consignment from vendor. • Inward assistant has check the docket no and box’s while receiving the consignment. • If box’s are in open condition. Inward assistant has to take open delivery in front of the courier staff and if any shortages have come, he has to mention the shortages in the POD and he has to inform to the warehouse in charge. • Security has to enter the docket details in the inward register. • Inward Assistant has to check the purchase order and take the R. A Printout and handover to the floor staff. • Floor staff has to check the style & sku, and then he will fill the R. A and tally the invoice qty and recd qty. • If any shortage has come floor staff has to inform the warehouse in charge, he has to check manually and Signed the R. A, then he has to send the shortage report to the vendor and Ho Accounts dept.
Warehouse operations to Retail stores • Floor staff has to segregate the stocks as per vendor allocation for fresh stocks) and he will pack the material location wise and stick the vendor slip, it contains Vendor name, RA no, Style name and to location. • Floor staff to send the filled RA and invoice to GRN dept. • Grn dept to verify the qty against the invoice and RA and accept the stocks in MMS, fire GRN Reports and it will send weekly basics to HO accounts • After complete the Grn, the scanner to scan the material for stn preparation as per the vendor allocation (for fresh stocks) or as per buyer allocation list • After complete the stn, system operator take the stn printouts and handover to dispatch section • Dispatch dept will cross check the stn qty , stn no, no of boxes and to locations, he will handover the stns to security for outward. • Security will enter the outward register and he will prepare the NRGP (Nonreturnable gate pass) and handover to the transporter
Supply chain process in store • Supply Chain On time Performance of Inward & Outward Processing of stns • While receiving the stocks from transporter, supply chain executive has to check whether boxes are received in good condition or not, if he found any damage then he has to mention the same in POD copy. • Ensure the stocks received at the stores are scanned in MMS and verify with the stn • If any shortage or excess the supply chain person has to informed to respective warehouse before accepting the stn in MMS • Ensure that no stns has been bounced back without approval mail from the concern warehouse/stores • After completing the receiving process the supply chain executive has to inform the floor supervisor to receive the stocks
Retail store Inventory measurements Minimum Display Quantity (MDQ) Store has to follow the minimum stock (MDQ), the retailer must have on display at any point. This is determined by the area that has been allocated to the category and the minimum variety that must be maintained on display. Base Stock Also known as Minimum Base Quantity (MBQ) refers to the minimum level of stock the retailer plans carry in a store. This includes the Minimum Display Quantity (MDQ) and the back up stock (if there is a storage section in the store). The Base stock figures are flexible and may change basis the season.
Stock Replenishments Inventory Replenishment: Replenishment as "filling again by supplying what has been used up. " This definition does not adequately address the business conditions in retail inventory management. After all, if an item recently sold several hundred pieces for an ad that has concluded – should several hundred more be brought in to replace what has been sold? When looking at retail replenishment, a more appropriate definition would be "acquiring product on a recurring basis to support anticipated need. “ Replenishment is also a process that occurs regularly. If vendors only offer merchandise in a limited number of shipments – common in the fashion industry – merchandise planning and allocation should be used to support ordering. While replenishment can support these situations, the time required for item setup and forecasting often outweighs the savings from the automation of forecasting and ordering.
Terminology used in a fashion retail store inventory management SKU (stock-keeping unit) It is a unique identifier for each distinct product and service that can be purchased. The usage of SKU is rooted in data management, enabling the company to systematically track its inventory or product availability, such as in warehouses and retail outlets. They are often assigned and serialized at the merchant level. UPC CODE A UPC Code is a method used by manufacturers to identify products quickly. UPC stands for "Universal Product Code. " A UPC code generally has two parts - numbers, which people can read, and a series of bars which can be scanned and tracked by computers
Terminology used in a fashion retail store inventory management GRN (GOODS RECEIPT NOTE) GOODS RECEIVED NOTE is a document produced when goods are received into the company/factory. It will usually accompany goods to any inspection and is used to check against invoices before payment STN (Stock Transfer Note) Stock Transfer Note is sent along with the material during sending the stocks between warehouses to store or store to store transfers, and store to warehouse. RTV (Return to Vendor) The process of returning to a vendor any items that were previously received on a PO, the same has to return to vendor through proper documents (Raising debit note to vendor)
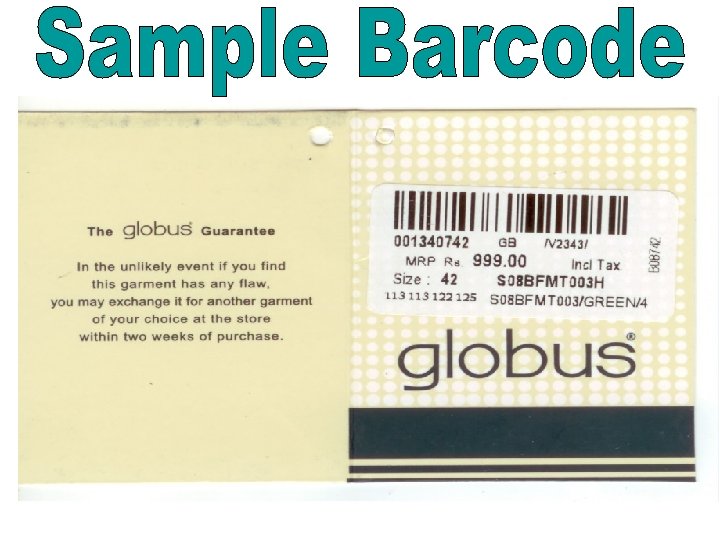
Understand How to read sku`s and barcodes • What is a sku?
• Stock Keeping Unit, or SKU “S–K–U”) is an unique identifier for each of the distinct products and services that can be ordered/sold from a supplier. Usage of the SKU system is rooted in data management, enabling the merchant to systematically track their inventory
• In this 1340742 is the sku no. • GB is the brand name (Globus). • Mrp is the Maximum retail price. • V 2343 is the vendor (Manufacturer code) • Size is 42 • so 8 bfmt 003 h is the style code
• 113 -122 -125 • 113 is the department • 113 is the sub department • 122 is class • and 125 is subclass the above product is from dept 113 (Mens year long), sub department 113 (Top wear formals), class 122 (Fashion formal shirt) and subclass 125 (stripes
– Another example 211 -210 -211 -210 This product is from department 211 (Ladies Fashion), Sub dept 210 (Top wear casuals), class 211 (T-shirts) and sub class 210 (Solids) (Show the merchandise hierarchy)
• style is a design which are made according to the forecast and market trends. Each product will have a style no and it may not be unique like sku no. The reason is in each styles there may be different options (Colors ) available. For example the above mentioned style (so 8 bfmt 003 ) will have another color (Say yellow) then in the detailed description it will me mentioned as so 8 bfmt 003/yellow/42. Means this is the same style but a different color
Understand how merchandise is classified – 1. Department: 100 (Men's ) – 2. Subdepartment: 101 (Shirts) – 3. Class: 101 (Formals) – 4. Subclass: 101 (Solids)
Ladies • Dept 200: Ladies National Brand • Dept 211: Ladies Fashion • Dept 212: Ladies Seasonal garments • Dept 213: Ladies Year long • Dept 230: Ladies Indian
Men's • Dept 100: Men's National Brand • Dept 111: Men's Fashion • Dept 112: Men's Seasonal garments • Dept 113: Men's Year long
Kids, Denims and Sports wear • Dept 300: Kids National Brands • Dept 320: Kids own brand • Dept 400: Denims national Brands • Dept 700: Sports wear national brands • Dept 900: Events (Fine jewellery, Sunglasses or any other products for a specific event)
What is Planogram • How do you think buildings are constructed ? With the help of architectural drawings. An architectural drawing creates a rough print of the building on paper which gives an idea about the floor plans, location of rooms, lobby and so on. In retail a planogram replaces architectural drawings. Once a retailer opens a store, he needs to have a rough idea about the store plan. • A planogram helps in the same. Planograms are similar to architectural drawings and help the retailer to understand where the merchandise should be stocked in order to catch the customer’s attention and make the maximum impact. • Planograms are nothing but diagrams which give the retailer an idea how and where to place the merchandise to attract the customers into the store
Planogram • Planograms, also known as plano-grams, plan -o-grams, POGs, are a visual representation of a store's products or services, and are considered a tool for visual merchandising. • "It is a diagram or model that indicates the placement of retail products on shelves in order to maximize sales. • Planograms help organizations to plan how their stores are going to look.
Planogram • A planogram is often received before a product reaches a store and is useful when a retailer wants multiple store displays to have the same look and feel. Often, a consumer packaged goods manufacturer will release a new suggested planogram with their new product, to show it relates to existing products in said category. Today, planograms are used in a variety of retail areas. • A planogram defines which product is placed, in which area of a shelving unit and with which quantity. The rules and theories for the creation of a planogram are set under the terms ofmerchandising. • It is primarily used in the retail sector. Fast-moving consumer goods organizations and supermarkets largely use text and box based planograms that optimize shelf space, inventory turns, and profit margins. • Apparel brands and retailers are more focused on presentation and use pictorial planograms that illustrate the look and also identify each
When and how is Planogram prepared • When is a Planogram Prepared ? • A Planogram ideally should be prepared before the merchandise reaches the retail store. The retailer should be very clear where he wants to place his products to impress the customers. • How is a Planogram Prepared ? • There are various software available which help to create planograms. These software's help the retailers to draw three dimensional diagrams of the store and help them visualize the overall image of the store.
Advantages of Planogram • A retailer can make the best possible use of the available space with the help of planograms. • The merchandiser can actually create an attractive display to entice the customers with the help of planograms. • Planograms indirectly also contribute in maximizing the sale of the merchandise and thus generate revenues for the store. A cluttered store fails to attract the customers. • The planograms help the retailer to arrange the products in the best possible way for the customers to pick up almost everything.
Space Planning • Retail Space Planning is an ambiguous description of several facets of retail operation. By one definition the term, retail space planning refers to product placement or departmental adjacencies. Another definition describes retail space planning as the study of the distribution of space allotted to particular categories in relationship to their productivity and their inventory balances. Still another definition characterizes retail space planning more literally and refers instead to store fixture layouts. • The locations of product placement, for example, must not only efficiently utilize store space, but must also make sense to shoppers. The plot thickens here, however, because when we say “shoppers” we imply a collective mentality. No such collective mentality exists, of course, so a location that makes sense to one shopper does not necessarily make sense to the next or to the most. This very thought process is the rationale for cross merchandising. Cross merchandising is a retail space planning term that refers to placing the same product in more than one location of your store, and perhaps each location that might make sense to shoppers. This technique, of course, must be balanced with the restrictions of limited store space. • Retail space planning as regards the sales and inventory productivity of individual departments. Space planning can help through the process of which departments to expand which ones to contract. •
Why Space Planning • Retailers roll their dice to gain market spotlight for their merchandise. A well planned and managed space in a retail store is the touchstone for a retailers success in business. • Apparel retailing is a mature and extremely competitive arena which has to deal with demanding, diverse and well-informed consumers. The changing retail landscape is now adding more pressure on the retailers to retain their slice of the pie in the global, as well as the domestic market. Apparel retailers require a proper understanding of the consumers psychology, and play their cards right. Attracting shoppers and converting potential clientele into long term and loyal customers depends upon how the retailer is able to portray his merchandise, and the quality of his customer service. Therefore, it is more important for a retailer to make optimum utilization of the space available in his store so as to create an appealing in store arrangement. • • Space planning had been in the retail structure since the time of inception of the retail business, but its applications, benefits, and dimensions keep evolving, reaching new heights with the passage of time. A well arranged store display attracts the shoppers, making them to check out the apparel merchandise, and influencing them to buy the clothing. Using the available space in a right manner will enable the retailer to accentuate his merchandise and arrange them in an optimum position.
Space Planning • Space allocation tools: • Space allocation tools are available that enables retailers to determine the optimum space for fixtures, and merchandise based on the analysis of product placement, usage and performance. Space allotment is done hierarchically with both top and bottom views of performance. A detailed planning for space allocation can be done through any of the following ways: Exact floor plans can be obtained through CAD drawing with precise measurements. Appropriate square footage can be assigned for each merchandise category. Detailed planograms can be prepared striking a happy balance of available space, and merchandise. A detailed plan can be prepared, considering detailed fixture, and component dimensions. • •
Space Planning • Benefits of Space Planning: • Adequate space planning techniques enable the retailer to have end-to -end control of merchandise. This display will attract more customers, minimizes stockouts and operating costs, enables inventory productivity, and increases the financial performance and ultimately more profits for the retail outlet. Retailers can drive top line sales, and achieve good overall returns on their invested amount of capital. • • • The traditional space planning process is altered meeting with the localized needs of customers. Retailers should move away from developing prototype store layouts, as no two stores look alike. They should maintain store specific plans by gaining more knowledge about their stores. Effective planning of the retail space and managing it in a right way is the key factor in the lifecycle of merchandise planning and execution. More retailers are adopting the fact that space management is an integral part of any retail business.
Types of Merchandise Placement/space planning: • Visual Product Placement - Visual Product Placement refers to a technique where the products are placed in a way to immediately catch the attention of the customers walking into the store. • Types of Visual Product Placement • Horizontal Product Placement • According to horizontal product placement, products are placed side by side on shelves to offer a wide range of options to the customers. • Vertical product placement • The vertical product placement displays the merchandise on more than one shelf level. • Block Placement • According to block placement of products, the related products or merchandise belonging to a similar family are stocked at one place together under one common umbrella.
Types of Merchandise Placement/space planning: • Commercial Product Placement • Commercial product placement takes into account the brand value of the merchandise. Every customer has a perceived image of the merchandise which decides its placement in the store. A product which has several takers would definitely get the best position as compared to something which does not contribute much to the revenue of the store. • Market share product placement plan works on a simple strategy: • A product which generates the maximum revenue for the store should ideally be placed at a prime location for the customers to notice it and immediately buy it. • Margin Product Placement • According to Margin product placement, the more a product earns profit for the retailer, the better the location it is placed.
Retail Inventory Metrics: Key Performance Indicators (KPI's): Stock Turn Table Brand Total /val Val. Contribution % Closing Quantity sal/day stk in days Inv turn over MS 407723 19 6974 141 49 7. 4 LEE COOPE 203910 9 1717 57 30 12. 1 2 EXTREMZ 223450 10 3437 84 41 8. 9 NEXUS 471404 22 5210 123 42 8. 6 ZYNC 126538 6 2126 59 36 10. 1 90387 4 2209 33 67 5. 5 SCARLET 335873 16 4408 82 54 6. 8 ACCESSORI 130592 6 4421 144 31 11. 9 LINGERIE 171119 8 14610 212 69 5. 3 2160996 100 45112 934 48 7. 6 SPORT Total
Retail Inventory Metrics: Key Performance Indicators (KPI's) – Stock to Sales Ratio • • Stock to Sales Ratio is a key statistic for measuring whether or not you are overstocked. You can see when someone has too much inventory because their inventory is all over the place. Look in your stock room. Do you have a bunch of merchandise that's been sitting there for a while or even been sitting there for years? If you said “yes” to that question, that is the sign that you've got too much inventory! And when you've got too much inventory in the store, sitting around not doing anything but collecting dust, your money is tied up in that inventory not able to be reinvested. It's time to move that stuff because you need to purchase other inventory that will actually turn. How does Stock to Sales Ratio work? Stock to Sales Ratio is the ratio of the inventory available for sale versus the quantity actually sold. For every unit sold, how many units were on hand? For every single sale I made of that particular item, how many did I have in stock at that time? Stock to Sales Ratio is the exact inverse of Sell Thru Percentage which will be covered in its own article. Simplified, this means that if I had 30 dress shirts in the store room when I sold 10 out of the 30, then I know that in order to sell 10 dress shirts, I would always have to have 30 of those dress shirts in the store room. You've got to have a certain amount of an item in inventory in order to sell a certain amount of that item. Knowing this about each inventory item keeps your inventory at the right level, not too high and not too low. If the Stock to Sales Ratio rises, with an increase in inventory and there isn't an accompanying rise in sales, then you are adding more stock without increasing sales. It's kind of interesting how that can happen. Obviously increased stock without the accompanying increase in sales will reduce your profitability. If this happens, that is the time to hold off on purchasing any more of that item and work on selling down the quantity on that item until it's time to reorder based on the Turn report and lead time to restock it.
Retail Metrics: Key Performance Indicators (KPI's) – Stock to Sales Ratio • How do you know if you have too much inventory? Or too little inventory? You can't walk into the stock room and look at your shelves of merchandise that can be put on the floor and guess whether or not you have enough inventory. • The Stock to Sales Ratio report from your POS will tell you where you stand regarding too much or too little. Keep an eye on the Turn of your inventory, then cross check it with Stock to Sales Ratio and the lead time to restock. Balance those things and you will keep the right amount of inventory on hand. • You can use this formula to calculate and manage your stock accordingly: Averaged Units of Inventory Available ÷ Units Sold. This will reduce your Stock to Sales Ratio as low as possible, without losing sales. • Keeping an eye on this report will help keep your money out of slow turning stock and into merchandise that will turn over quickly.
Retail Metrics: Key Performance Indicators (KPI's) – Days of Supply • • Days of Supply. Simply put, Days of Supply means how long it will take you to sell out of your present stock, assuming that sales continue at the same rate as recent sales have been. This is weighed against a time frame, like 30, 60 or 90 days. Days of Supply is a great statistic to use for predicting the future. It's kind of like having a real crystal ball right on your desk. The information contained in this report/statistic lays it all out in a clean and concise way of telling you how much longer it will take to sell a particular piece of merchandise based on what's been happening saleswise in your store. For example, you have 1000 t-shirts and over the last 30 days you've sold 250 of them. Based on how many have been sold over the last 30 days, it will take another 90 days to sell the remaining 750 t-shirts. So, for these 1000 pieces of inventory, the Days of Supply equals 120 days. In essence, Days of Supply analyzes the last period of sales and based upon that rate, gives you the amount of days left to sell off the remaining merchandise. . Putting this information into practical use, you would then want to make sure Days of Supply on a certain item matches up with the lead time to restock it. You don't ever want to run into the problem of having Days of Supply be less than the time it will take to get the items in. In that case, you would miss out on sales because the sell-out and restock time frames did not overlap. Instead, you ran out of an item before the shipment came in to restock it. This can have bad effects on overall sales in the store, too, if the item you are out of stock on is a hot seller at a critical time of year or you lose customer loyalty because you're out of stock on something. Your goal here is to reduce your Days of Supply to match the lead times without losing sales, plain and simple.
Retail Metrics: Key Performance Indicators (KPI's) – Turn • • • We know that Turn is how many times an individual inventory item is replaced in the course of a year, what your average stock level is and how many times per year that amount is sold out and restocked. This is a very critical statistic to monitor because it will tell you when to order, how much to order, what to sell and how to sell it. An easy example is if you have an average inventory of 100 jackets in a year and you sell 100 jackets every 4 months, your inventory "turns over" or is totally replaced, 3 times per year. Therefore, your turn would be 3 on those jackets. Turn is often increased by reducing selling price. However, this obviously reduces profit. So if your cost on the stock of jackets is $50 and you sell them at $99. 99, you have a profit of $49. 99. But, if you find that you need to increase the turn and the only way is to reduce the price, you will eat into the profit of $49. 99. A balance needs to be reached between the proper turn, and the proper profit margin. The first things you will see on your Turn report are the inventory items you have in huge quantity that have a long turn. The piles of inventory that have a long turn have precious dollars tied up, unable to be reinvested. Now that you've seen that, stop ordering any more of that item, run a special, promote that item and get rid of it as quickly as you can. Move that product off the floor in whatever way you can. No one is ever happy to do a mark down, but there's a plus side to doing a mark down and selling down that pile of inventory at a reduced rate. The plus side is that when you mark it down and the inventory starts moving, money is now coming in and can be reinvested, whereas before you did the mark down and the inventory started to move, you weren't getting your money untangled and back in your pocket. It can be quite amazing what happens when you get an old pile of merchandise suddenly moving out of the store and how that affects the rest of the merchandise and sales.
Retail Metrics: Key Performance Indicators (KPI's) – Turn • Now, take this report and look at it along with the Days of Supply and see where you can be smarter in purchasing and reordering decisions. These reports are the place to start helping evaluate what your next plan of action will be. Back to the pilot reference above. There are several things you need to look at to navigate your store in the most profitable way. • The Days of Supply and Turn reports are the starting points because you need to look at both of these reports and get the data from each in order to make the best decisions. The all encompassing goal of retail is to make money and make as much money as you can with little loss. Having a good turn with the most profit is ideal. • You want to get your money out of a piece of merchandise that has a long turn and get it into something that turns faster. This will get you more profit more quickly. So, take your reports on Turn and go see what items you need to get moving out of the store and free up your money so you can reinvest it into some merchandise that will turn quicker and make more money.
Retail Metrics: Key Performance Indicators (KPI's) – Sell Through Percentage • • Sell Through Percentage is calculated like this: Average Units Sold ÷ Average Units of Inventory Available. Sell Through Percentage. It's the exact inverse of Stock to Sales Ratio. (Average Units of Inventory Available ÷ Units Sold. ) (Stock to Sales Ratio is key to knowing whether or not you are overstocked in certain items. ) Seems simple enough, but let's explore this further because I really want to make sure this explanation is helpful for you. . How does Sell Through Percentage play a part with Days of Supply, Turn and Stock to Sales Ratio? Using just one or two reports isn't going to take you to a great revenue generating store. You want to utilize the key reports from your POS. So, Sell Through Percentage comes next in after Stock to Sales Ratio. Ask yourself, do you really need to know what percentage of inventory you can sell? Yes, absolutely this is vitally important. When it comes to Sell Through Percentage, it is especially important for seasonal merchandise. Since the goal is to be out of stock of seasonal merchandise by the end of the season, knowing how much to have left, along with validated statistics at hand, is more profitable than trying to guess at how much to buy for the coming year. Who wants to have to guess at things? I know I don't and if there’s already a way to figure it out, then by all means use it. Plan out the percentages to be sold by month using your year-to-date sales of seasonal merchandise. This helps ensure that you are out of stock by the end of the season. Keep in mind this is a percentage and you may not actually sell out all items, but using this calculation can definitely help get you as close to sold out as possible, which is what I want to happen in your store. This also gives you better control for accurate stock and sales management. Who wouldn't want that? !And in closing. . . with a better understanding of the KPI's mentioned in this article, you will make your store more profitable.
Retail Metrics: Key Performance Indicators (KPI's) – Gross Margin Return on Investment • • For every dollar invested, how many dollars did I get back? A business is measured on cost and price. All success is built around these two things. How much did I pay for the merchandise (cost)? How much did I sell the merchandise for (price)? When you look at the items for sale in your store, ask yourself: how much did I invest in this inventory and what profit am I going to get out of it? If you're going to spend money on inventory, mark it up and sell it, you do have to consider these factors in order to be profitable. If you invest a lot in merchandise that doesn't sell very well then you have to mark it down to move it out of the store in order to get your money out of it. That investment didn't return as much, so in that case, . By determining this sooner rather than later, you can free up the investment you made in the poor selling merchandise and reinvest it in a better choice. GMROI calculates the return based on the gross margin from sales. For example, if you purchase $2, 000 of inventory and sold it all in the same year for $6, 000, your profit would be $4, 000. The return on your investment of $2, 000 was $4, 000. The GMROI in this example is $4, 000/$2, 000 = 2. GMROI is closely related to Turn. If your Turn increases, your average inventory cost will be lower (relative to your profit), and thus the greater the return on your investment and that's what everyone likes best: low investment with a high return. Your merchandising goal is to increase the GMROI, by keeping your inventory turning, at high margins.
Retail Metrics: Key Performance Indicators (KPI's) – Gross Margin Return on Investment • • • Always remember to set objectives for the merchandise you are buying. When you purchase merchandise, you usually have an idea of how much you want to sell over a certain amount of time. For example, when buying a new style of jeans, set a target for how many pairs should be sold in some reasonable time frame like, sell 12 pairs in the first week. Have this amount in mind when you run your KPI reports. This way you will know if the item is performing according to your expectations. If you only sold 6 pairs the first week and were expecting 12 pairs to be sold, you know you need to change something in order to meet your expectation of 12 pairs being sold. Then you can take quick decisive actions to sell off that item before you get stuck with it and have to mark it down thus lowering your profit. The main focus of GMROI really just comes down to two basic things – cost and price. How much did it cost you to make a profit on a particular item? And gauging how much your profit margin is on that particular item to make it worth the investment you made to make that profit. As a retailer, it comes down to one simple question: do I have the right inventory in the right place at the right time? you will better manage your inventory, gross profitability and have less mark downs in your store. Your point of sale, properly set up and used, will help give you all of this information so that you can optimally manage your store(s). So, here's to higher profits and better store management!
Measuring Space Productivity • • • Stores has customers steadily coming through the doors, employees are busy and there is the frequent 'cha-ching' of the cash register, but how well is your business really doing? One simple way to know if business is good, is to compare this year's same-store sales data to last year's revenue. What if your store has been open less than a year? It is critical for the success of your business to constantly work towards improving not only the efficiency of employees, but the productivity of the store's selling space and inventory as well. This can be achieved by using various retail math formulas and calculations based on sales. • Performance of Selling Space • • Sales per Square Foot The sales per square foot data is most commonly used for planning inventory purchases. It can also roughly calculate return on investment and it is used to determine rent on a retail location. When measuring sales per square foot, keep in mind that selling space does not include the stock room or any area where products are not displayed. Total Net Sales ÷ Square Feet of Selling Space = Sales per Square Foot of Selling Space • • Sales per Linear Foot of Shelf Space A retail store with wall units and other shelf space may want to use sales per linear foot of shelf space to determine a product or product category's allotment of space. Total Net Sales ÷ Linear Feet of Shelving = Sales per Linear Foot
Measuring Space Productivity • Sales by Department or Product Category • Retailers selling various categories of products will find the sales by department tool useful in comparing product categories within a store. For example, a woman's clothing store can see how the sales of the lingerie department compared with the rest of the store's sales. • Category's Total Net Sales ÷ Store's Total Net Sales = Category's % of Total Store Sales
Measuring Productivity of Staff • Staff costs are usually the 3 rd largest expense. Just like floor space must be ‘productive’, staff must be productive. Staff productivity is measured as Sales/ Employee, or as Sales/ Hours worked. The business owner looks at sales dollar value generated per employee (including non-sales staff). This gives the owner an indicator of how many people can be employed whilst remaining profitable Sales per Transaction. • A key point of employee goal-setting is to help your staffers become more productive. That’s why you don’t want to confuse activity with progress. Put systems in place for measuring productivity throughout your catalog company. Then live by those productivity measurements. Remember this mantra: What gets measured gets done. Create policies ensuring that the “urgent” doesn’t take precedence over the “important. ” And do everything you can to eliminate redundancies and busywork. Once you’ve set the measurements, give feedback, both formal and in real time. Establish ongoing evaluative processes so that employees receive managerial feedback on how well they’re meeting their goals. But don’t limit feedback to formal evaluations. Give it on the spot. Tell people in real time what they’re doing incorrectly, so they can fix it. But it’s even more important to tell them what they’re doing right or well. That’s spontaneous coaching, and it’s one of the most critical elements of an entrepreneurial culture. In fact, it’s the pathway to productivity. That kind of feedback refines the processes by which employees meet their goals today, and it paves the way for them to meet more ambitious goals in the future.
Measuring Productivity of Staff • • Sales per customer: The sales per transaction number tells a retailer what is the average transaction in dollars. A store dependant on its sales clerks to make a sale will use this formula in measuring the productivity of staff. Gross Sales ÷ Number of Transactions = Sales per Transaction Sales per Employee When factoring sales per employee, retailers need to take into consideration whether the store has full time or part time workers. Convert the hours worked by part-time employees during the period to an equivalent number of full-time workers. This form of measuring productivity is an excellent tool in determining the amount of sales a business needs to bring in when increasing staffing levels. Net Sales ÷ Number of Employees = Sales per Employee These are just a few of the ways to measure a retail store's performance. As retailers track these numbers month after month and year after year, it becomes easier to understand where the sales are generated, by which employees and how the store's merchandising can maximize sales growth.
Measuring Productivity of Staff • Items per cash memo= Total items/no of transactions • Sales per hour= Sales/Total hours worked • Transactions per hour= Total Transactions/hours worked. • Conversion rate= Total transactions/Total opportunities • ASP= Sales/Total items
Best Ways to Increase Retail Employee Productivity • • 1. Set Sales Goals - Employees want something to shoot for just as much as you want them to strive for that sales goal. Set and share the overall store's sales goals and then share their individual sales goal. Yes, this will be a time commitment and you are already time-crunched, but two things to remember: 1) it really only takes 2 -3 hours to crunch and update these numbers each month, 2) the dividends it pays back are at least triple the investment. It will also help to identify where someone is struggling and correct their weaknesses. Whether your employees earn commission or not, each one wants to make a contribution-they just need the tools to get there. 2. Train on Sales Process - A sales process is more than greeting the customer and thanking them for coming in. However, it doesn't have to be a complicated thing either. In its most basic format it looks like this: greet, open-ended question to assess needs, fulfill those needs, ring up sale and thank customer for their purchase. Training new hires as well as continuing refresher courses for the whole staff shows them the company is a viable, thriving business. 3. Provide Consistent Feedback - In the absence of communication, employees will make it up and usually what they make up is not what the company needs in the pursuit of success. Particularly with new employees, keep the feedback going daily. Your more established employees still need feedback, but more weekly rather than daily. The form of communications should be tailored to what resonates most with each employee. Some employees prefer a written note of "Good job juggling three customers simultaneously"; others prefer a verbal one-on-one. However you acknowledge their efforts, letting employees know when they are on the right track and where they need to improve is valuable. They want success for the store as much as for themselves. 4. Daily To-Do Sheet/Checklist - A daily sheet keeps everyone working toward the same goals and makes all team members aware of how their individual role is integral to the whole. Also, seeing tasks and goals laid out on paper leaves less room for the "Oh, I didn't know I was supposed to do that" and more space for overall success.
Best Ways to Increase Retail Employee Productivity • • 5. Use Employee Enthusiasm - Retail sales people are on the floor, listening to the client base, talking about new products and hearing needs. They often have fresh ideas as they see first hand what works and what doesn't. Asking for their input and then using their energy to roll out a product or program they fought for goes a long way to generating more sales. The more they see their ideas being used, the more enthusiasm they'll have for contributing to the overall store growth. Success builds on success. 6. Provide Opportunities for Advancement or Recognition - Whethere is a large promotion available for great performance or a small award for an employee who contributed above and beyond. If people feel their efforts are recognized and appreciated, they will strive to do more. 7. Conduct Quarterly Staff Meetings - No matter how small or large your staff, a quarterly meeting keeps everyone updated on goals attained, future challenges, new products coming in and programs to be launched. It's a good time to ask for feedback and encourage brainstorming on specific promotions. This is also one of the best opportunities to praise an employee or a team as public recognition are most highly valued. You may be doing two or three of these, congratulate yourself for that. Now, just add one each month to increase sales, decrease returns and keep customers happy. As you add a new tool, make sure to repeat it so it becomes a habit before adding another one. In this way, you build a structure that will keep paying you dividends for months and years to come.