
Inventory Management 12 Power Point presentation to accompany
- Slides: 76
Inventory Management 12 Power. Point presentation to accompany Heizer and Render Operations Management, Eleventh Edition Principles of Operations Management, Ninth Edition Power. Point slides by Jeff Heyl © 2014 Pearson Education, Inc. 12 - 1
Outline ► ► ► Global Company Profile: Amazon. com The Importance of Inventory Managing Inventory Models for Independent Demand © 2014 Pearson Education, Inc. 12 - 2
Outline - Continued ► ► ► Probabilistic Models and Safety Stock Single-Period Model Fixed-Period (P) Systems © 2014 Pearson Education, Inc. 12 - 3
Learning Objectives When you complete this chapter you should be able to: 1. Conduct an ABC analysis 2. Explain and use cycle counting 3. Explain and use the EOQ model for independent inventory demand 4. Compute a reorder point and safety stock © 2014 Pearson Education, Inc. 12 - 4
Learning Objectives When you complete this chapter you should be able to: 5. Apply the production order quantity model 6. Explain and use the quantity discount model 7. Understand service levels and probabilistic inventory models © 2014 Pearson Education, Inc. 12 - 5
Inventory Management The objective of inventory management is to strike a balance between inventory investment and customer service © 2014 Pearson Education, Inc. 12 - 6
Importance of Inventory ▶ One of the most expensive assets of many companies representing as much as 50% of total invested capital ▶ Operations managers must balance inventory investment and customer service © 2014 Pearson Education, Inc. 12 - 7
Functions of Inventory 1. To provide a selection of goods for anticipated demand to separate the firm from fluctuations in demand 2. To decouple or separate various parts of the production process 3. To take advantage of quantity discounts 4. To hedge against inflation © 2014 Pearson Education, Inc. 12 - 8
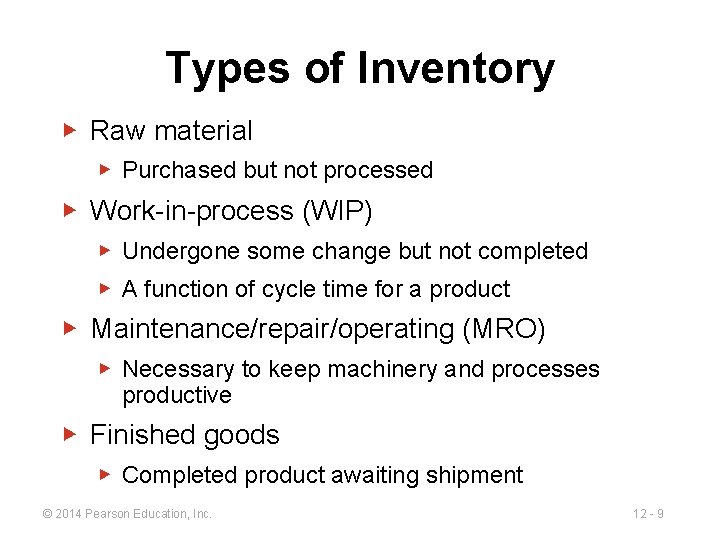
Types of Inventory ▶ Raw material ▶ Purchased but not processed ▶ Work-in-process (WIP) ▶ Undergone some change but not completed ▶ A function of cycle time for a product ▶ Maintenance/repair/operating (MRO) ▶ Necessary to keep machinery and processes productive ▶ Finished goods ▶ Completed product awaiting shipment © 2014 Pearson Education, Inc. 12 - 9
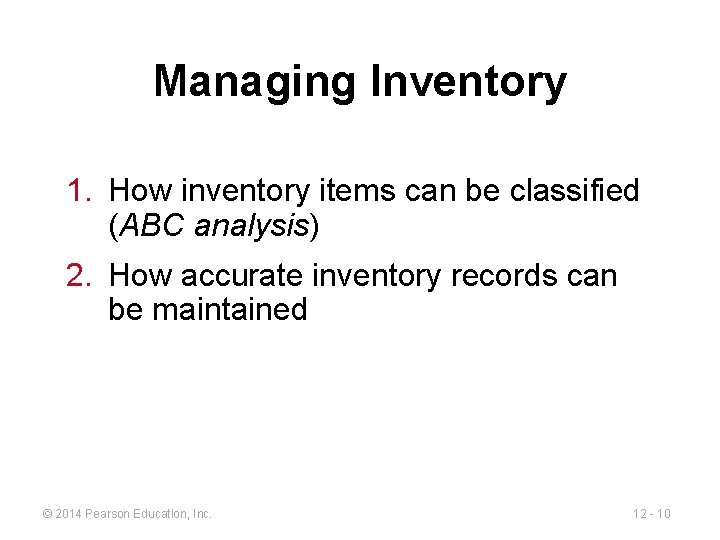
Managing Inventory 1. How inventory items can be classified (ABC analysis) 2. How accurate inventory records can be maintained © 2014 Pearson Education, Inc. 12 - 10
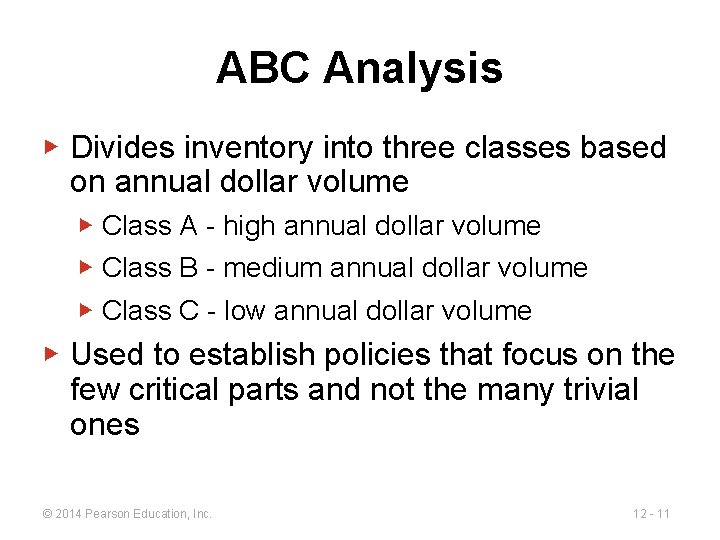
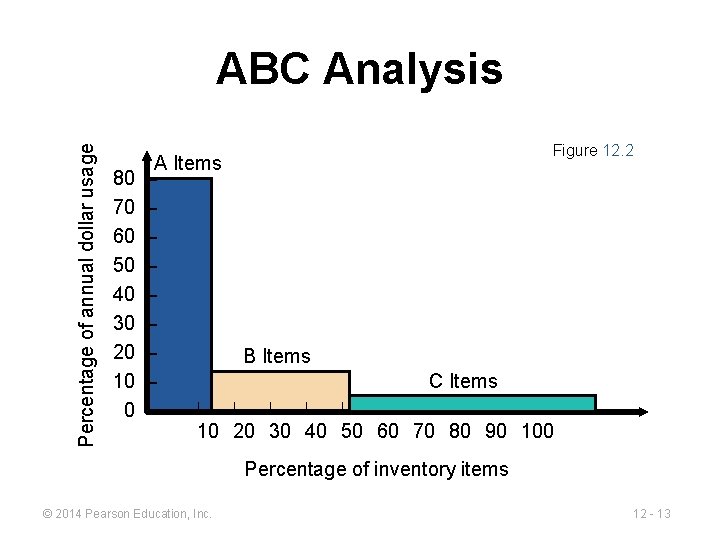
ABC Analysis ▶ Divides inventory into three classes based on annual dollar volume ▶ Class A - high annual dollar volume ▶ Class B - medium annual dollar volume ▶ Class C - low annual dollar volume ▶ Used to establish policies that focus on the few critical parts and not the many trivial ones © 2014 Pearson Education, Inc. 12 - 11
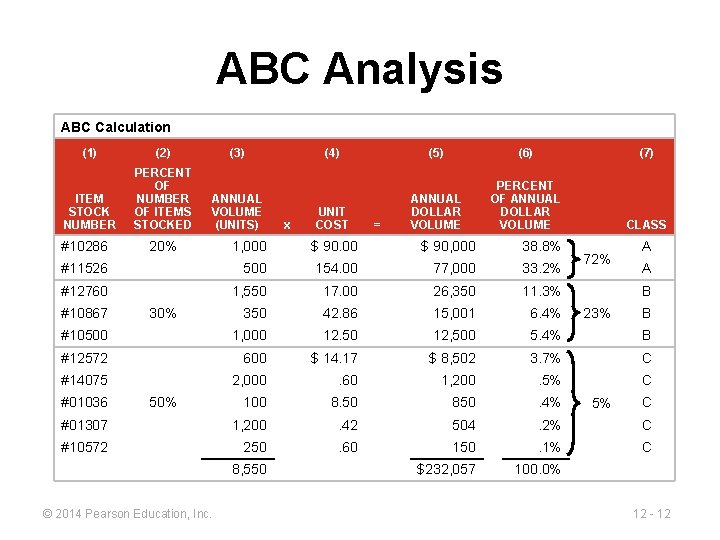
ABC Analysis ABC Calculation (1) (2) (3) ITEM STOCK NUMBER PERCENT OF NUMBER OF ITEMS STOCKED ANNUAL VOLUME (UNITS) #10286 (5) (6) (7) UNIT COST ANNUAL DOLLAR VOLUME PERCENT OF ANNUAL DOLLAR VOLUME CLASS = 1, 000 $ 90, 000 38. 8% #11526 500 154. 00 77, 000 33. 2% #12760 1, 550 17. 00 26, 350 11. 3% 350 42. 86 15, 001 6. 4% #10500 1, 000 12. 50 12, 500 5. 4% B #12572 600 $ 14. 17 $ 8, 502 3. 7% C #14075 2, 000 . 60 1, 200 . 5% C 100 8. 50 850 . 4% #01307 1, 200 . 42 504 . 2% C #10572 250 . 60 150 . 1% C $232, 057 100. 0% #10867 #01036 20% x (4) 30% 50% 8, 550 © 2014 Pearson Education, Inc. 72% A A B 23% 5% B C 12 - 12
Percentage of annual dollar usage ABC Analysis Figure 12. 2 80 70 60 50 40 30 20 10 0 A Items – – – – B Items C Items – | | | | | – 10 20 30 40 50 60 70 80 90 100 Percentage of inventory items © 2014 Pearson Education, Inc. 12 - 13
ABC Analysis ▶ Other criteria than annual dollar volume may be used ▶ ▶ High shortage or holding cost Anticipated engineering changes Delivery problems Quality problems © 2014 Pearson Education, Inc. 12 - 14
ABC Analysis ▶ Policies employed may include 1. More emphasis on supplier development for A items 2. Tighter physical inventory control for A items 3. More care in forecasting A items © 2014 Pearson Education, Inc. 12 - 15
Record Accuracy ► Accurate records are a critical ingredient in production and inventory systems ► Periodic systems require regular checks of inventory ► ► Two-bin system Perpetual inventory tracks receipts and subtractions on a continuing basis ► May be semi-automated © 2014 Pearson Education, Inc. 12 - 16
Record Accuracy ► ► ► Incoming and outgoing record keeping must be accurate Stockrooms should be secure Necessary to make precise decisions about ordering, scheduling, and shipping © 2014 Pearson Education, Inc. 12 - 17
Cycle Counting ▶ Items are counted and records updated on a periodic basis ▶ Often used with ABC analysis ▶ Has several advantages 1. 2. 3. 4. Eliminates shutdowns and interruptions Eliminates annual inventory adjustment Trained personnel audit inventory accuracy Allows causes of errors to be identified and corrected 5. Maintains accurate inventory records © 2014 Pearson Education, Inc. 12 - 18
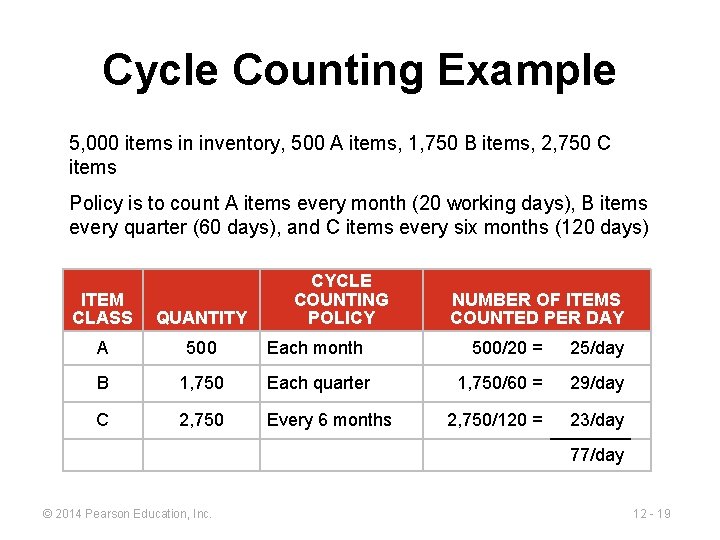
Cycle Counting Example 5, 000 items in inventory, 500 A items, 1, 750 B items, 2, 750 C items Policy is to count A items every month (20 working days), B items every quarter (60 days), and C items every six months (120 days) CYCLE COUNTING POLICY ITEM CLASS QUANTITY A 500 Each month B 1, 750 Each quarter C 2, 750 Every 6 months NUMBER OF ITEMS COUNTED PER DAY 500/20 = 25/day 1, 750/60 = 29/day 2, 750/120 = 23/day 77/day © 2014 Pearson Education, Inc. 12 - 19
Control of Service Inventories ▶ Can be a critical component of profitability ▶ Losses may come from shrinkage or pilferage ▶ Applicable techniques include 1. Good personnel selection, training, and discipline 2. Tight control of incoming shipments 3. Effective control of all goods leaving facility © 2014 Pearson Education, Inc. 12 - 20
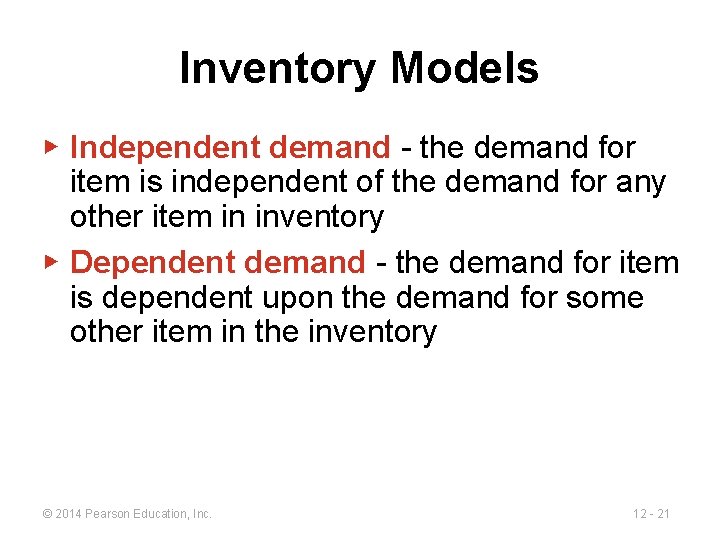
Inventory Models ▶ Independent demand - the demand for item is independent of the demand for any other item in inventory ▶ Dependent demand - the demand for item is dependent upon the demand for some other item in the inventory © 2014 Pearson Education, Inc. 12 - 21
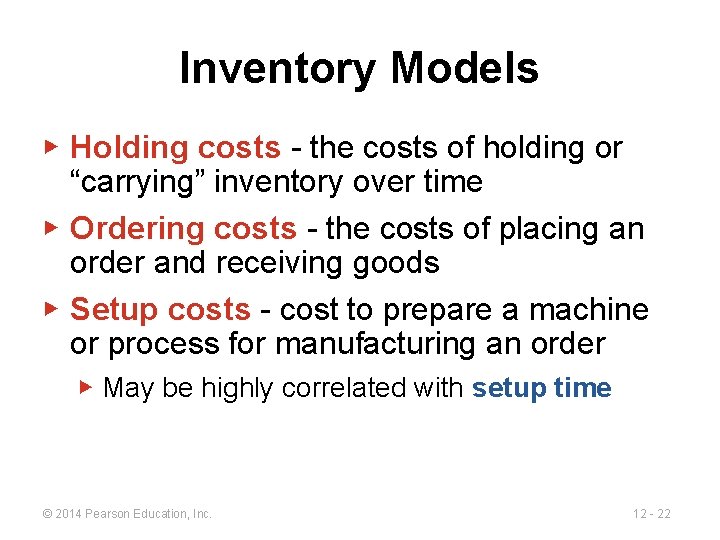
Inventory Models ▶ Holding costs - the costs of holding or “carrying” inventory over time ▶ Ordering costs - the costs of placing an order and receiving goods ▶ Setup costs - cost to prepare a machine or process for manufacturing an order ▶ May be highly correlated with setup time © 2014 Pearson Education, Inc. 12 - 22
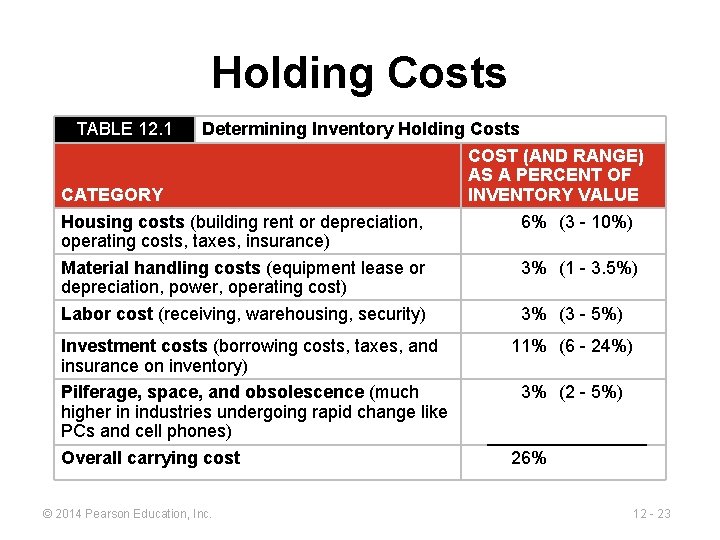
Holding Costs TABLE 12. 1 Determining Inventory Holding Costs COST (AND RANGE) AS A PERCENT OF CATEGORY INVENTORY VALUE Housing costs (building rent or depreciation, 6% (3 - 10%) operating costs, taxes, insurance) Material handling costs (equipment lease or 3% (1 - 3. 5%) depreciation, power, operating cost) Labor cost (receiving, warehousing, security) 3% (3 - 5%) Investment costs (borrowing costs, taxes, and insurance on inventory) Pilferage, space, and obsolescence (much higher in industries undergoing rapid change like PCs and cell phones) Overall carrying cost © 2014 Pearson Education, Inc. 11% (6 - 24%) 3% (2 - 5%) 26% 12 - 23
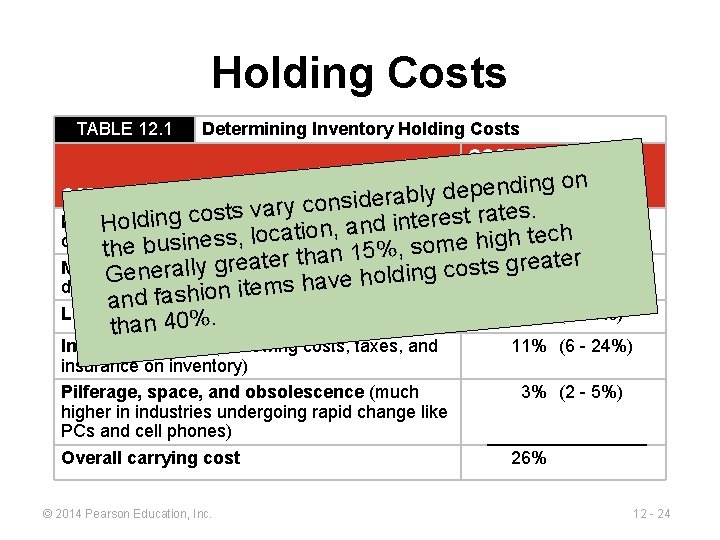
Holding Costs TABLE 12. 1 Determining Inventory Holding Costs COST (AND RANGE) AS A PERCENT OF n o g in d n pe de. INVENTORY CATEGORY VALUE ly b a r e id s n o c y r. (3 - 10%) es 6% t a osts va r t s e r ing c(building Housing costs rent or depreciation, e t in Hold , and n io t a c lo tech , h s operating costs, taxes, insurance) s ig e h in e s u m b o s e th 15%, n a h t r er- 3. 5%) t(1 e t a a e r g g Materialehandling costs (equipment lease or 3% s t y s ll o a r c e g G n oldin h e v a h s depreciation, power, operating cost) m e d fashion it n a Labor cost (receiving, 3% (3 - 5%) 0%. warehousing, security) than 4 Investment costs (borrowing costs, taxes, and insurance on inventory) Pilferage, space, and obsolescence (much higher in industries undergoing rapid change like PCs and cell phones) Overall carrying cost © 2014 Pearson Education, Inc. 11% (6 - 24%) 3% (2 - 5%) 26% 12 - 24
Inventory Models for Independent Demand Need to determine when and how much to order 1. Basic economic order quantity (EOQ) model 2. Production order quantity model 3. Quantity discount model © 2014 Pearson Education, Inc. 12 - 25
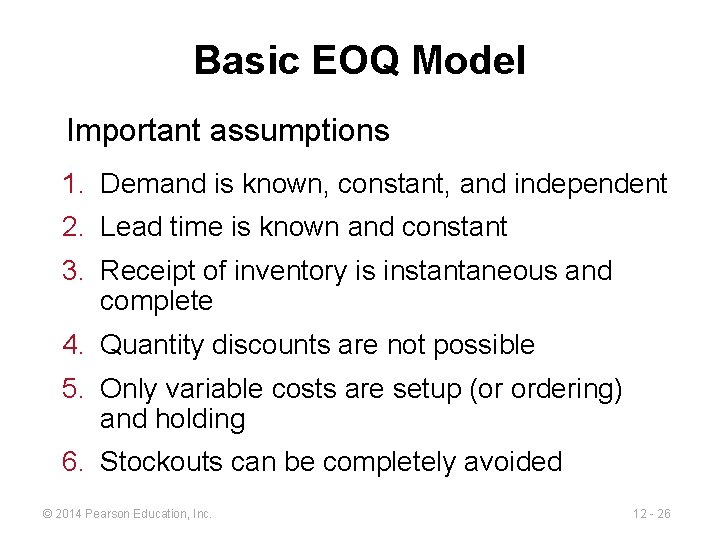
Basic EOQ Model Important assumptions 1. Demand is known, constant, and independent 2. Lead time is known and constant 3. Receipt of inventory is instantaneous and complete 4. Quantity discounts are not possible 5. Only variable costs are setup (or ordering) and holding 6. Stockouts can be completely avoided © 2014 Pearson Education, Inc. 12 - 26
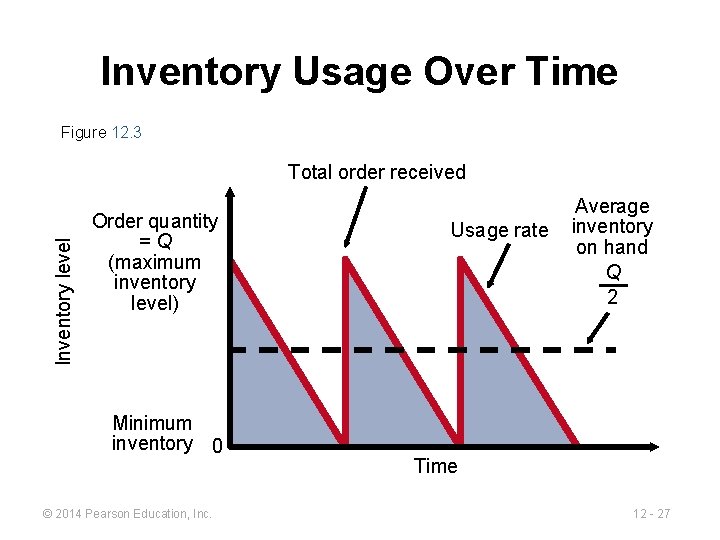
Inventory Usage Over Time Figure 12. 3 Inventory level Total order received Order quantity =Q (maximum inventory level) Minimum inventory 0 © 2014 Pearson Education, Inc. Usage rate Average inventory on hand Q 2 Time 12 - 27
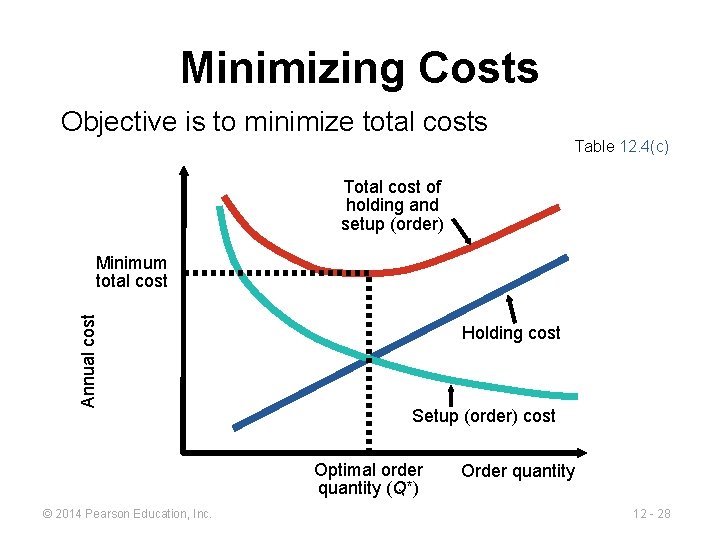
Minimizing Costs Objective is to minimize total costs Table 12. 4(c) Total cost of holding and setup (order) Annual cost Minimum total cost Holding cost Setup (order) cost Optimal order quantity (Q*) © 2014 Pearson Education, Inc. Order quantity 12 - 28
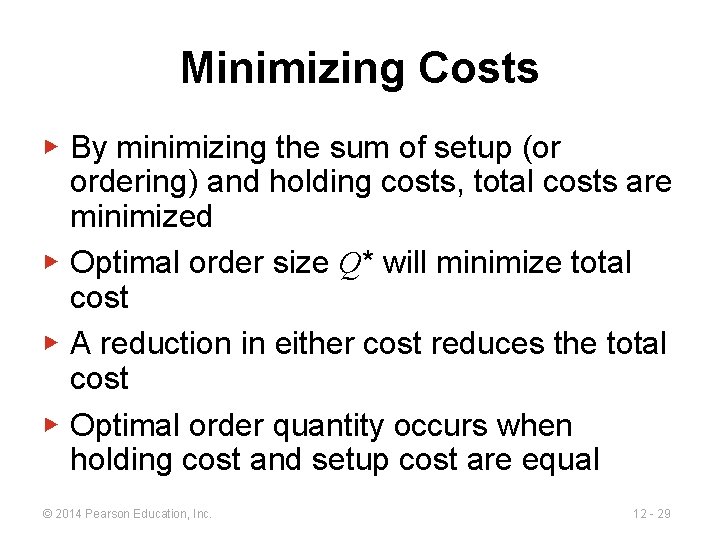
Minimizing Costs ▶ By minimizing the sum of setup (or ordering) and holding costs, total costs are minimized ▶ Optimal order size Q* will minimize total cost ▶ A reduction in either cost reduces the total cost ▶ Optimal order quantity occurs when holding cost and setup cost are equal © 2014 Pearson Education, Inc. 12 - 29
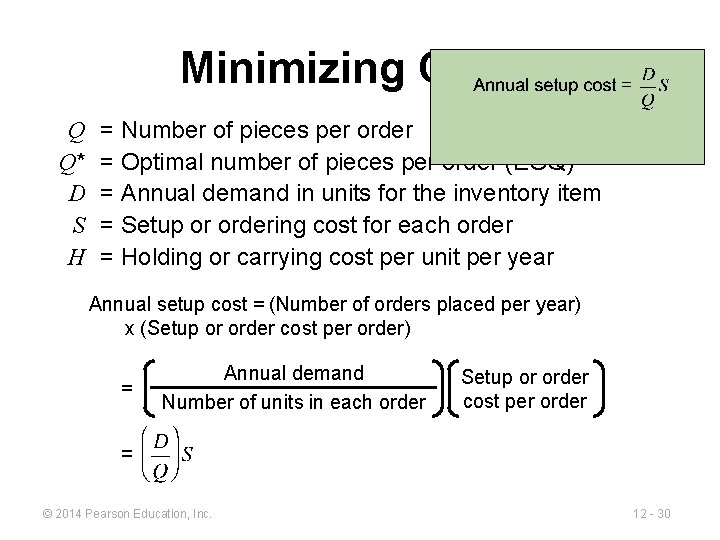
Minimizing Costs Q Q* D S H = Number of pieces per order = Optimal number of pieces per order (EOQ) = Annual demand in units for the inventory item = Setup or ordering cost for each order = Holding or carrying cost per unit per year Annual setup cost = (Number of orders placed per year) x (Setup or order cost per order) = Annual demand Number of units in each order © 2014 Pearson Education, Inc. Setup or order cost per order 12 - 30
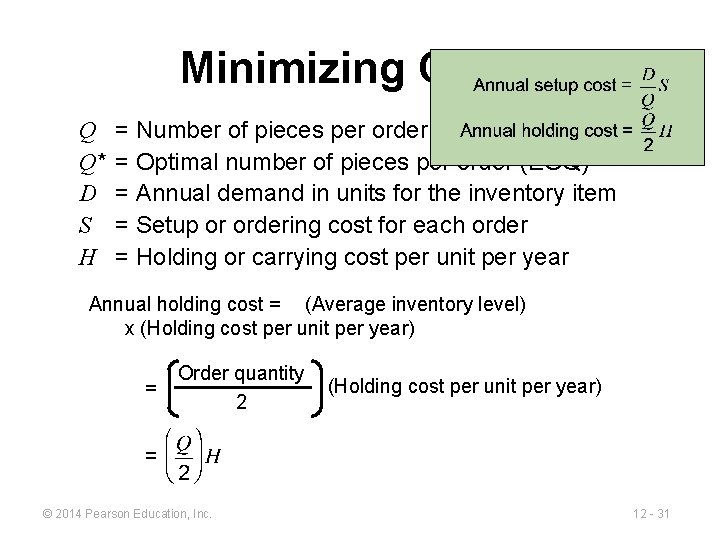
Minimizing Costs Q Q* D S H = Number of pieces per order = Optimal number of pieces per order (EOQ) = Annual demand in units for the inventory item = Setup or ordering cost for each order = Holding or carrying cost per unit per year Annual holding cost = (Average inventory level) x (Holding cost per unit per year) = Order quantity 2 © 2014 Pearson Education, Inc. (Holding cost per unit per year) 12 - 31
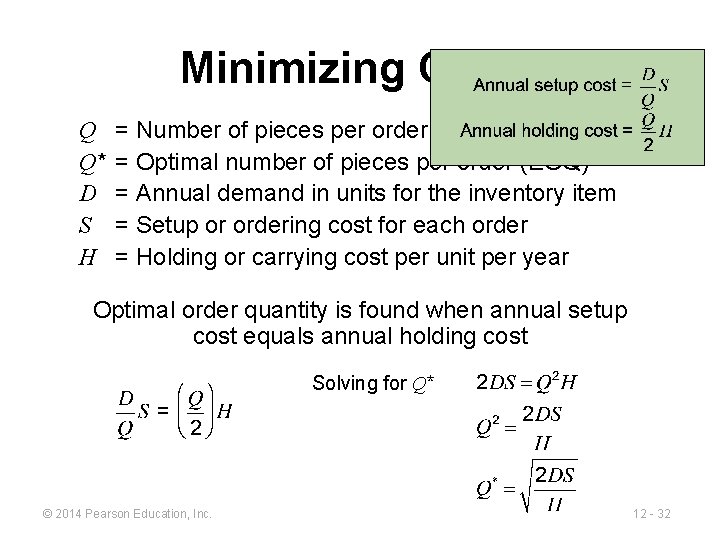
Minimizing Costs Q Q* D S H = Number of pieces per order = Optimal number of pieces per order (EOQ) = Annual demand in units for the inventory item = Setup or ordering cost for each order = Holding or carrying cost per unit per year Optimal order quantity is found when annual setup cost equals annual holding cost Solving for Q* © 2014 Pearson Education, Inc. 12 - 32
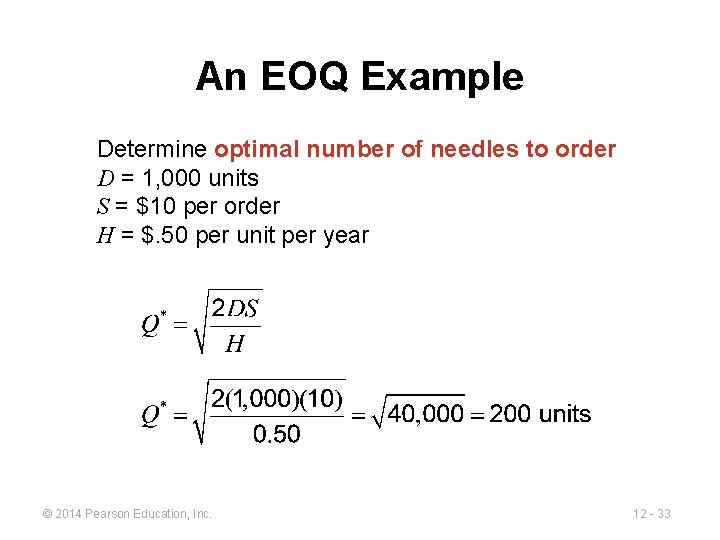
An EOQ Example Determine optimal number of needles to order D = 1, 000 units S = $10 per order H = $. 50 per unit per year © 2014 Pearson Education, Inc. 12 - 33
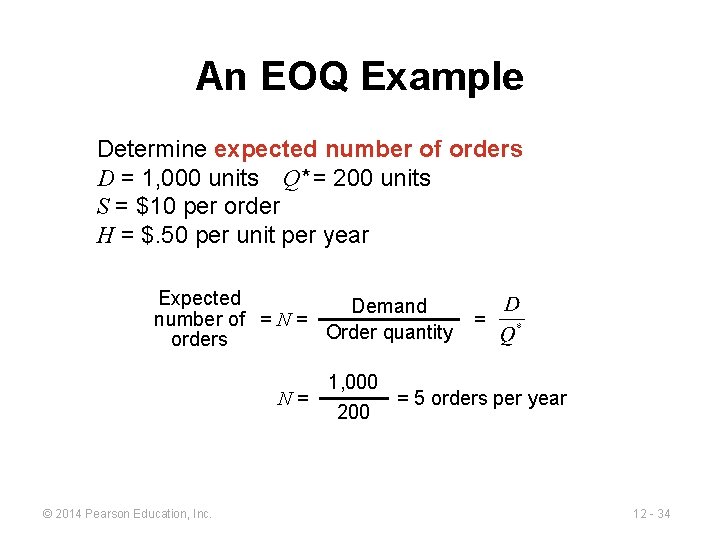
An EOQ Example Determine expected number of orders D = 1, 000 units Q* = 200 units S = $10 per order H = $. 50 per unit per year Expected Demand number of = N = Order quantity orders = 1, 000 N= = 5 orders per year 200 © 2014 Pearson Education, Inc. 12 - 34
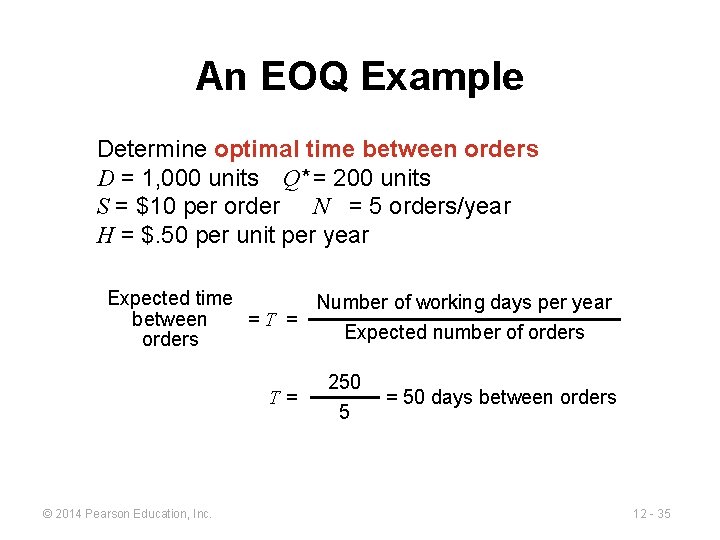
An EOQ Example Determine optimal time between orders D = 1, 000 units Q* = 200 units S = $10 per order N = 5 orders/year H = $. 50 per unit per year Expected time Number of working days per year between =T = Expected number of orders T= © 2014 Pearson Education, Inc. 250 5 = 50 days between orders 12 - 35
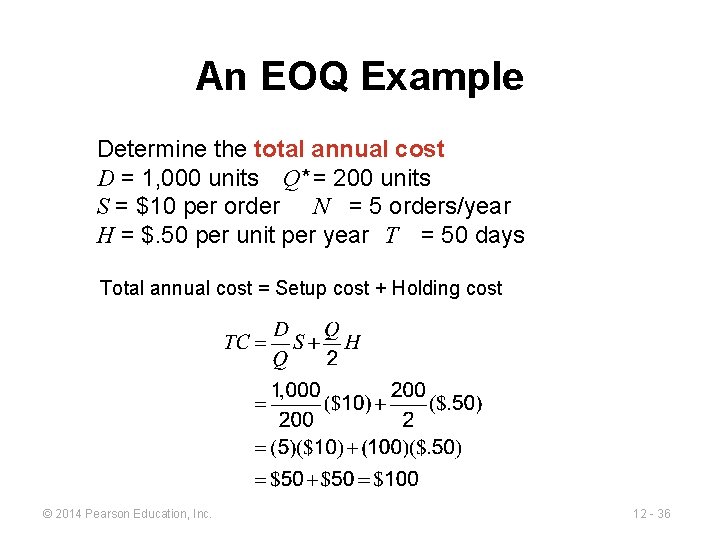
An EOQ Example Determine the total annual cost D = 1, 000 units Q* = 200 units S = $10 per order N = 5 orders/year H = $. 50 per unit per year T = 50 days Total annual cost = Setup cost + Holding cost © 2014 Pearson Education, Inc. 12 - 36
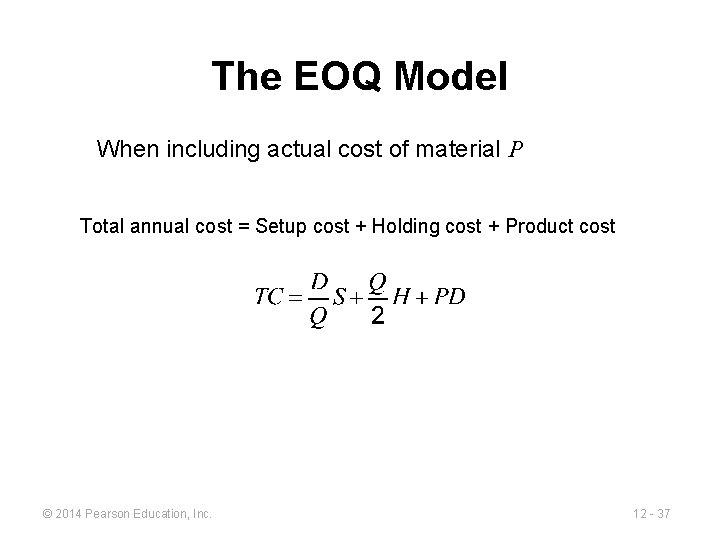
The EOQ Model When including actual cost of material P Total annual cost = Setup cost + Holding cost + Product cost © 2014 Pearson Education, Inc. 12 - 37
Robust Model ▶ The EOQ model is robust ▶ It works even if all parameters and assumptions are not met ▶ The total cost curve is relatively flat in the area of the EOQ © 2014 Pearson Education, Inc. 12 - 38
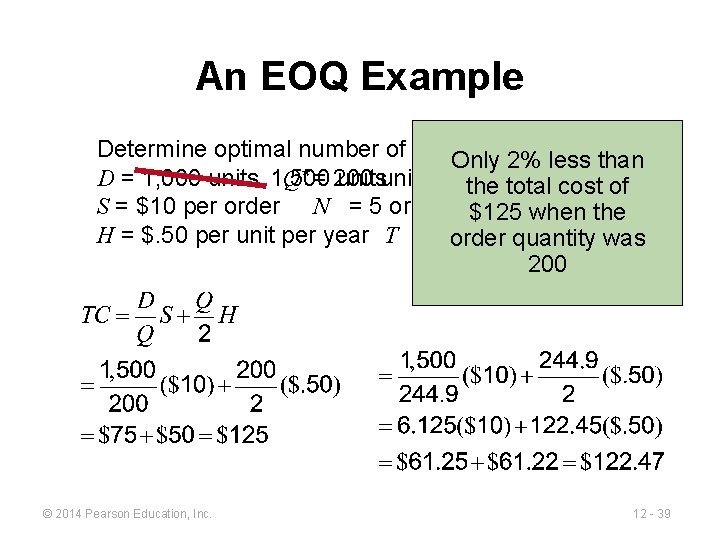
An EOQ Example Determine optimal number of needles Only to 2%order less than D = 1, 000 units 1, 500 Q* = 200 units the total cost of S = $10 per order N = 5 orders/year $125 when the H = $. 50 per unit per year T = 50 days order quantity was 200 © 2014 Pearson Education, Inc. 12 - 39
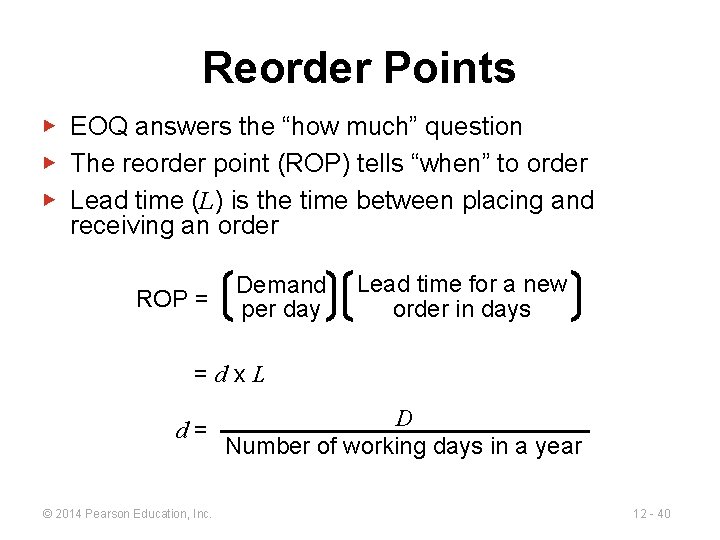
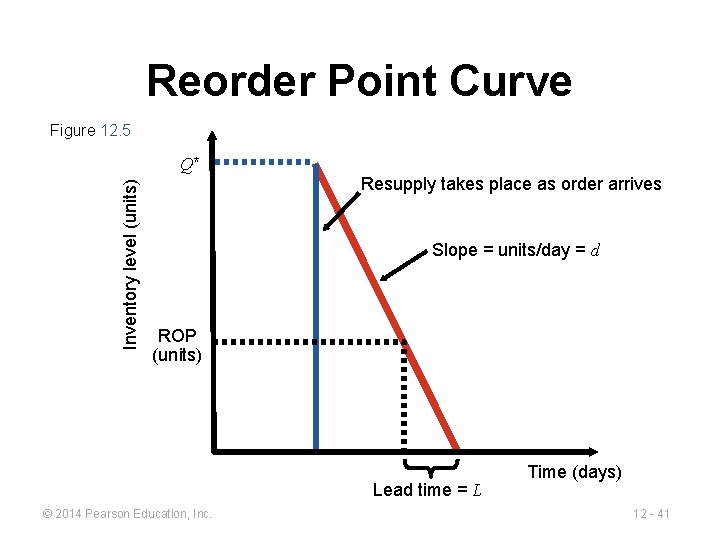
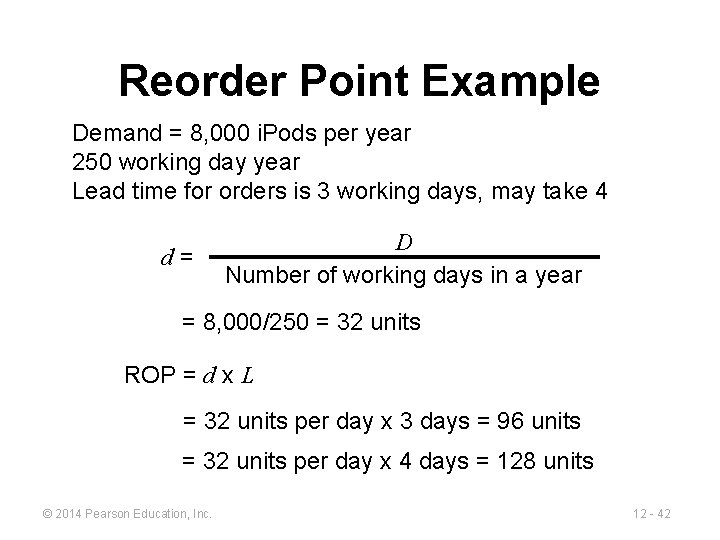
Reorder Points ▶ EOQ answers the “how much” question ▶ The reorder point (ROP) tells “when” to order ▶ Lead time (L) is the time between placing and receiving an order ROP = Demand per day Lead time for a new order in days =dx. L d= © 2014 Pearson Education, Inc. D Number of working days in a year 12 - 40
Reorder Point Curve Figure 12. 5 Inventory level (units) Q* Resupply takes place as order arrives Slope = units/day = d ROP (units) Lead time = L © 2014 Pearson Education, Inc. Time (days) 12 - 41
Reorder Point Example Demand = 8, 000 i. Pods per year 250 working day year Lead time for orders is 3 working days, may take 4 d= D Number of working days in a year = 8, 000/250 = 32 units ROP = d x L = 32 units per day x 3 days = 96 units = 32 units per day x 4 days = 128 units © 2014 Pearson Education, Inc. 12 - 42
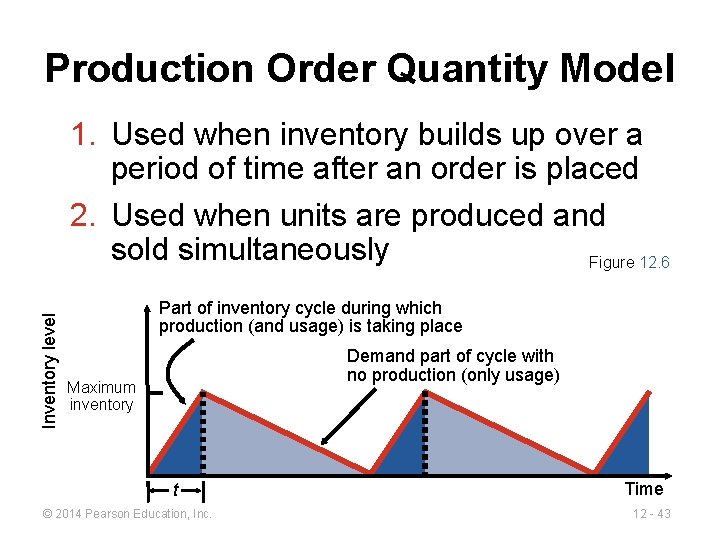
Production Order Quantity Model Inventory level 1. Used when inventory builds up over a period of time after an order is placed 2. Used when units are produced and sold simultaneously Figure 12. 6 Part of inventory cycle during which production (and usage) is taking place Demand part of cycle with no production (only usage) Maximum inventory t © 2014 Pearson Education, Inc. Time 12 - 43
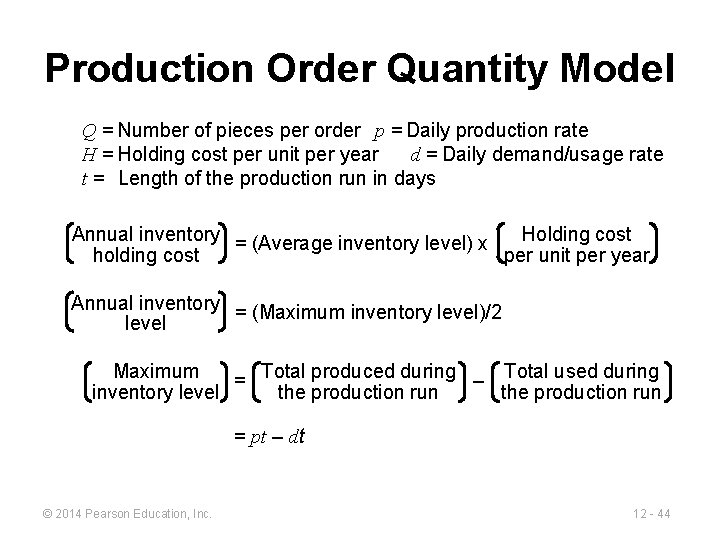
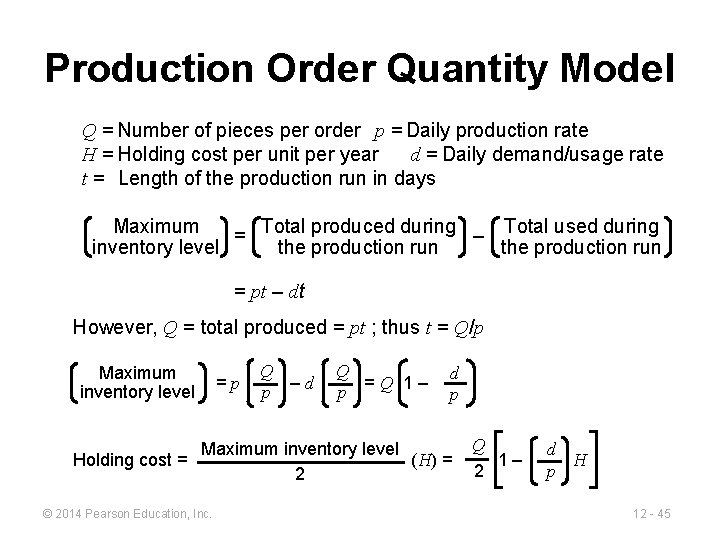
Production Order Quantity Model Q = Number of pieces per order p = Daily production rate H = Holding cost per unit per year d = Daily demand/usage rate t = Length of the production run in days Annual inventory = (Average inventory level) x Holding cost holding cost per unit per year Annual inventory = (Maximum inventory level)/2 level Maximum = Total produced during – Total used during inventory level the production run = pt – dt © 2014 Pearson Education, Inc. 12 - 44
Production Order Quantity Model Q = Number of pieces per order p = Daily production rate H = Holding cost per unit per year d = Daily demand/usage rate t = Length of the production run in days Maximum = Total produced during – Total used during inventory level the production run = pt – dt However, Q = total produced = pt ; thus t = Q/p Maximum inventory level =p Q p –d Q p =Q 1– d p Maximum inventory level Holding cost = (H) = 2 © 2014 Pearson Education, Inc. Q 1– 2 d H p 12 - 45
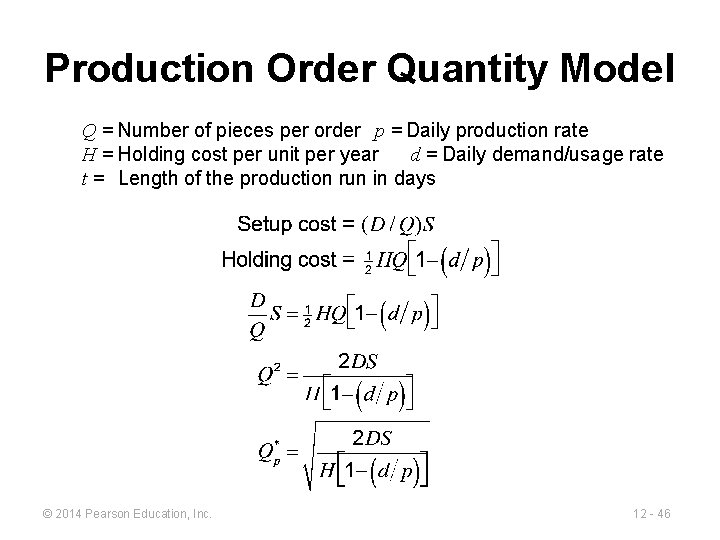
Production Order Quantity Model Q = Number of pieces per order p = Daily production rate H = Holding cost per unit per year d = Daily demand/usage rate t = Length of the production run in days © 2014 Pearson Education, Inc. 12 - 46
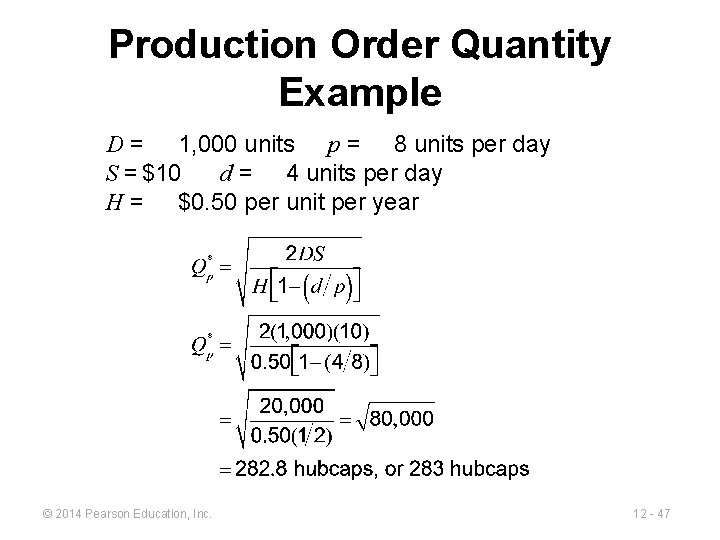
Production Order Quantity Example D = 1, 000 units p = 8 units per day S = $10 d = 4 units per day H = $0. 50 per unit per year © 2014 Pearson Education, Inc. 12 - 47
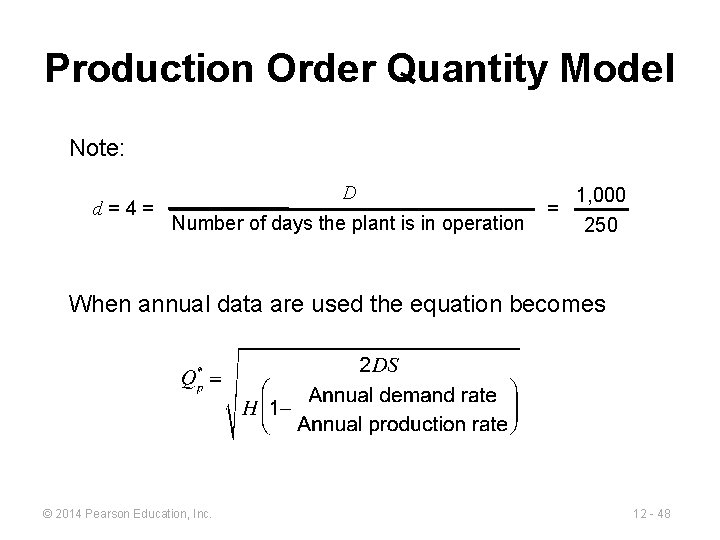
Production Order Quantity Model Note: d=4= D Number of days the plant is in operation = 1, 000 250 When annual data are used the equation becomes © 2014 Pearson Education, Inc. 12 - 48
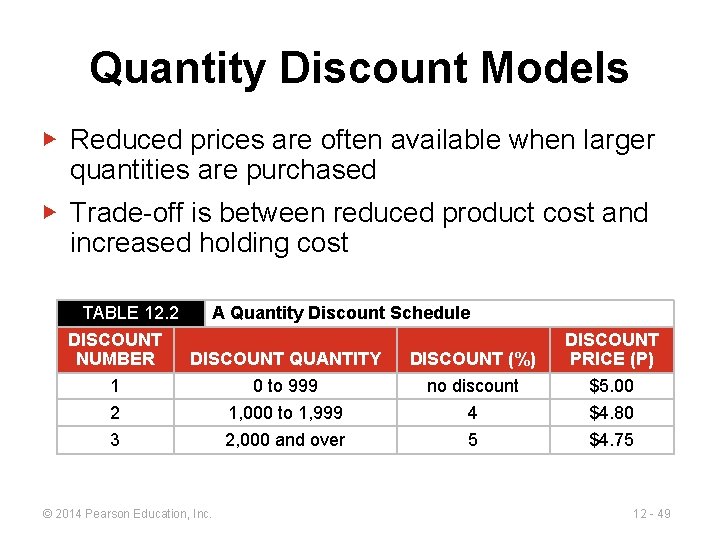
Quantity Discount Models ▶ Reduced prices are often available when larger quantities are purchased ▶ Trade-off is between reduced product cost and increased holding cost TABLE 12. 2 A Quantity Discount Schedule DISCOUNT NUMBER DISCOUNT QUANTITY DISCOUNT (%) 1 0 to 999 no discount 2 1, 000 to 1, 999 4 3 © 2014 Pearson Education, Inc. 2, 000 and over 5 DISCOUNT PRICE (P) $5. 00 $4. 80 $4. 75 12 - 49
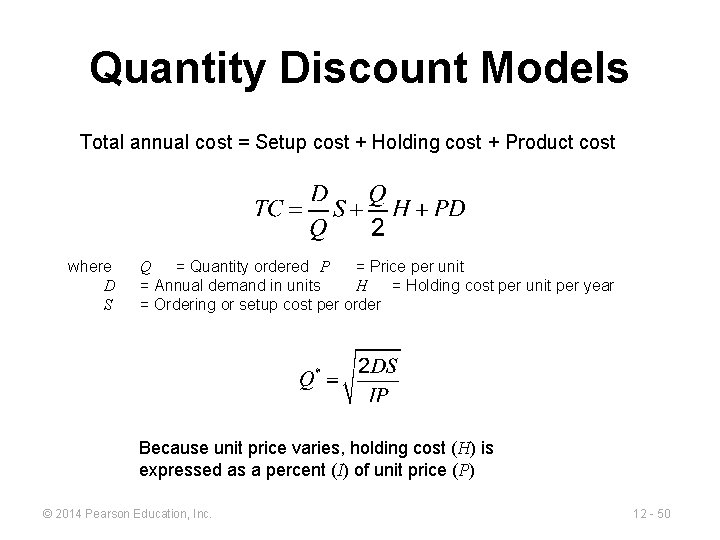
Quantity Discount Models Total annual cost = Setup cost + Holding cost + Product cost where D S Q = Quantity ordered P = Price per unit = Annual demand in units H = Holding cost per unit per year = Ordering or setup cost per order Because unit price varies, holding cost (H) is expressed as a percent (I) of unit price (P) © 2014 Pearson Education, Inc. 12 - 50
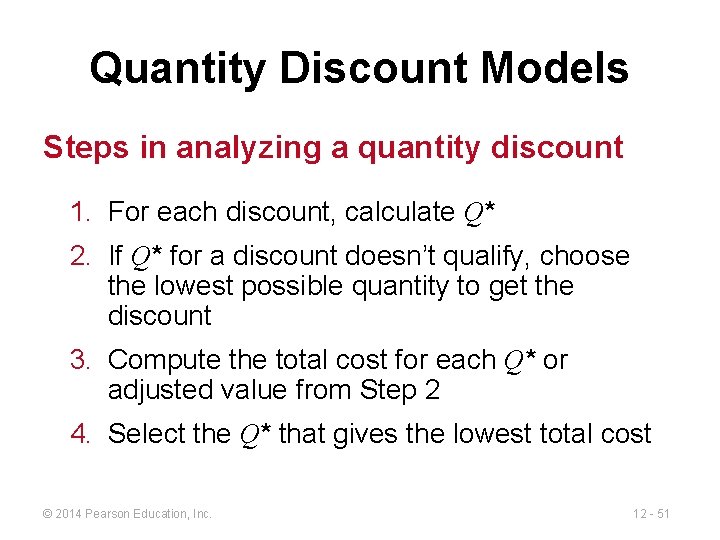
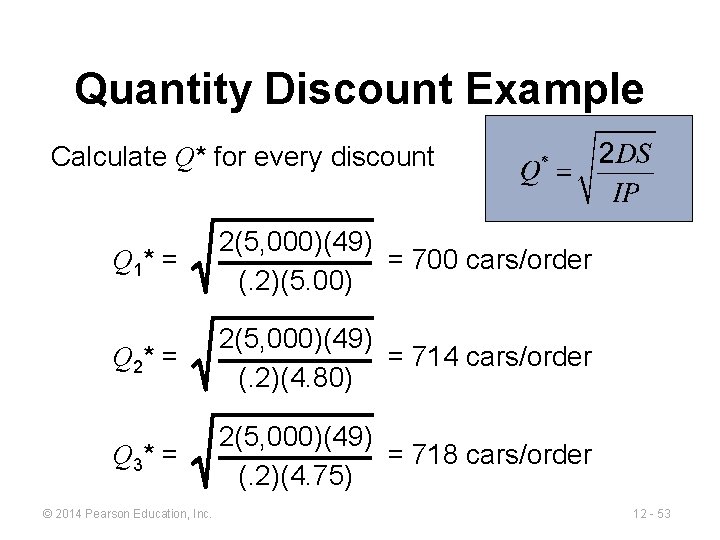
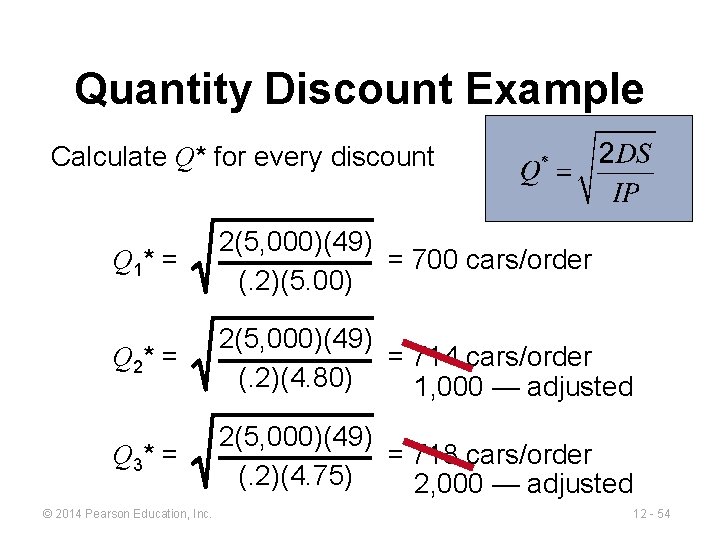
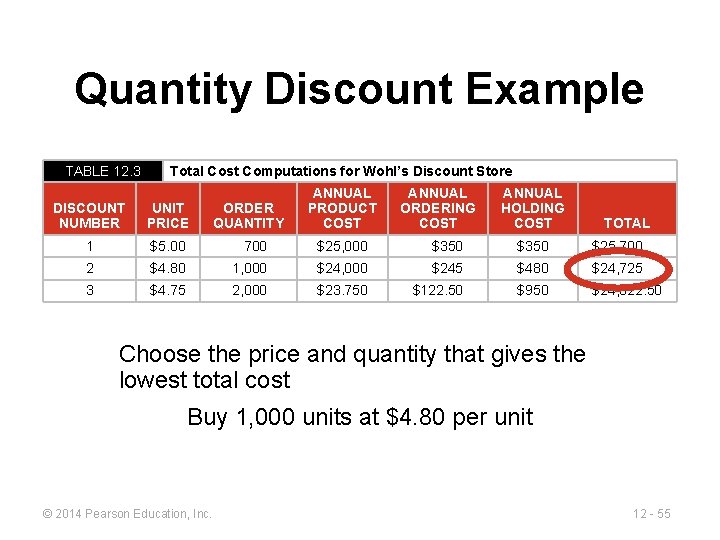
Quantity Discount Models Steps in analyzing a quantity discount 1. For each discount, calculate Q* 2. If Q* for a discount doesn’t qualify, choose the lowest possible quantity to get the discount 3. Compute the total cost for each Q* or adjusted value from Step 2 4. Select the Q* that gives the lowest total cost © 2014 Pearson Education, Inc. 12 - 51
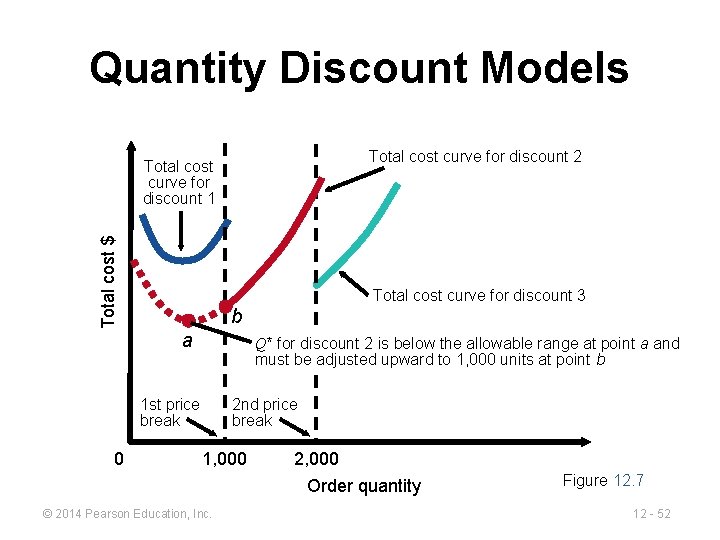
Quantity Discount Models Total cost curve for discount 2 Total cost $ Total cost curve for discount 1 Total cost curve for discount 3 b a Q* for discount 2 is below the allowable range at point a and must be adjusted upward to 1, 000 units at point b 1 st price break 0 2 nd price break 1, 000 © 2014 Pearson Education, Inc. 2, 000 Order quantity Figure 12. 7 12 - 52
Quantity Discount Example Calculate Q* for every discount Q 1* = 2(5, 000)(49) = 700 cars/order (. 2)(5. 00) Q 2* = 2(5, 000)(49) = 714 cars/order (. 2)(4. 80) Q 3* = 2(5, 000)(49) = 718 cars/order (. 2)(4. 75) © 2014 Pearson Education, Inc. 12 - 53
Quantity Discount Example Calculate Q* for every discount Q 1* = 2(5, 000)(49) = 700 cars/order (. 2)(5. 00) Q 2* = 2(5, 000)(49) = 714 cars/order (. 2)(4. 80) 1, 000 — adjusted Q 3* = 2(5, 000)(49) = 718 cars/order (. 2)(4. 75) 2, 000 — adjusted © 2014 Pearson Education, Inc. 12 - 54
Quantity Discount Example TABLE 12. 3 Total Cost Computations for Wohl’s Discount Store ORDER QUANTITY ANNUAL PRODUCT COST ANNUAL ORDERING COST ANNUAL HOLDING COST DISCOUNT NUMBER UNIT PRICE 1 $5. 00 700 $25, 000 $350 $25, 700 2 $4. 80 1, 000 $245 $480 $24, 725 3 $4. 75 2, 000 $23. 750 $122. 50 $950 $24, 822. 50 TOTAL Choose the price and quantity that gives the lowest total cost Buy 1, 000 units at $4. 80 per unit © 2014 Pearson Education, Inc. 12 - 55
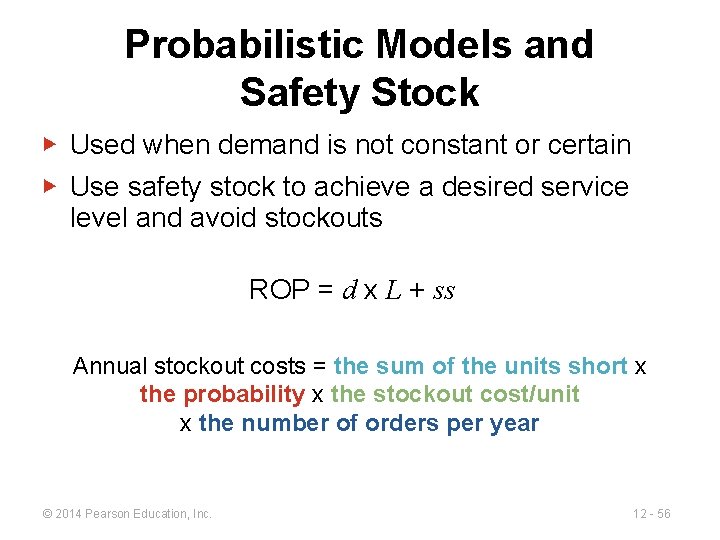
Probabilistic Models and Safety Stock ▶ Used when demand is not constant or certain ▶ Use safety stock to achieve a desired service level and avoid stockouts ROP = d x L + ss Annual stockout costs = the sum of the units short x the probability x the stockout cost/unit x the number of orders per year © 2014 Pearson Education, Inc. 12 - 56
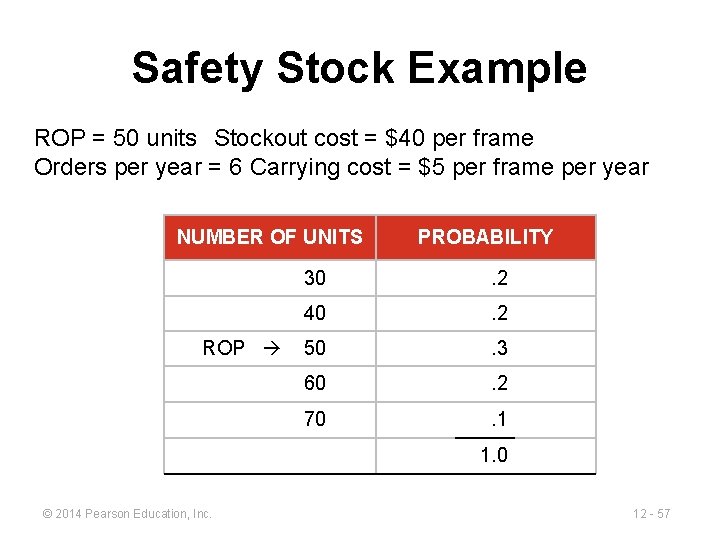
Safety Stock Example ROP = 50 units Stockout cost = $40 per frame Orders per year = 6 Carrying cost = $5 per frame per year NUMBER OF UNITS ROP PROBABILITY 30 . 2 40 . 2 50 . 3 60 . 2 70 . 1 1. 0 © 2014 Pearson Education, Inc. 12 - 57
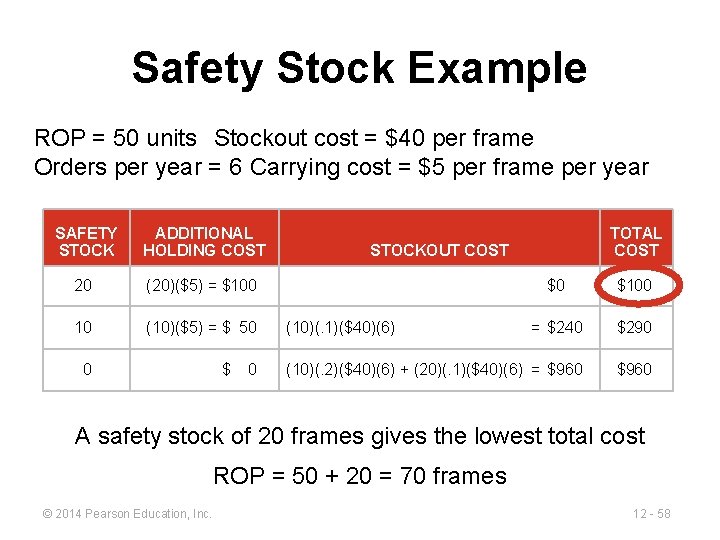
Safety Stock Example ROP = 50 units Stockout cost = $40 per frame Orders per year = 6 Carrying cost = $5 per frame per year SAFETY STOCK ADDITIONAL HOLDING COST 20 (20)($5) = $100 10 (10)($5) = $ 50 0 $ 0 TOTAL COST STOCKOUT COST $0 $100 = $240 $290 (10)(. 2)($40)(6) + (20)(. 1)($40)(6) = $960 (10)(. 1)($40)(6) A safety stock of 20 frames gives the lowest total cost ROP = 50 + 20 = 70 frames © 2014 Pearson Education, Inc. 12 - 58
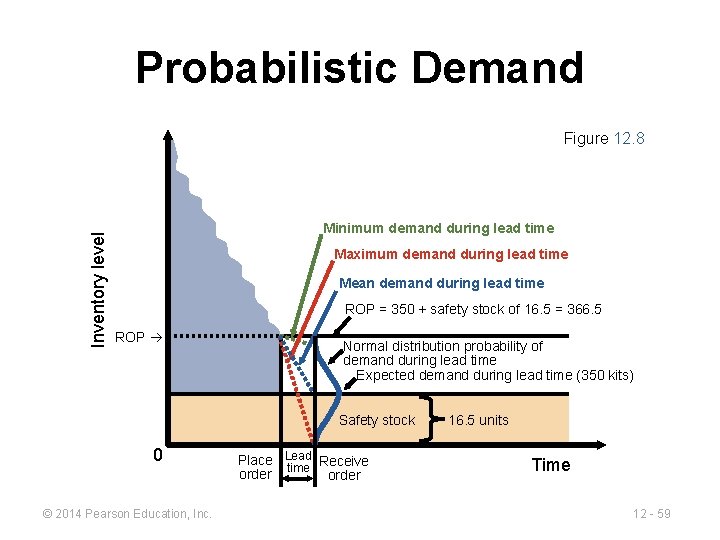
Probabilistic Demand Inventory level Figure 12. 8 Minimum demand during lead time Maximum demand during lead time Mean demand during lead time ROP = 350 + safety stock of 16. 5 = 366. 5 ROP Normal distribution probability of demand during lead time Expected demand during lead time (350 kits) Safety stock 0 © 2014 Pearson Education, Inc. Place Lead Receive time order 16. 5 units Time 12 - 59
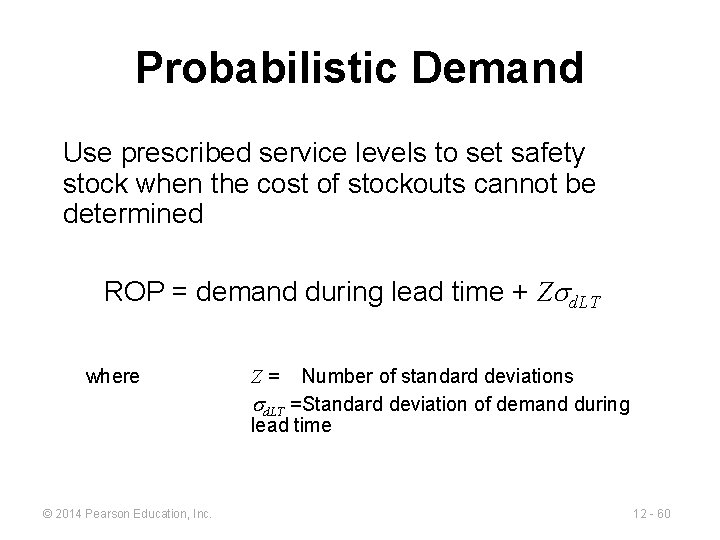
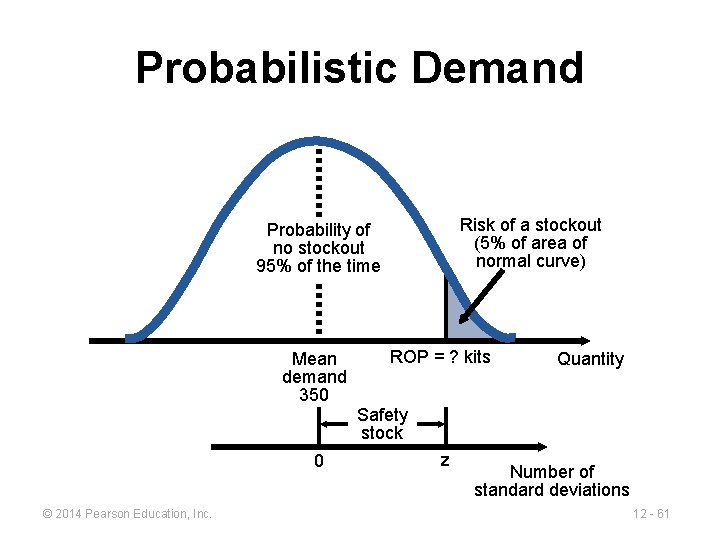
Probabilistic Demand Use prescribed service levels to set safety stock when the cost of stockouts cannot be determined ROP = demand during lead time + Z d. LT where © 2014 Pearson Education, Inc. Z= Number of standard deviations d. LT =Standard deviation of demand during lead time 12 - 60
Probabilistic Demand Risk of a stockout (5% of area of normal curve) Probability of no stockout 95% of the time Mean demand 350 0 © 2014 Pearson Education, Inc. ROP = ? kits Quantity Safety stock z Number of standard deviations 12 - 61
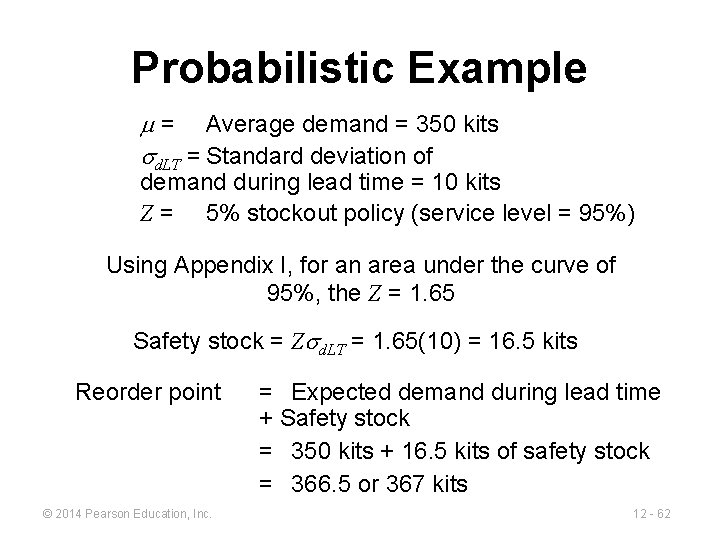
Probabilistic Example = Average demand = 350 kits d. LT = Standard deviation of demand during lead time = 10 kits Z = 5% stockout policy (service level = 95%) Using Appendix I, for an area under the curve of 95%, the Z = 1. 65 Safety stock = Z d. LT = 1. 65(10) = 16. 5 kits Reorder point © 2014 Pearson Education, Inc. = Expected demand during lead time + Safety stock = 350 kits + 16. 5 kits of safety stock = 366. 5 or 367 kits 12 - 62
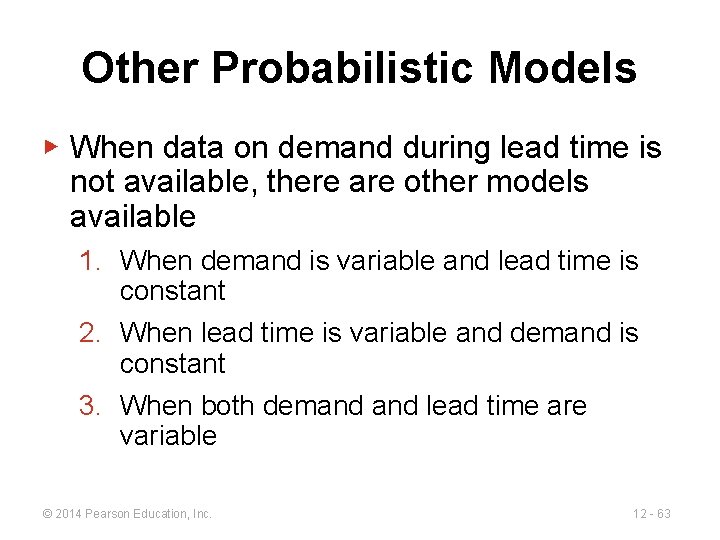
Other Probabilistic Models ▶ When data on demand during lead time is not available, there are other models available 1. When demand is variable and lead time is constant 2. When lead time is variable and demand is constant 3. When both demand lead time are variable © 2014 Pearson Education, Inc. 12 - 63
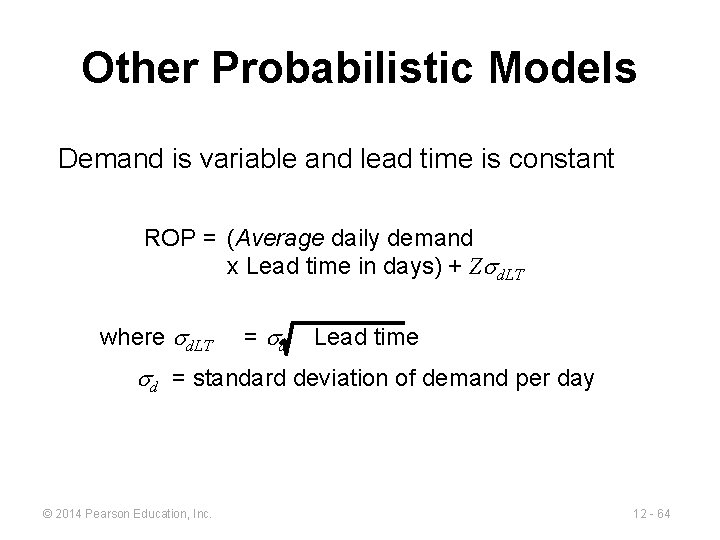
Other Probabilistic Models Demand is variable and lead time is constant ROP = (Average daily demand x Lead time in days) + Z d. LT where d. LT = d Lead time d = standard deviation of demand per day © 2014 Pearson Education, Inc. 12 - 64
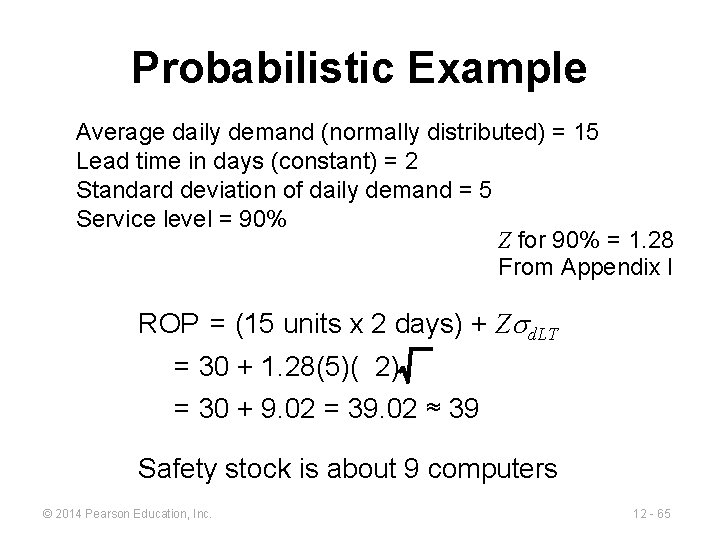
Probabilistic Example Average daily demand (normally distributed) = 15 Lead time in days (constant) = 2 Standard deviation of daily demand = 5 Service level = 90% Z for 90% = 1. 28 From Appendix I ROP = (15 units x 2 days) + Z d. LT = 30 + 1. 28(5)( 2) = 30 + 9. 02 = 39. 02 ≈ 39 Safety stock is about 9 computers © 2014 Pearson Education, Inc. 12 - 65
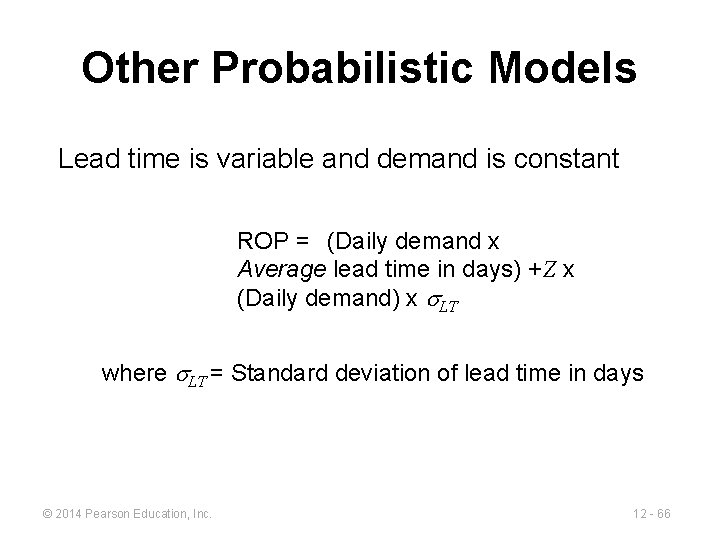
Other Probabilistic Models Lead time is variable and demand is constant ROP = (Daily demand x Average lead time in days) +Z x (Daily demand) x LT where LT = Standard deviation of lead time in days © 2014 Pearson Education, Inc. 12 - 66
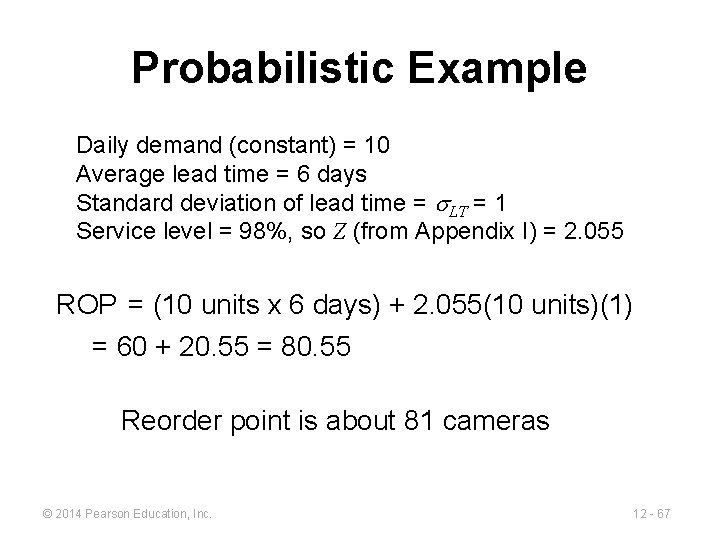
Probabilistic Example Daily demand (constant) = 10 Average lead time = 6 days Standard deviation of lead time = LT = 1 Service level = 98%, so Z (from Appendix I) = 2. 055 ROP = (10 units x 6 days) + 2. 055(10 units)(1) = 60 + 20. 55 = 80. 55 Reorder point is about 81 cameras © 2014 Pearson Education, Inc. 12 - 67
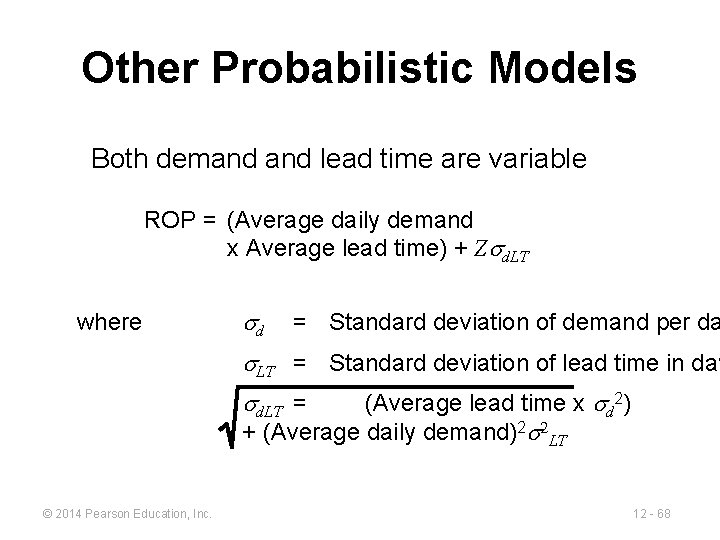
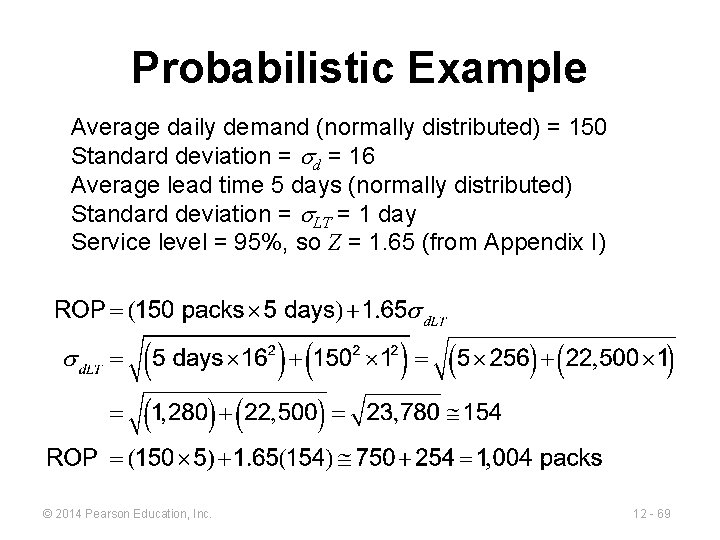
Other Probabilistic Models Both demand lead time are variable ROP = (Average daily demand x Average lead time) + Z d. LT where d = Standard deviation of demand per da LT = Standard deviation of lead time in day d. LT = (Average lead time x d 2) + (Average daily demand)2 2 LT © 2014 Pearson Education, Inc. 12 - 68
Probabilistic Example Average daily demand (normally distributed) = 150 Standard deviation = d = 16 Average lead time 5 days (normally distributed) Standard deviation = LT = 1 day Service level = 95%, so Z = 1. 65 (from Appendix I) © 2014 Pearson Education, Inc. 12 - 69
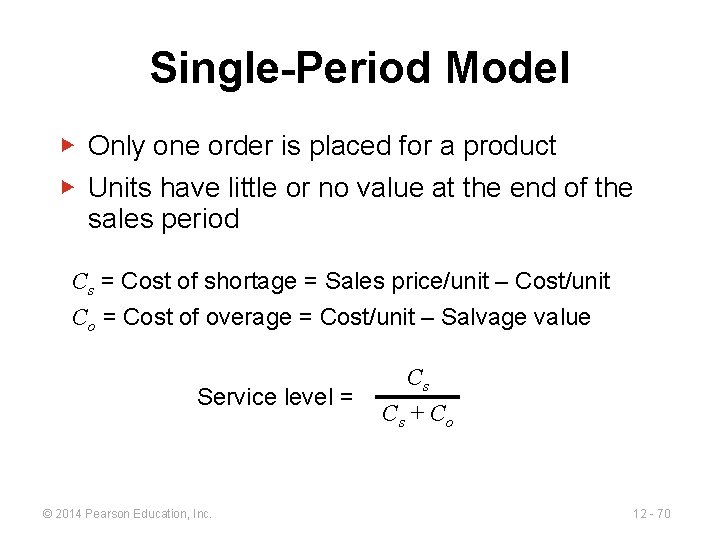
Single-Period Model ▶ Only one order is placed for a product ▶ Units have little or no value at the end of the sales period Cs = Cost of shortage = Sales price/unit – Cost/unit Co = Cost of overage = Cost/unit – Salvage value Service level = © 2014 Pearson Education, Inc. Cs Cs + Co 12 - 70
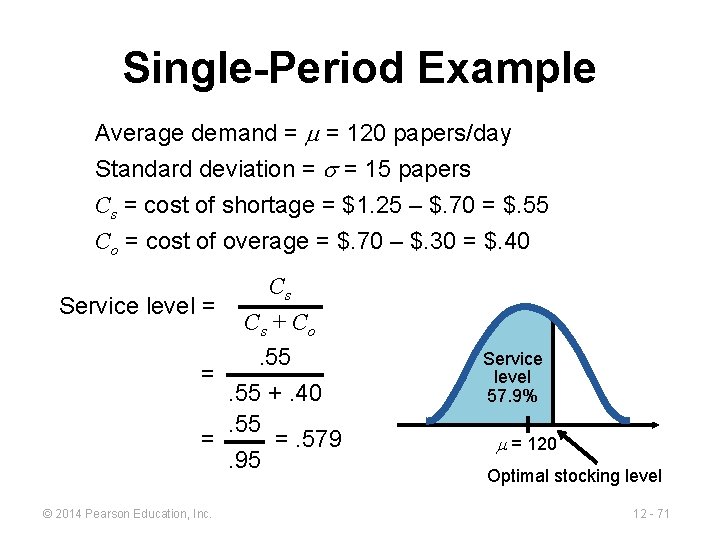
Single-Period Example Average demand = = 120 papers/day Standard deviation = = 15 papers Cs = cost of shortage = $1. 25 – $. 70 = $. 55 Co = cost of overage = $. 70 – $. 30 = $. 40 Cs Service level = Cs + Co. 55 =. 55 +. 40. 55 = =. 579. 95 © 2014 Pearson Education, Inc. Service level 57. 9% = 120 Optimal stocking level 12 - 71
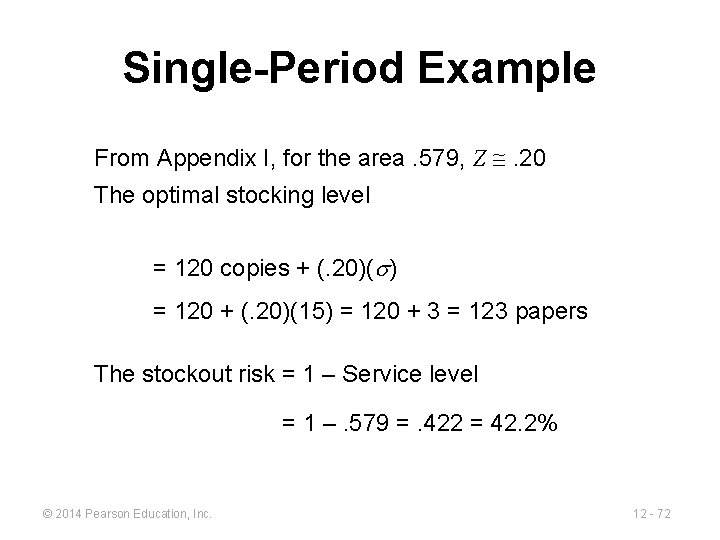
Single-Period Example From Appendix I, for the area. 579, Z . 20 The optimal stocking level = 120 copies + (. 20)( ) = 120 + (. 20)(15) = 120 + 3 = 123 papers The stockout risk = 1 – Service level = 1 –. 579 =. 422 = 42. 2% © 2014 Pearson Education, Inc. 12 - 72
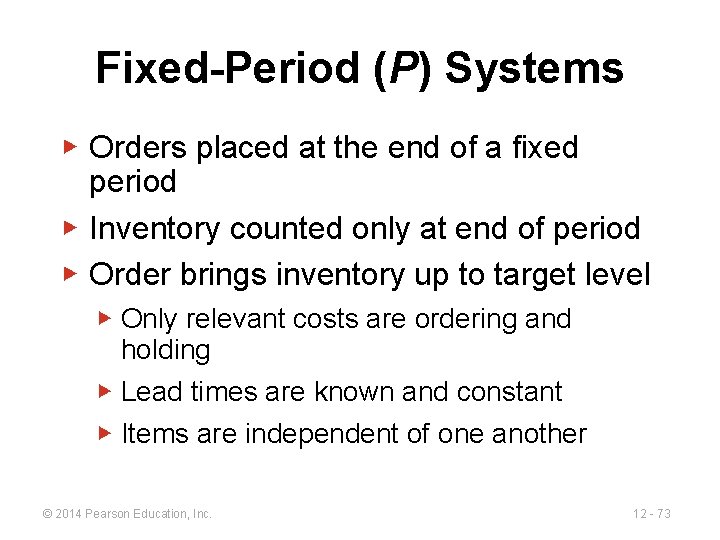
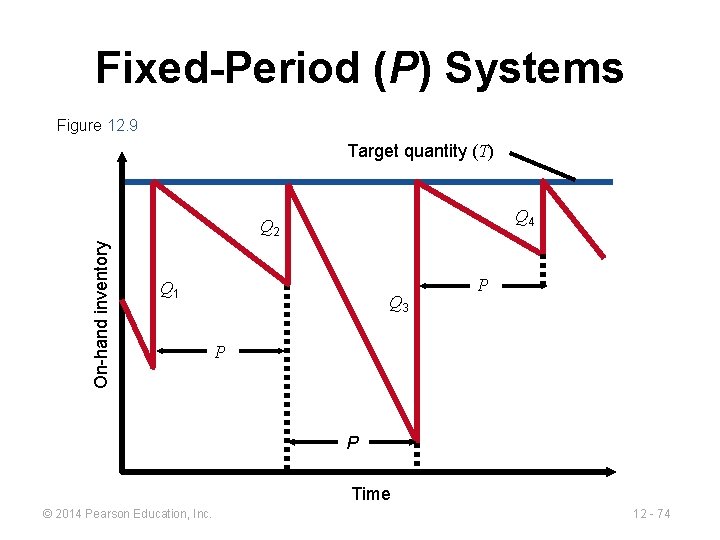
Fixed-Period (P) Systems ▶ Orders placed at the end of a fixed period ▶ Inventory counted only at end of period ▶ Order brings inventory up to target level ▶ Only relevant costs are ordering and holding ▶ Lead times are known and constant ▶ Items are independent of one another © 2014 Pearson Education, Inc. 12 - 73
Fixed-Period (P) Systems Figure 12. 9 Target quantity (T) Q 4 On-hand inventory Q 2 Q 1 Q 3 P P P Time © 2014 Pearson Education, Inc. 12 - 74
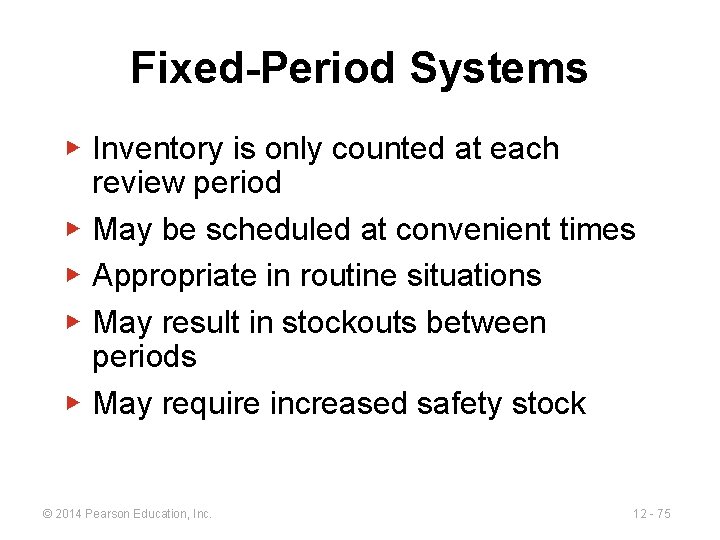
Fixed-Period Systems ▶ Inventory is only counted at each review period ▶ May be scheduled at convenient times ▶ Appropriate in routine situations ▶ May result in stockouts between periods ▶ May require increased safety stock © 2014 Pearson Education, Inc. 12 - 75
All rights reserved. No part of this publication may be reproduced, stored in a retrieval system, or transmitted, in any form or by any means, electronic, mechanical, photocopying, recording, or otherwise, without the prior written permission of the publisher. Printed in the United States of America. © 2014 Pearson Education, Inc. 12 - 76