
Inventories and Cost of Goods Sold Lecture 14










- Slides: 31
Inventories and Cost of Goods Sold Lecture 14 (CHAPTER 7) © 2010 Pearson Education Inc. Publishing as Prentice Hall Introduction to Financial Accounting, 10/e
Learning Objectives (LO) After studying this chapter, you should be able to 1. 2. 3. 4. Link inventory valuation to gross profit Use both perpetual and periodic inventory systems Calculate the cost of merchandise acquired Compute income and inventory values using the three principal inventory valuation methods 5. Use the lower-of-cost-or-market method to value inventories © 2012 Pearson Education Introduction to Financial Accounting, 10/e 2 of 42
Learning Objectives (LO) After studying this chapter, you should be able to 6. Show the effects of inventory errors on financial statements 7. Evaluate the gross profit percentage and inventory turnover © 2012 Pearson Education Introduction to Financial Accounting, 10/e 3 of 42
LO – 1 Gross Profit and Cost of Goods Sold Balance Sheet Income Statement Sales Minus Merchandise Purchases Merchandise Inventory Current Asset Merchandise Sales Cost of Goods Sold (an expense) Equals Gross Profit Minus Selling Expenses and Administrative Expenses © 2012 Pearson Education Equals operating Income Introduction to Financial Accounting, 10/e 4 of 42
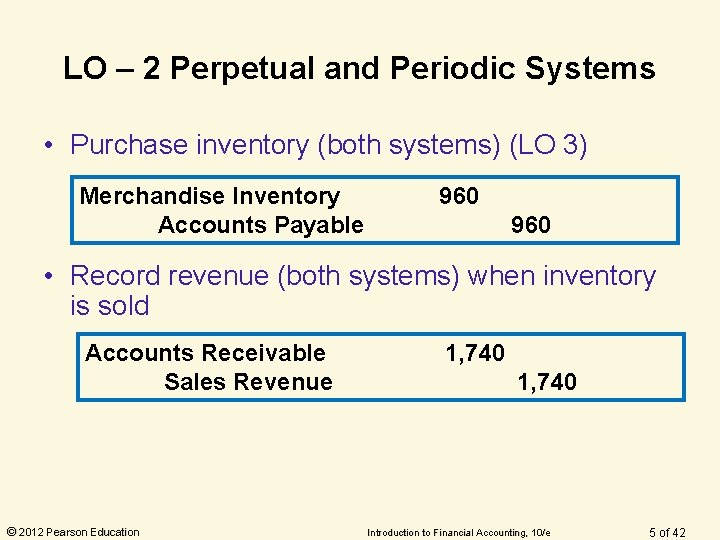
LO – 2 Perpetual and Periodic Systems • Purchase inventory (both systems) (LO 3) Merchandise Inventory Accounts Payable 960 • Record revenue (both systems) when inventory is sold Accounts Receivable Sales Revenue © 2012 Pearson Education 1, 740 Introduction to Financial Accounting, 10/e 5 of 42
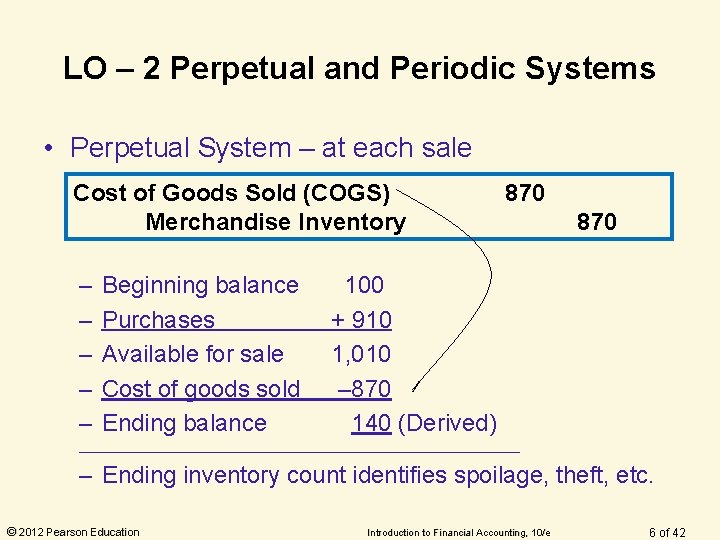
LO – 2 Perpetual and Periodic Systems • Perpetual System – at each sale Cost of Goods Sold (COGS) Merchandise Inventory – – – Beginning balance Purchases Available for sale Cost of goods sold Ending balance 870 100 + 910 1, 010 – 870 140 (Derived) _________________________________ – Ending inventory count identifies spoilage, theft, etc. © 2012 Pearson Education Introduction to Financial Accounting, 10/e 6 of 42
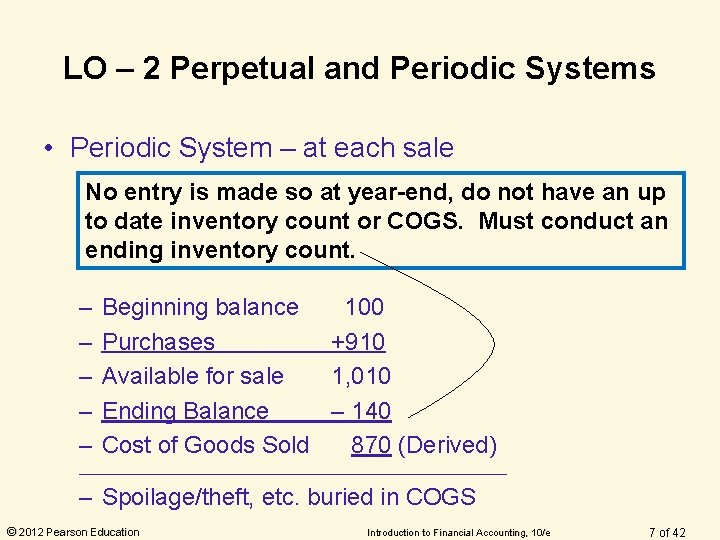
LO – 2 Perpetual and Periodic Systems • Periodic System – at each sale No entry is made so at year-end, do not have an up to date inventory count or COGS. Must conduct an ending inventory count. – – – Beginning balance 100 Purchases +910 Available for sale 1, 010 Ending Balance – 140 Cost of Goods Sold 870 (Derived) ________________________________ – Spoilage/theft, etc. buried in COGS © 2012 Pearson Education Introduction to Financial Accounting, 10/e 7 of 42
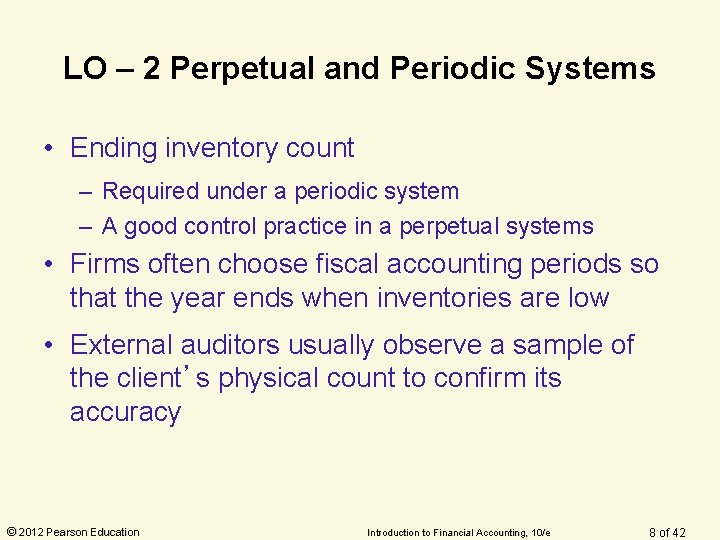
LO – 2 Perpetual and Periodic Systems • Ending inventory count – Required under a periodic system – A good control practice in a perpetual systems • Firms often choose fiscal accounting periods so that the year ends when inventories are low • External auditors usually observe a sample of the client’s physical count to confirm its accuracy © 2012 Pearson Education Introduction to Financial Accounting, 10/e 8 of 42
LO 3 - Cost of Merchandise Acquired • Product Costs – Easily associated with a specific product or inventory – Product costs attach to COGS/Inventory, thus making those accounts larger and expenses smaller. • Period Costs – Easier to associate with the reporting period than with a specific product or inventory item – Period costs do not get attached to COGS/Inventory. They become expenses on the income statement making them larger and COGS/Inventory smaller. • Company policy determines which are which © 2012 Pearson Education Introduction to Financial Accounting, 10/e 9 of 42
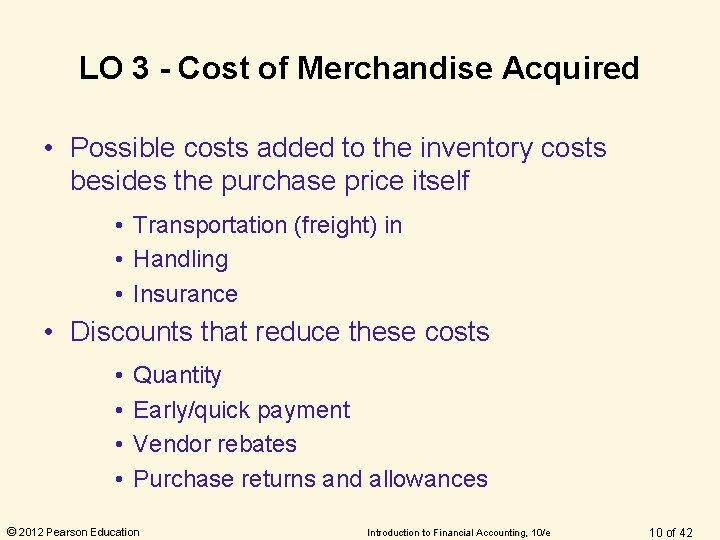
LO 3 - Cost of Merchandise Acquired • Possible costs added to the inventory costs besides the purchase price itself • Transportation (freight) in • Handling • Insurance • Discounts that reduce these costs • • Quantity Early/quick payment Vendor rebates Purchase returns and allowances © 2012 Pearson Education Introduction to Financial Accounting, 10/e 10 of 42
LO 3 - Cost of Merchandise Acquired • Transportation – FOB (Free on Board) Destination - Seller pays for delivery to us, the buyer; title transfers on receipt No entry – FOB (Free on Board) Shipping – We pay for delivery from the seller; title transfers when goods leave buyer Freight in * Freight Payable 30 30 *Adjunct account to COGS © 2012 Pearson Education Introduction to Financial Accounting, 10/e 11 of 42
LO 3 - Cost of Merchandise Acquired • Returns, Allowances Merchandise Inventory (Purchases) 960 Accounts Payable 75 Purchase Returns/Allowances * 75 * Contra account to inventory or purchases • Discounts Accounts Payable Discounts on Purchases Cash © 2012 Pearson Education 885 Introduction to Financial Accounting, 10/e 5 880 12 of 42
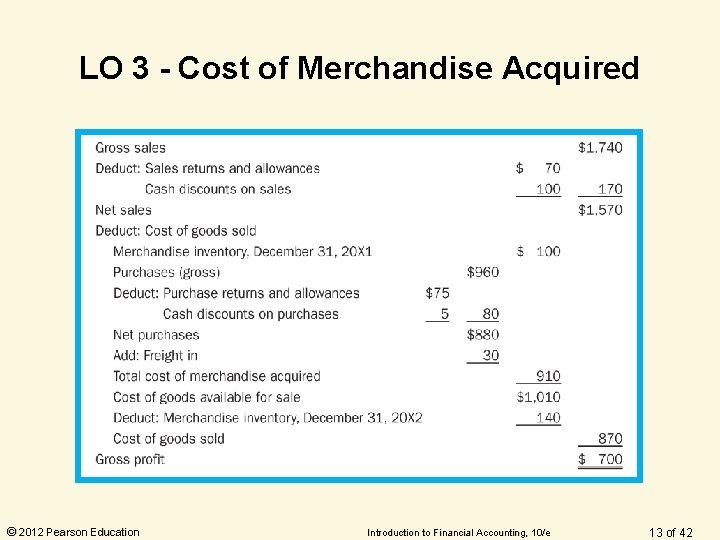
LO 3 - Cost of Merchandise Acquired © 2012 Pearson Education Introduction to Financial Accounting, 10/e 13 of 42
LO 4 – Inventory Valuation Methods • If inventory prices were not changing, all methods would produce the same COGS and ending inventory amounts. • Since prices do change, which are assigned to COGS and ending inventory? • Four methods are generally accepted: – – Specific identification First-in, first-out (FIF 0) Weighted-average Last-in, first out (LIFO) © 2012 Pearson Education Introduction to Financial Accounting, 10/e 14 of 42
LO 4 – Inventory Valuation Methods Specific Identification • The cost of each inventory item is known • When an inventory item is sold, its cost becomes part of COGS. Bar codes facilitate identifying units and costs. Physical flow matches the accounting flow • Relatively easy to use, especially for expensive low-volume merchandise • COGS/ending inventory easily manipulated if inventory prices are changing © 2012 Pearson Education Introduction to Financial Accounting, 10/e 15 of 42
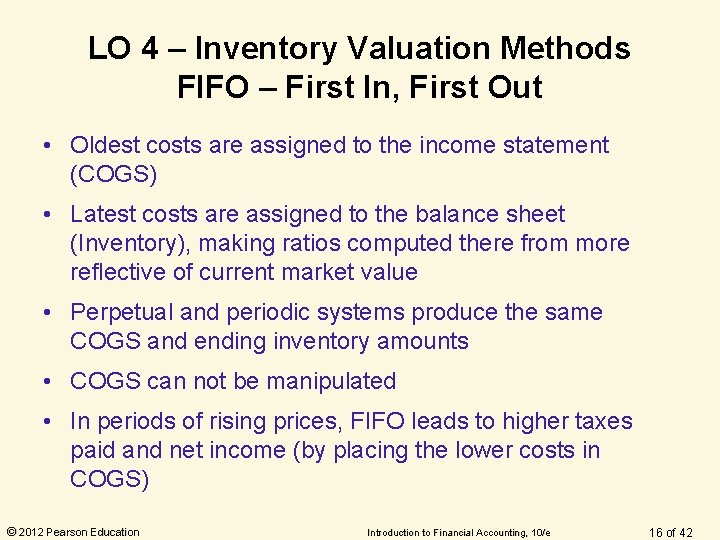
LO 4 – Inventory Valuation Methods FIFO – First In, First Out • Oldest costs are assigned to the income statement (COGS) • Latest costs are assigned to the balance sheet (Inventory), making ratios computed there from more reflective of current market value • Perpetual and periodic systems produce the same COGS and ending inventory amounts • COGS can not be manipulated • In periods of rising prices, FIFO leads to higher taxes paid and net income (by placing the lower costs in COGS) © 2012 Pearson Education Introduction to Financial Accounting, 10/e 16 of 42
LO 4 – Inventory Valuation Methods LIFO – Last In, First Out • Oldest costs are assigned to the balance sheet (Inventory). • Latest costs are matched to revenue on the income statement (COGS), making ratios computed there from more reflective of current market value • Perpetual and periodic systems produce different COGS and ending inventory amounts • COGS can be manipulated by buying inventory at year-end • In periods of rising prices, LIFO leads to lower net income and lower taxes paid © 2012 Pearson Education Introduction to Financial Accounting, 10/e 17 of 42
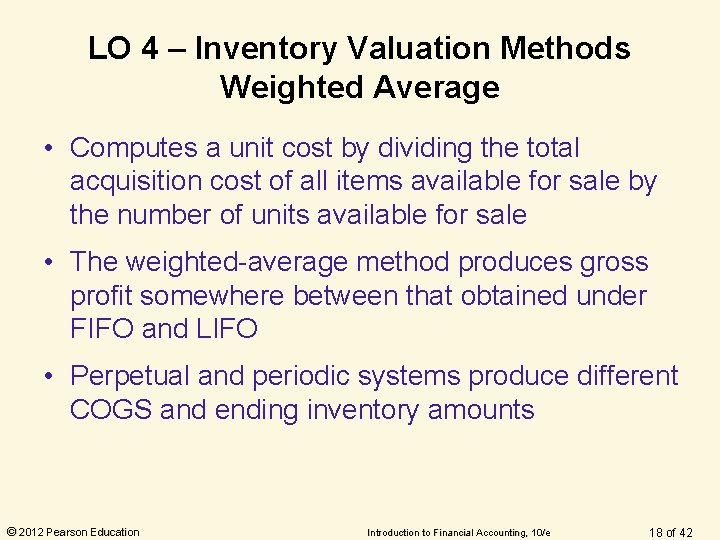
LO 4 – Inventory Valuation Methods Weighted Average • Computes a unit cost by dividing the total acquisition cost of all items available for sale by the number of units available for sale • The weighted-average method produces gross profit somewhere between that obtained under FIFO and LIFO • Perpetual and periodic systems produce different COGS and ending inventory amounts © 2012 Pearson Education Introduction to Financial Accounting, 10/e 18 of 42
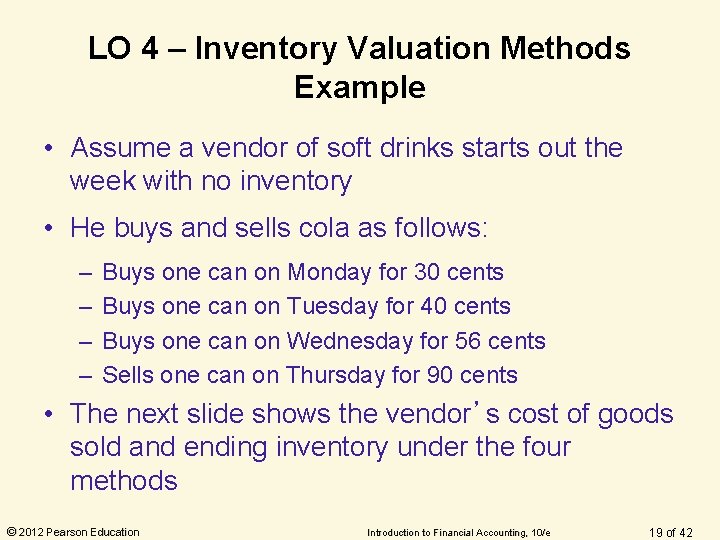
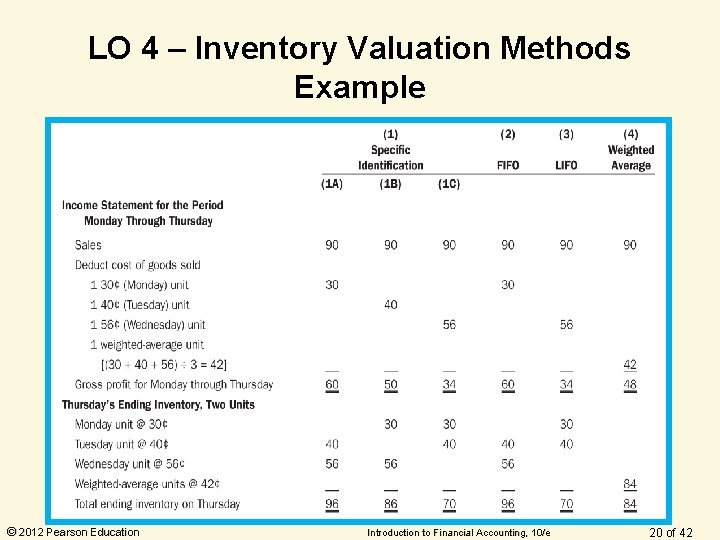
LO 4 – Inventory Valuation Methods Example • Assume a vendor of soft drinks starts out the week with no inventory • He buys and sells cola as follows: – – Buys one can on Monday for 30 cents Buys one can on Tuesday for 40 cents Buys one can on Wednesday for 56 cents Sells one can on Thursday for 90 cents • The next slide shows the vendor’s cost of goods sold and ending inventory under the four methods © 2012 Pearson Education Introduction to Financial Accounting, 10/e 19 of 42
LO 4 – Inventory Valuation Methods Example © 2012 Pearson Education Introduction to Financial Accounting, 10/e 20 of 42
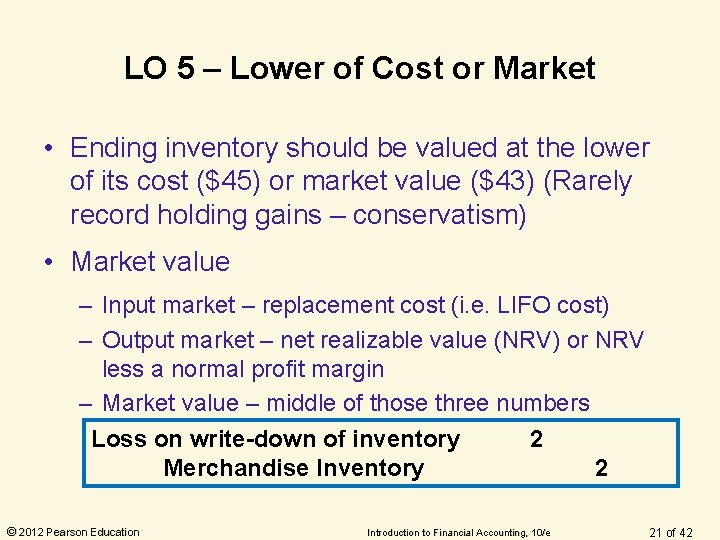
LO 5 – Lower of Cost or Market • Ending inventory should be valued at the lower of its cost ($45) or market value ($43) (Rarely record holding gains – conservatism) • Market value – Input market – replacement cost (i. e. LIFO cost) – Output market – net realizable value (NRV) or NRV less a normal profit margin – Market value – middle of those three numbers Loss on write-down of inventory 2 Merchandise Inventory 2 © 2012 Pearson Education Introduction to Financial Accounting, 10/e 21 of 42
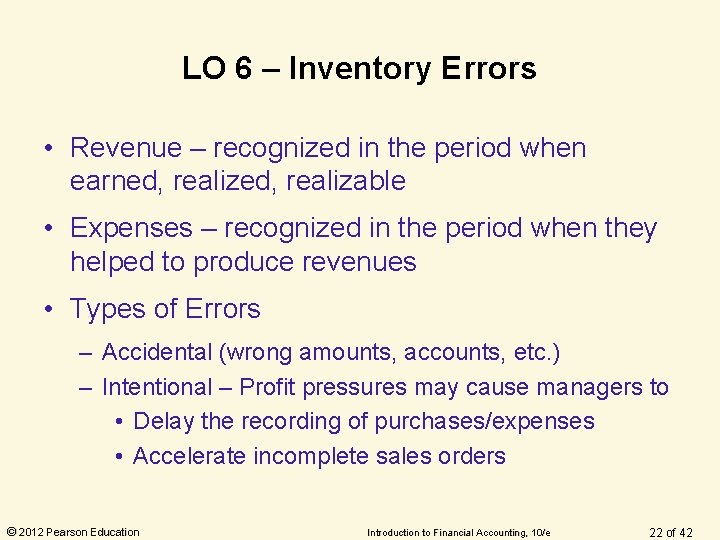
LO 6 – Inventory Errors • Revenue – recognized in the period when earned, realizable • Expenses – recognized in the period when they helped to produce revenues • Types of Errors – Accidental (wrong amounts, accounts, etc. ) – Intentional – Profit pressures may cause managers to • Delay the recording of purchases/expenses • Accelerate incomplete sales orders © 2012 Pearson Education Introduction to Financial Accounting, 10/e 22 of 42
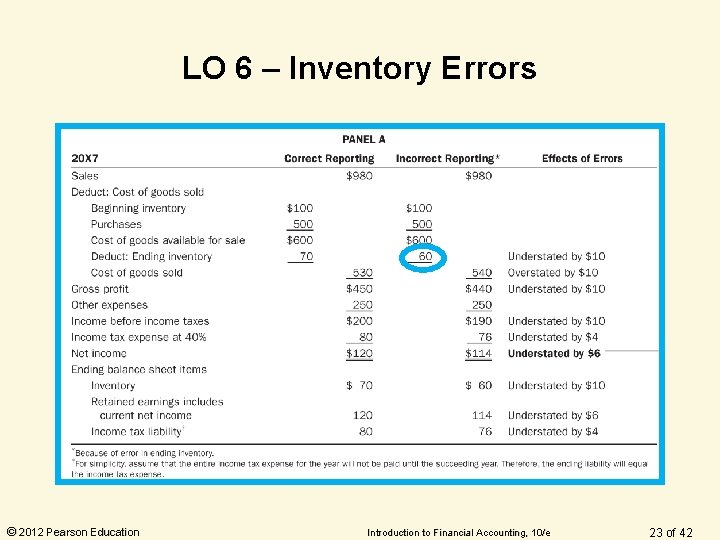
LO 6 – Inventory Errors © 2012 Pearson Education Introduction to Financial Accounting, 10/e 23 of 42
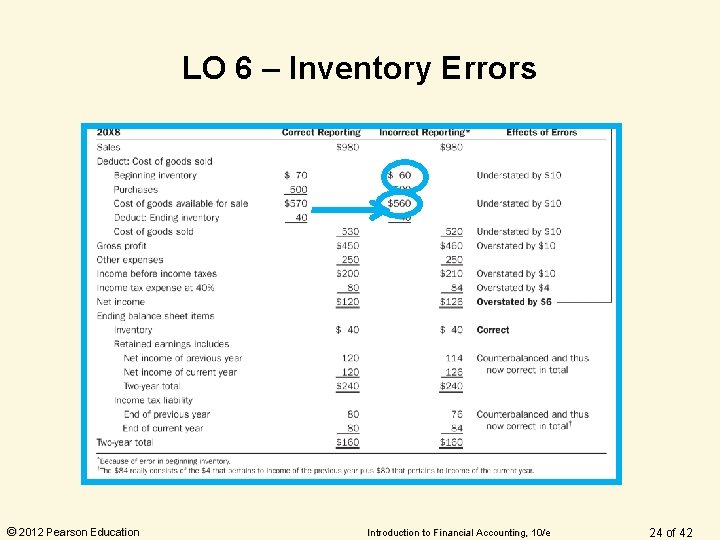
LO 6 – Inventory Errors © 2012 Pearson Education Introduction to Financial Accounting, 10/e 24 of 42
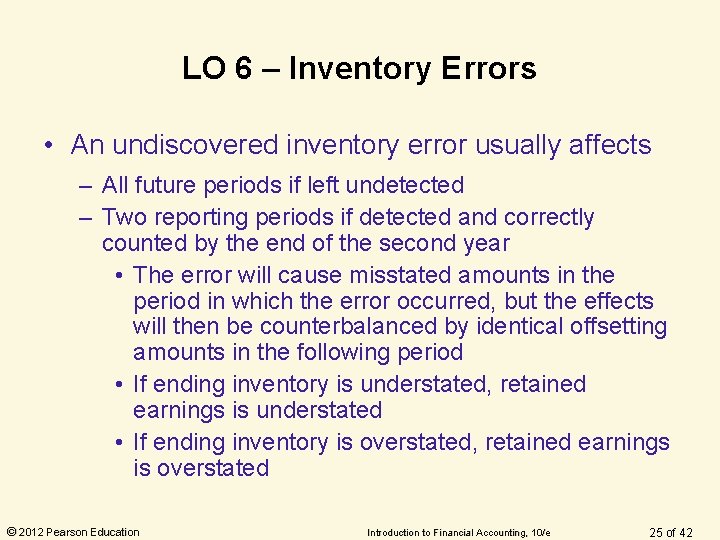
LO 6 – Inventory Errors • An undiscovered inventory error usually affects – All future periods if left undetected – Two reporting periods if detected and correctly counted by the end of the second year • The error will cause misstated amounts in the period in which the error occurred, but the effects will then be counterbalanced by identical offsetting amounts in the following period • If ending inventory is understated, retained earnings is understated • If ending inventory is overstated, retained earnings is overstated © 2012 Pearson Education Introduction to Financial Accounting, 10/e 25 of 42
LO 7 - Inventory Gross Profit and Turnover • Gross profit – Sales Revenue less COGS – Expressed in dollar or percentage terms • Sales Revenue $100, 000 100% • COGS $60, 000 60% • Gross Profit Margin $40, 000 40% – Varies significantly by industry, wholesaler (lower due to volume) versus retailer (higher), presence of R&D, etc. © 2012 Pearson Education Introduction to Financial Accounting, 10/e 26 of 42
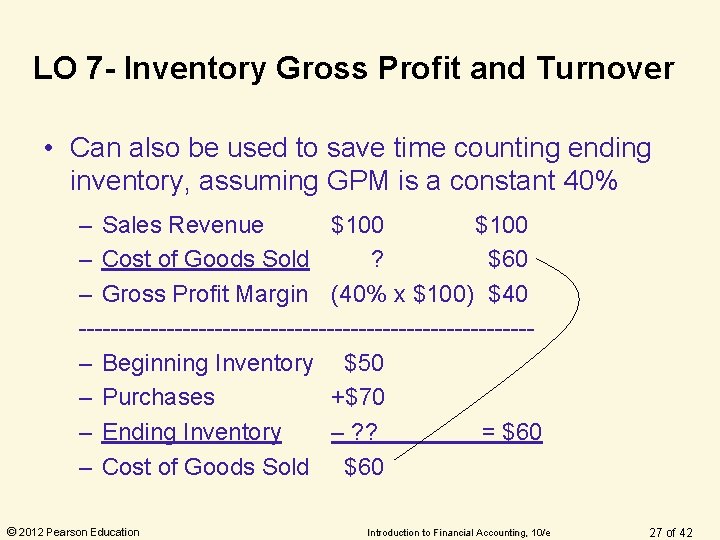
LO 7 - Inventory Gross Profit and Turnover • Can also be used to save time counting ending inventory, assuming GPM is a constant 40% – Sales Revenue $100 – Cost of Goods Sold ? $60 – Gross Profit Margin (40% x $100) $40 ----------------------------– Beginning Inventory $50 – Purchases +$70 – Ending Inventory – ? ? = $60 – Cost of Goods Sold $60 © 2012 Pearson Education Introduction to Financial Accounting, 10/e 27 of 42
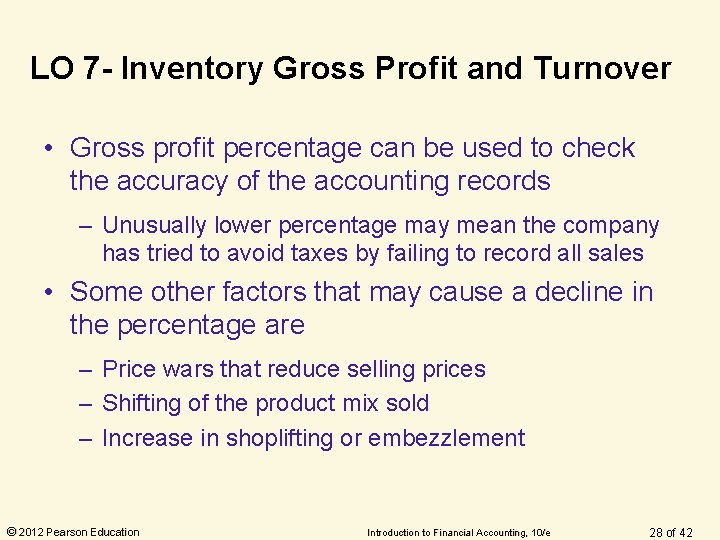
LO 7 - Inventory Gross Profit and Turnover • Gross profit percentage can be used to check the accuracy of the accounting records – Unusually lower percentage may mean the company has tried to avoid taxes by failing to record all sales • Some other factors that may cause a decline in the percentage are – Price wars that reduce selling prices – Shifting of the product mix sold – Increase in shoplifting or embezzlement © 2012 Pearson Education Introduction to Financial Accounting, 10/e 28 of 42
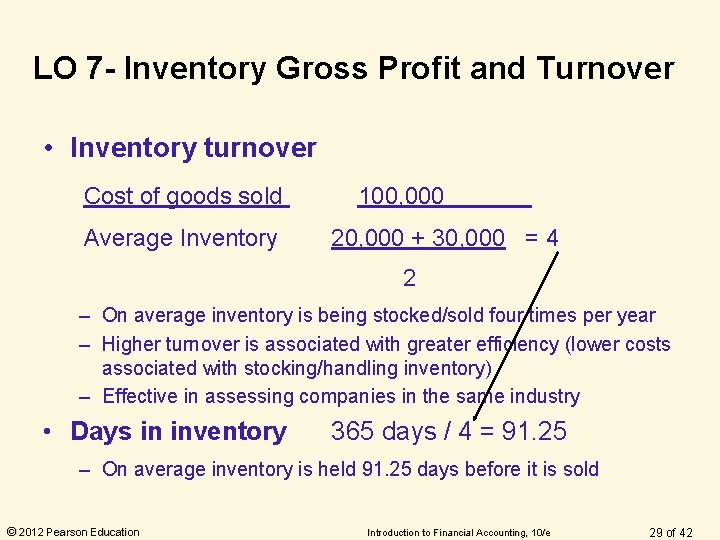
LO 7 - Inventory Gross Profit and Turnover • Inventory turnover Cost of goods sold Average Inventory 100, 000 20, 000 + 30, 000 = 4 2 – On average inventory is being stocked/sold four times per year – Higher turnover is associated with greater efficiency (lower costs associated with stocking/handling inventory) – Effective in assessing companies in the same industry • Days in inventory 365 days / 4 = 91. 25 – On average inventory is held 91. 25 days before it is sold © 2012 Pearson Education Introduction to Financial Accounting, 10/e 29 of 42
LO 7 – Inventory Valuation Methods Miscellaneous • Inventory shrinkage can result from many factors, including shoplifting or employee embezzlement • The best deterrent for shoplifting is an alert employee at the point of sale • Retail stores also use – Sensitized tags on merchandise – Surveillance cameras © 2012 Pearson Education Introduction to Financial Accounting, 10/e 30 of 36
LO 7 – Inventory Valuation Methods Miscellaneous • Shrinkage Example – Cost of inventory from a physical count ($8, 000) – Inventory balance in the general ledger ($8, 200) • Periodic system Already included in COGS • Perpetual system Inventory Shrinkage Merchandise Inventory Cost of Goods Sold Inventory Shrinkage © 2012 Pearson Education 200 200 Introduction to Financial Accounting, 10/e 200 31 of 36