Introscope usage at Insurance Australia Group Insurance Australia



- Slides: 50

Introscope usage at Insurance Australia Group

Insurance Australia Group • Leading general insurer in Australia • A holding group consisting of lots sub companies – NRMA, CGU, Swann, thebuzz Insurance, NZ Insurance, SGIO, SGIC. • Shared Infrastructure group called Enterprise Infrastructure Technology (EIT)

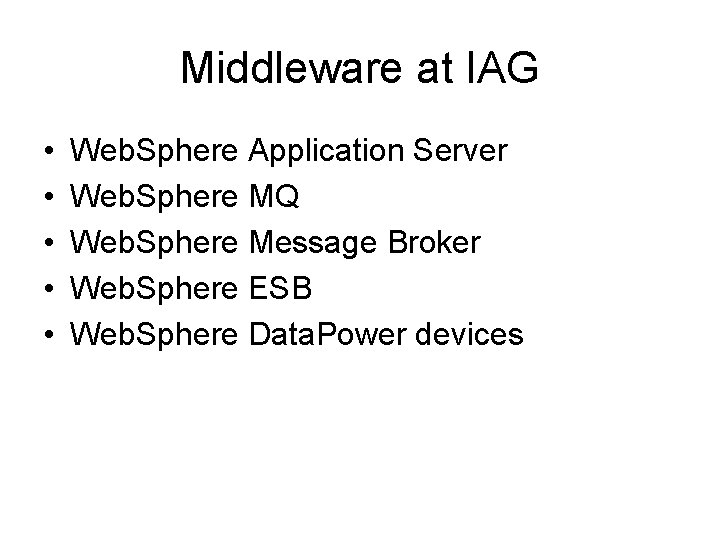
Middleware at IAG • • • Web. Sphere Application Server Web. Sphere MQ Web. Sphere Message Broker Web. Sphere ESB Web. Sphere Data. Power devices

Monitoring at IAG • Converted from IBM Tivoli Software/ITCAM for Web. Sphere to a mix of monitoring products • Looked at HP Mercury, Quest Foglight and CA-Wily Introscope

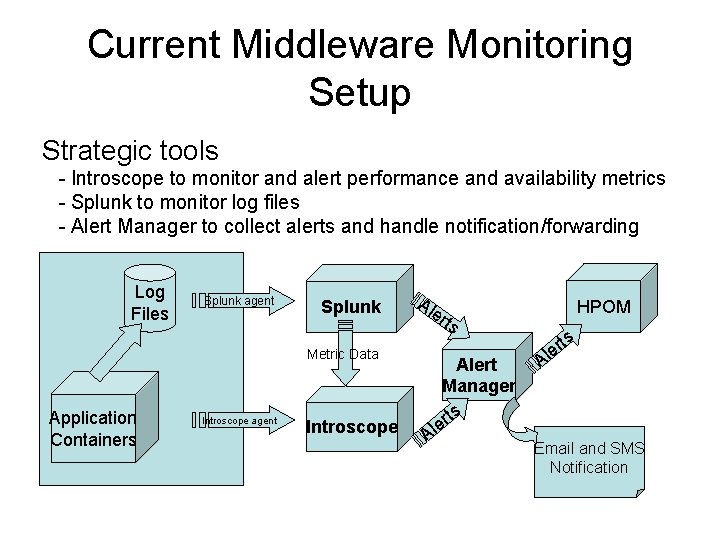
Current Middleware Monitoring Setup Strategic tools - Introscope to monitor and alert performance and availability metrics - Splunk to monitor log files - Alert Manager to collect alerts and handle notification/forwarding Log Files Splunk agent Splunk Al Metric Data Application Containers Introscope agent Introscope HPOM er ts A Alert Manager rts e l A r le ts Email and SMS Notification

Introscope Setup • Not that many dashboards. Need to spend more time on that but generally doesn’t help us monitor • Alerts are more important

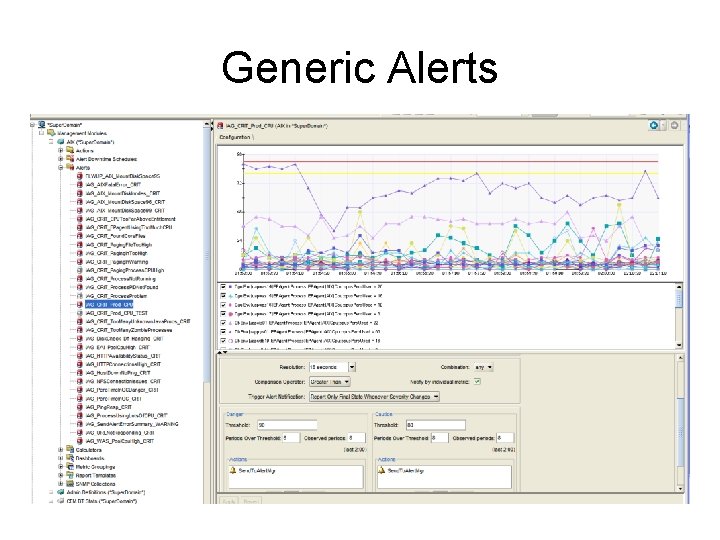
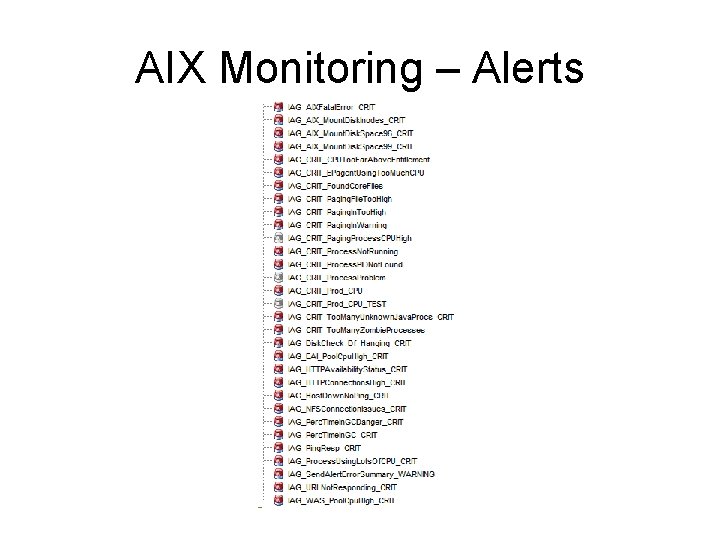
Generic Alerts

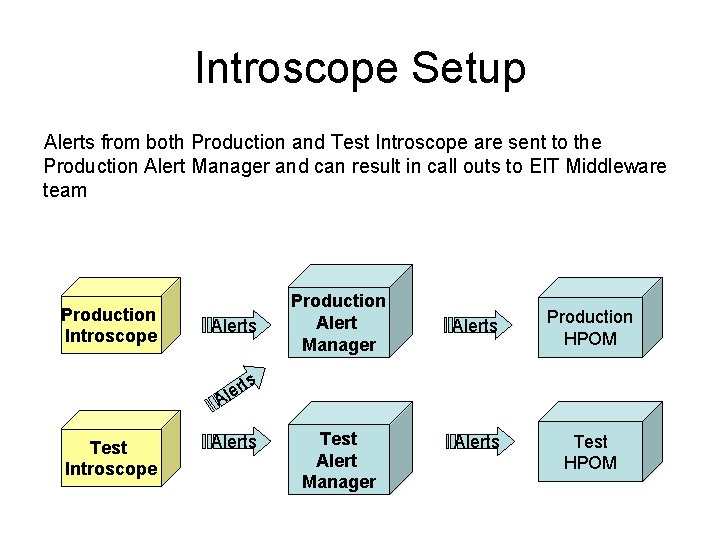
Introscope Setup Alerts from both Production and Test Introscope are sent to the Production Alert Manager and can result in call outs to EIT Middleware team Production Introscope Alerts Production Alert Manager Alerts Production HPOM Alerts Test HPOM s rt e l A Test Introscope Alerts Test Alert Manager

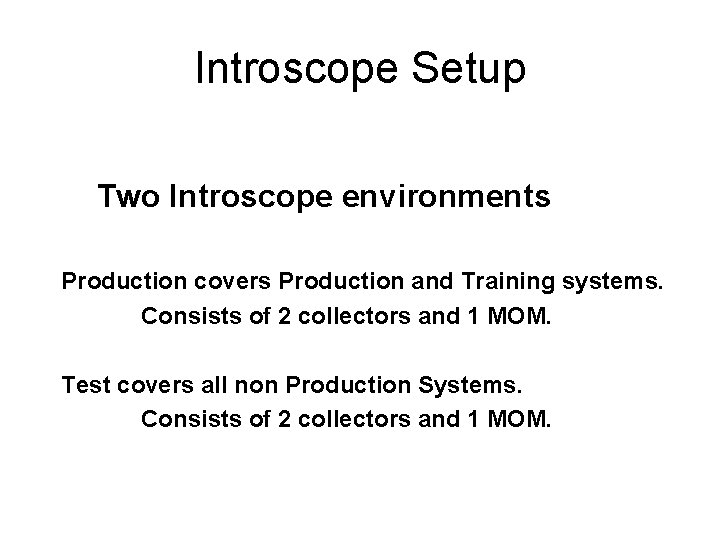
Introscope Setup Two Introscope environments Production covers Production and Training systems. Consists of 2 collectors and 1 MOM. Test covers all non Production Systems. Consists of 2 collectors and 1 MOM.

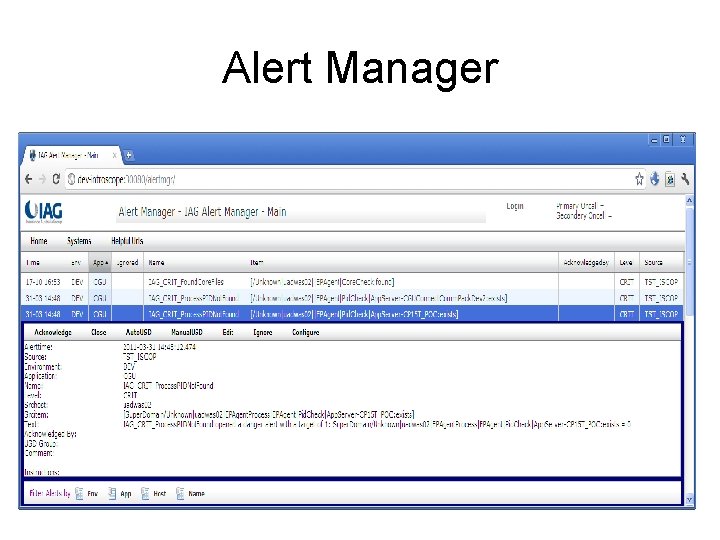
Alert Manager • A Custom Web Application that receives alerts from Introscope and other monitoring systems • Basically a custom CA-NSM or HPOM. • Forwards alerts on to HPOM • Used to blackout and ignore alerts according to date/time and regular expressions • Handles on call notification and allows subscriptions to alerts for Test and Production support teams

Alert Manager

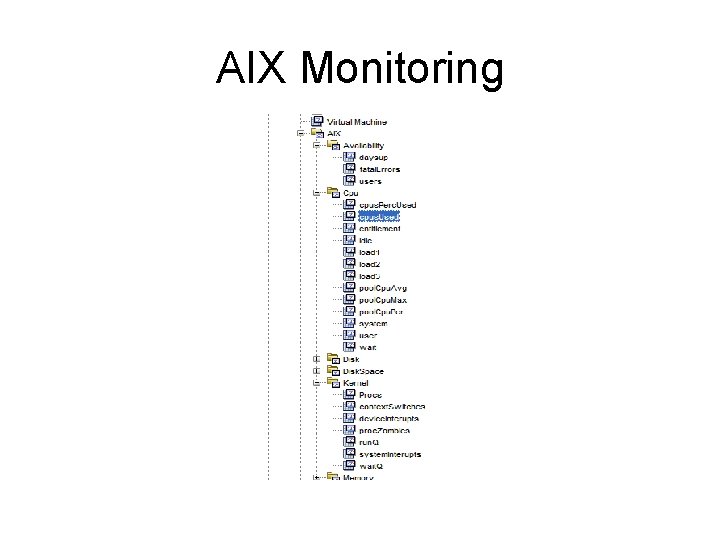
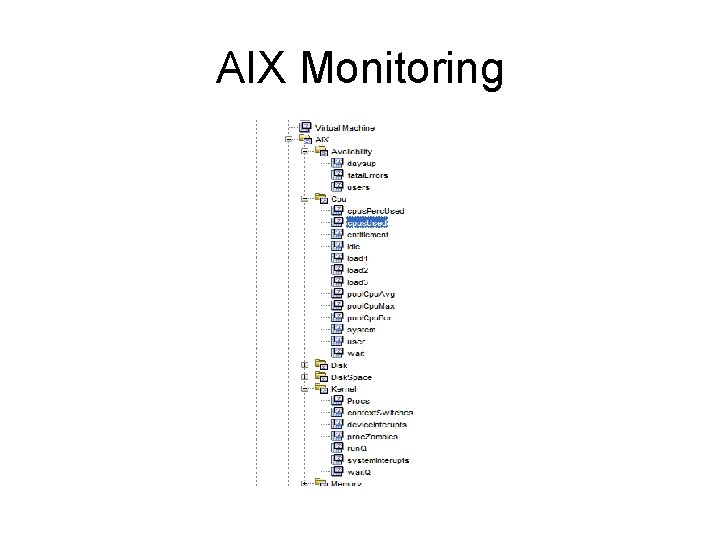
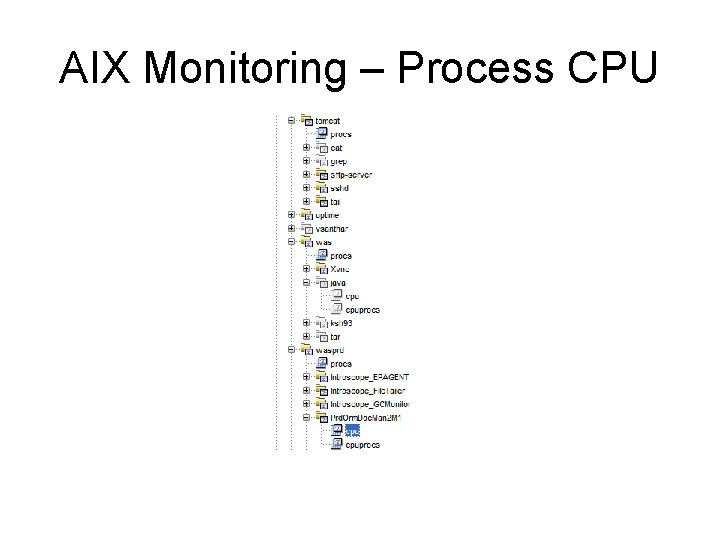
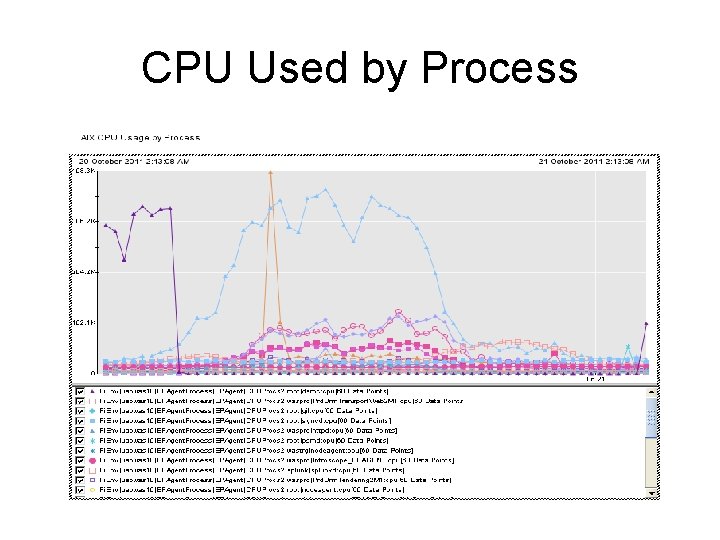
AIX System Monitoring • Scripts from Wily community site with add ons • CPU, Disk, NFSStats, Kernel, Memory, Paging, Network, Net. Stats, WLM, Host Settings

AIX Monitoring

AIX Monitoring

AIX Monitoring – Process CPU

CPU Used by Process

AIX Monitoring – Alerts

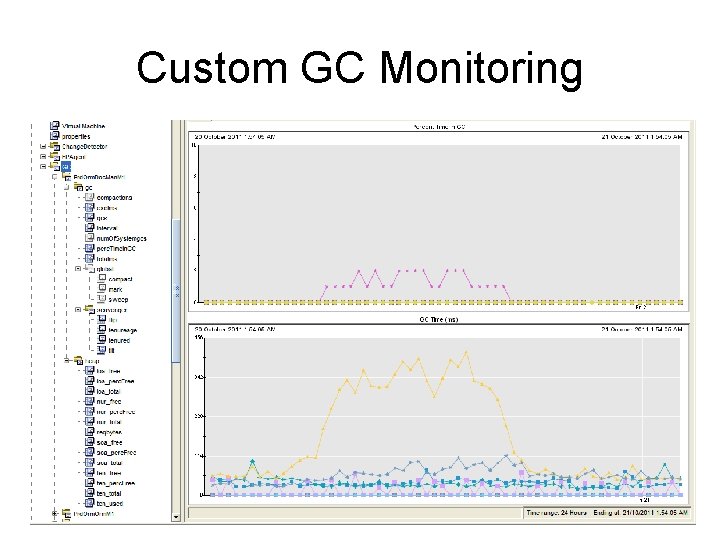
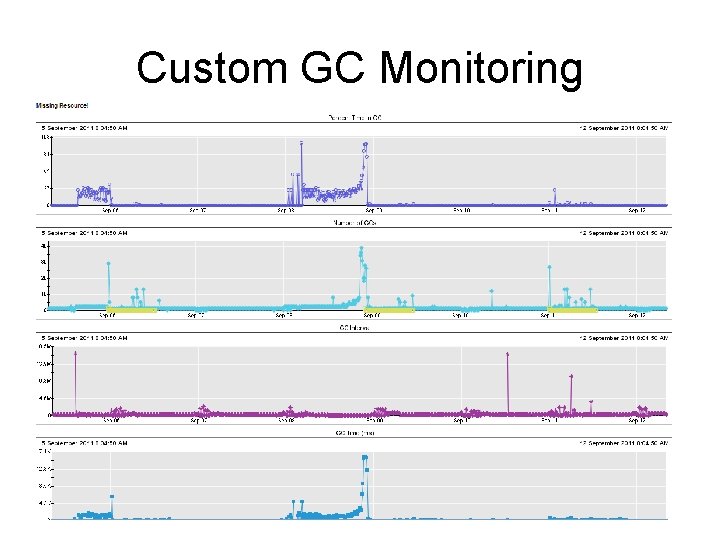
Web. Sphere Application Server monitoring • Standard Introscope Web. Sphere Java Agents • Custom IBM verbose GC log monitoring • Custom WAS Monitoring application

Custom GC Monitoring

Custom GC Monitoring

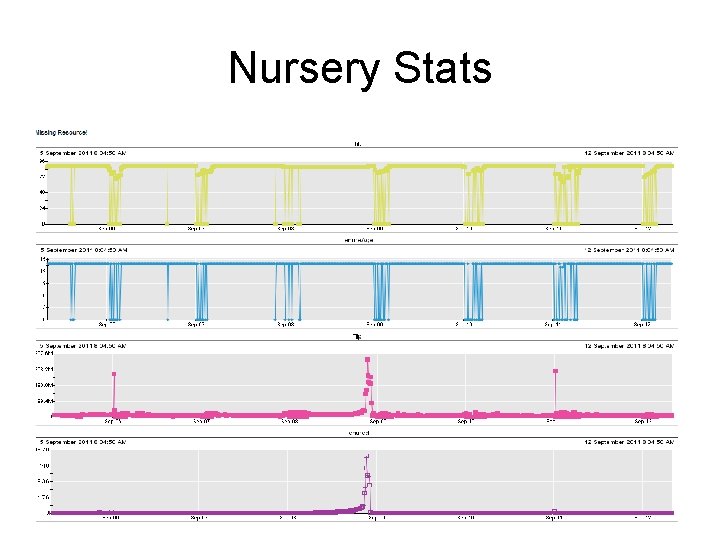
Nursery Stats

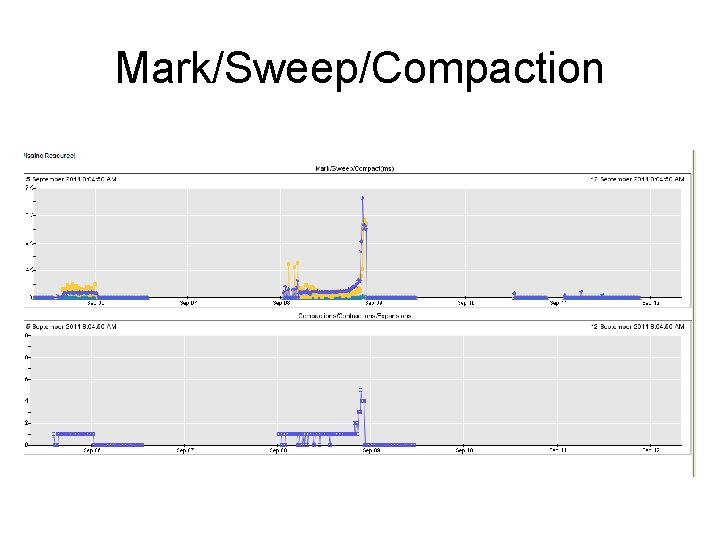
Mark/Sweep/Compaction

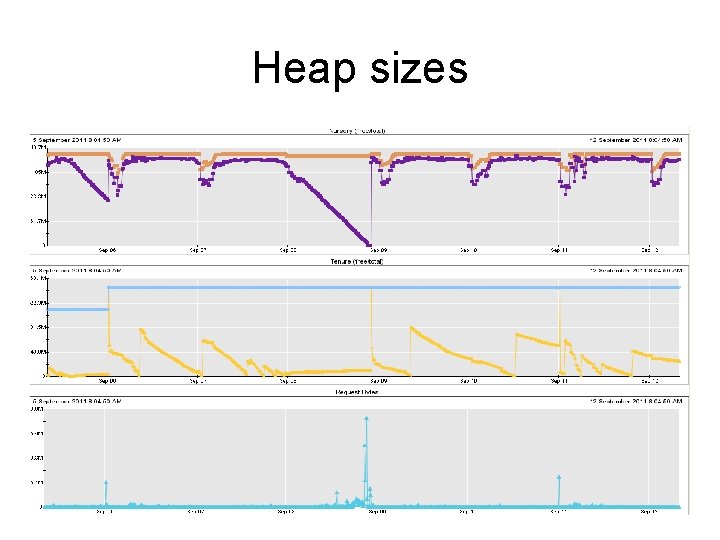
Heap sizes

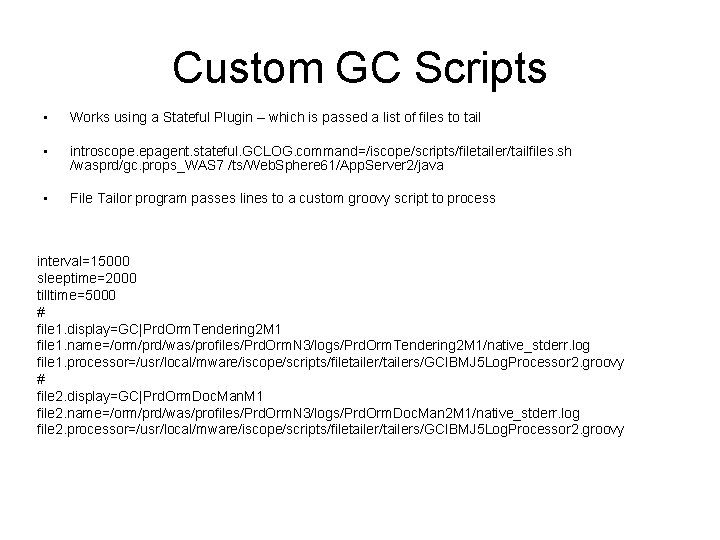
Custom GC Scripts • Works using a Stateful Plugin – which is passed a list of files to tail • introscope. epagent. stateful. GCLOG. command=/iscope/scripts/filetailer/tailfiles. sh /wasprd/gc. props_WAS 7 /ts/Web. Sphere 61/App. Server 2/java • File Tailor program passes lines to a custom groovy script to process interval=15000 sleeptime=2000 tilltime=5000 # file 1. display=GC|Prd. Orm. Tendering 2 M 1 file 1. name=/orm/prd/was/profiles/Prd. Orm. N 3/logs/Prd. Orm. Tendering 2 M 1/native_stderr. log file 1. processor=/usr/local/mware/iscope/scripts/filetailer/tailers/GCIBMJ 5 Log. Processor 2. groovy # file 2. display=GC|Prd. Orm. Doc. Man. M 1 file 2. name=/orm/prd/was/profiles/Prd. Orm. N 3/logs/Prd. Orm. Doc. Man 2 M 1/native_stderr. log file 2. processor=/usr/local/mware/iscope/scripts/filetailer/tailers/GCIBMJ 5 Log. Processor 2. groovy

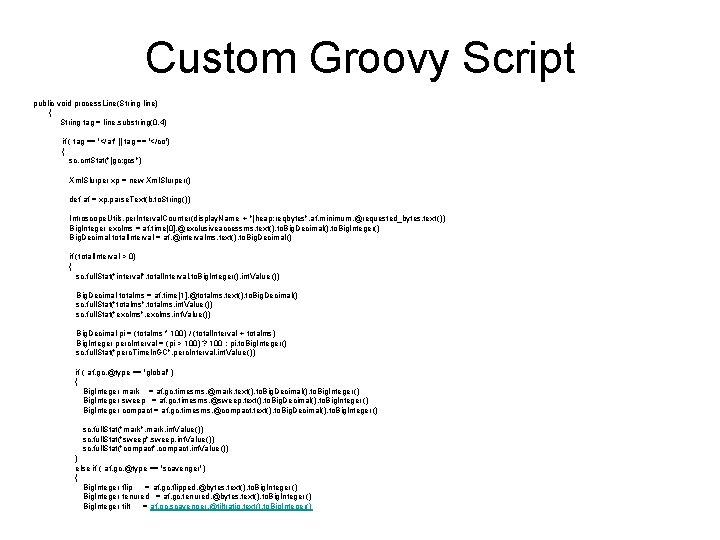
Custom Groovy Script public void process. Line(String line) { String tag = line. substring(0, 4) if ( tag == '</af' || tag == '</co') { sc. cnt. Stat("|gc: gcs") Xml. Slurper xp = new Xml. Slurper() def af = xp. parse. Text(b. to. String()) Introscope. Utils. per. Interval. Counter(display. Name + "|heap: reqbytes", af. minimum. @requested_bytes. text ()) Big. Integer exclms = af. time[0]. @exclusiveaccessms. text(). to. Big. Decimal(). to. Big. Integer() Big. Decimal total. Interval = af. @intervalms. text(). to. Big. Decimal() if (total. Interval > 0) { sc. full. Stat("interval", total. Interval. to. Big. Integer(). int. Value ()) Big. Decimal totalms = af. time[1]. @totalms. text(). to. Big. Decimal() sc. full. Stat("totalms", totalms. int. Value ()) sc. full. Stat("exclms", exclms. int. Value()) Big. Decimal pi = (totalms * 100) / (total. Interval + totalms) Big. Integer perc. Interval = (pi > 100) ? 100 : pi. to. Big. Integer() sc. full. Stat("perc. Time. In. GC", perc. Interval. int. Value ()) if ( af. gc. @type == 'global' ) { Big. Integer mark = af. gc. timesms. @mark. text(). to. Big. Decimal(). to. Big. Integer () Big. Integer sweep = af. gc. timesms. @sweep. text(). to. Big. Decimal(). to. Big. Integer () Big. Integer compact = af. gc. timesms. @compact. text(). to. Big. Decimal(). to. Big. Integer () sc. full. Stat("mark", mark. int. Value()) sc. full. Stat("sweep", sweep. int. Value ()) sc. full. Stat("compact", compact. int. Value ()) } else if ( af. gc. @type == 'scavenger' ) { Big. Integer flip = af. gc. flipped. @bytes. text(). to. Big. Integer () Big. Integer tenured = af. gc. tenured. @bytes. text(). to. Big. Integer () Big. Integer tilt = af. gc. scavenger. @tiltratio. text(). to. Big. Integer()

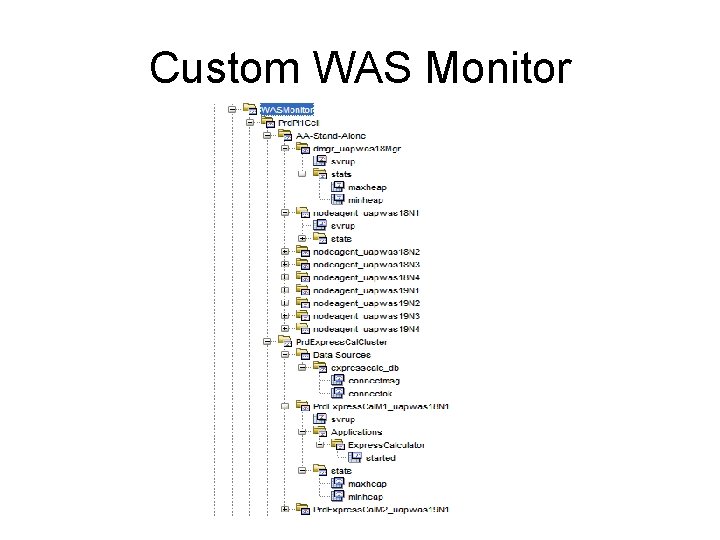
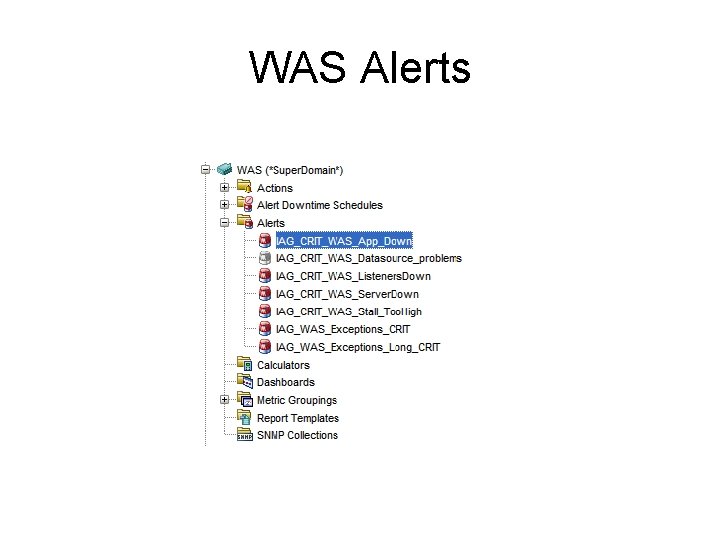
Custom WAS Monitor • Monitors WAS components • Servers up/down including Node agents + Deployment Managers • Applications up/down • Data. Sources ok • Listeners and Activation Specs up/down

Custom WAS Monitor

WAS Alerts

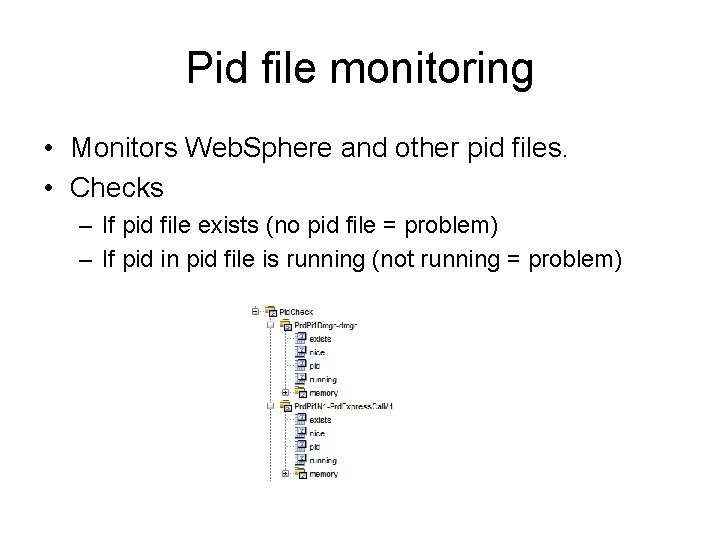
Pid file monitoring • Monitors Web. Sphere and other pid files. • Checks – If pid file exists (no pid file = problem) – If pid in pid file is running (not running = problem)

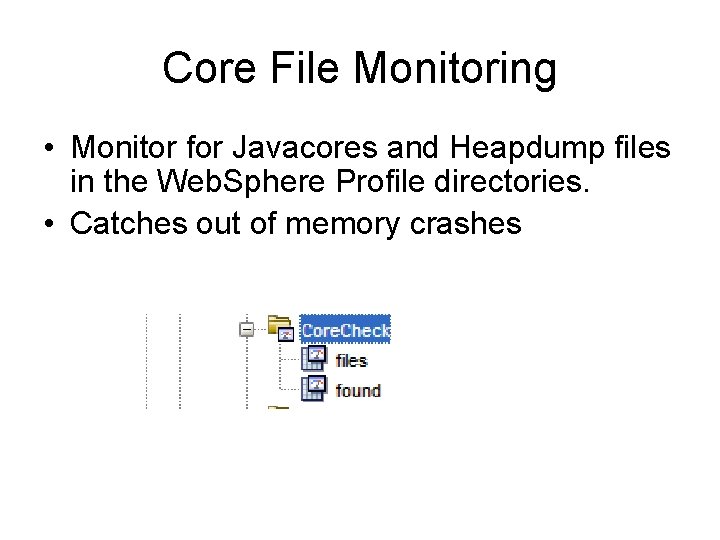
Core File Monitoring • Monitor for Javacores and Heapdump files in the Web. Sphere Profile directories. • Catches out of memory crashes

Web. Sphere MQ monitoring • Custom perl script to monitor queue depths • Partly historical from Tivoli Monitoring • Added due to overhead of adding alerts for numerous different queues • Monitors Queue Depths, Message Age and Input Processes at varying levels for selected queues (or queue regular expressions)

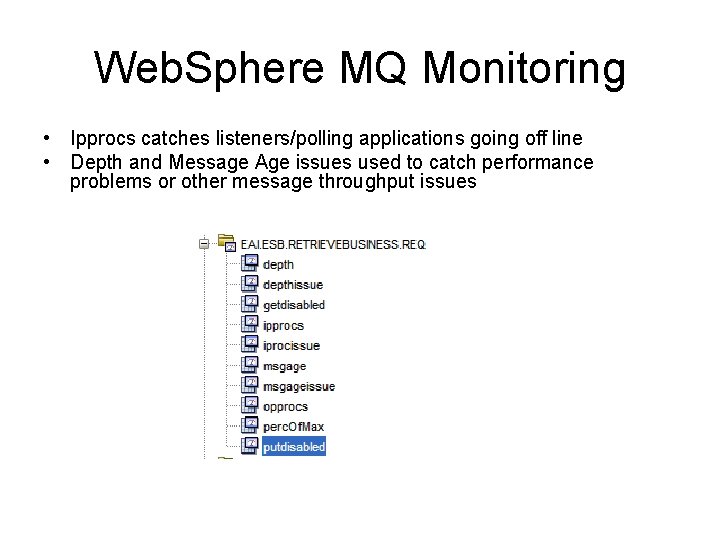
Web. Sphere MQ Monitoring • Ipprocs catches listeners/polling applications going off line • Depth and Message Age issues used to catch performance problems or other message throughput issues

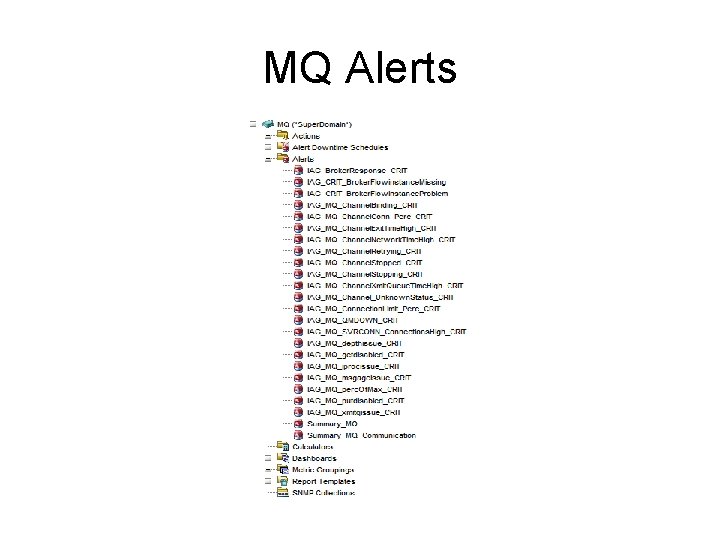
MQ Alerts

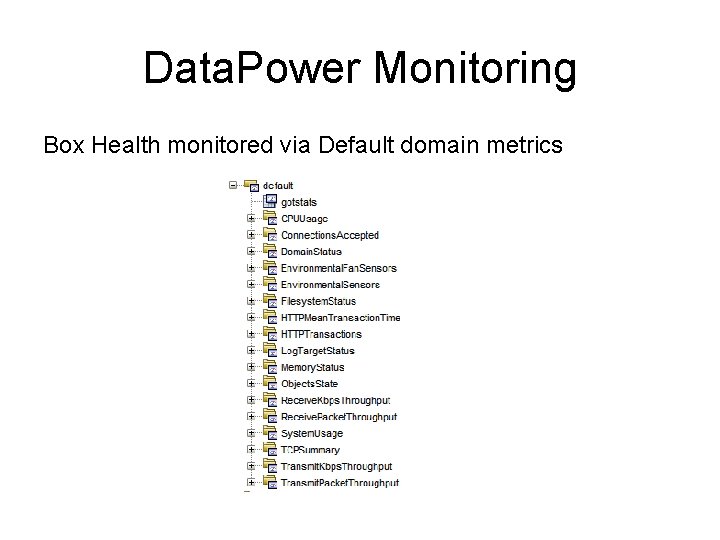
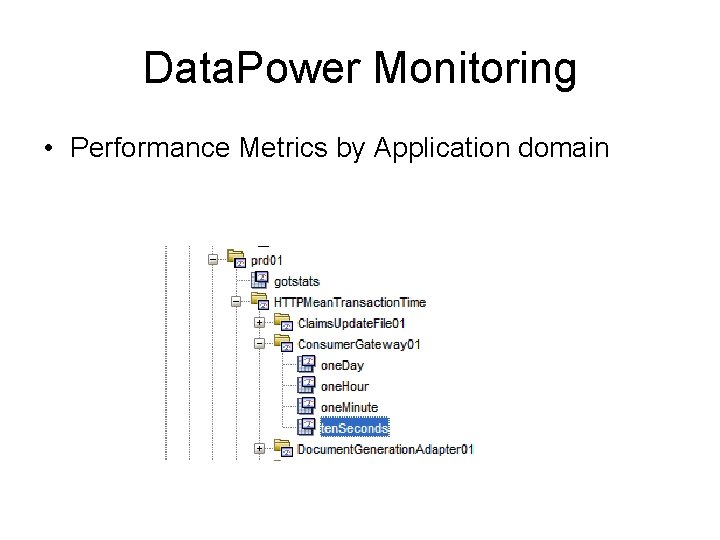
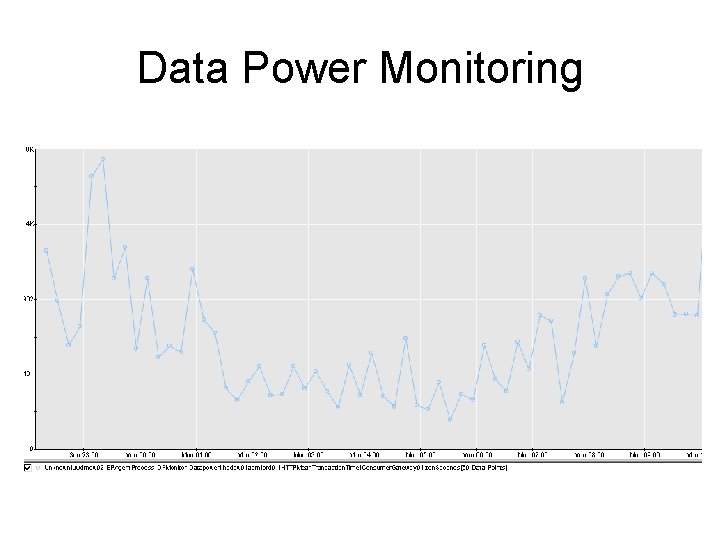
Data. Power Monitoring • Custom Java/Groovy app to poll Data. Power box using SOAP interface to get statistics • Monitors CPU, Memory, File. Systems, Domain and Object Status, along with Network connections in the default domain • Monitors Transaction Time and Throughput in Application domains

Data. Power Monitoring Box Health monitored via Default domain metrics

Data. Power Monitoring • Performance Metrics by Application domain

Data Power Monitoring

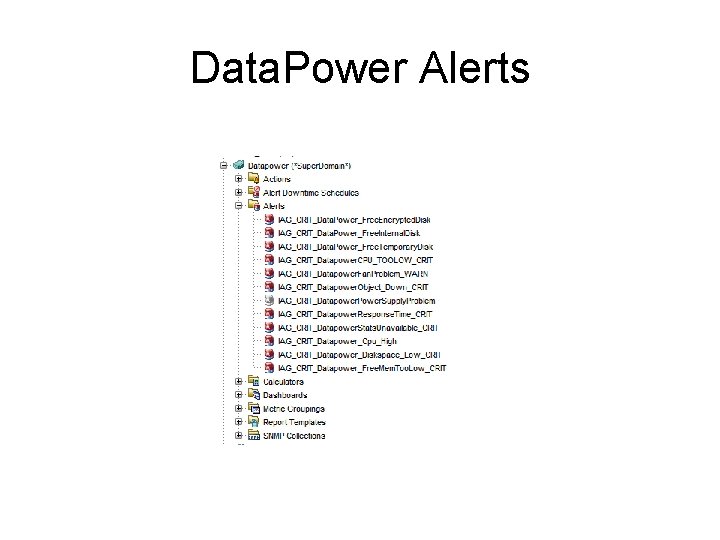
Data. Power Alerts

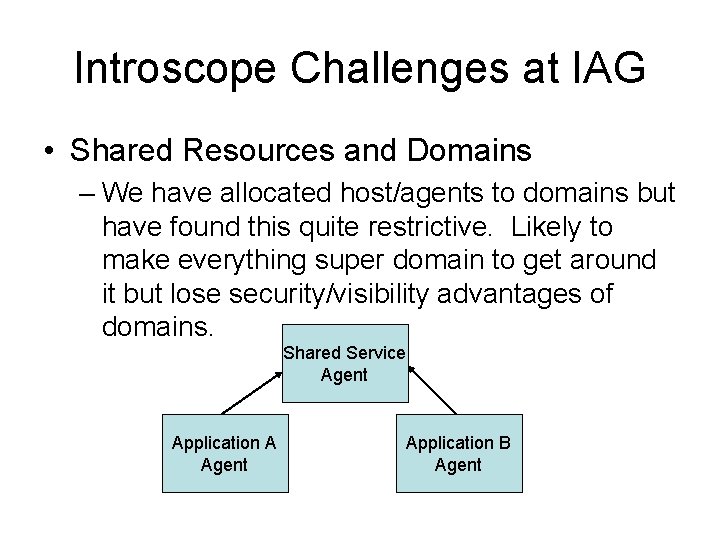
Introscope Challenges at IAG • Shared Resources and Domains – We have allocated host/agents to domains but have found this quite restrictive. Likely to make everything super domain to get around it but lose security/visibility advantages of domains. Shared Service Agent Application A Agent Application B Agent

Introscope Challenges at IAG • Shared Resources and Domains – ** WISH – Wily would allow an agent to be part of multiple domains **

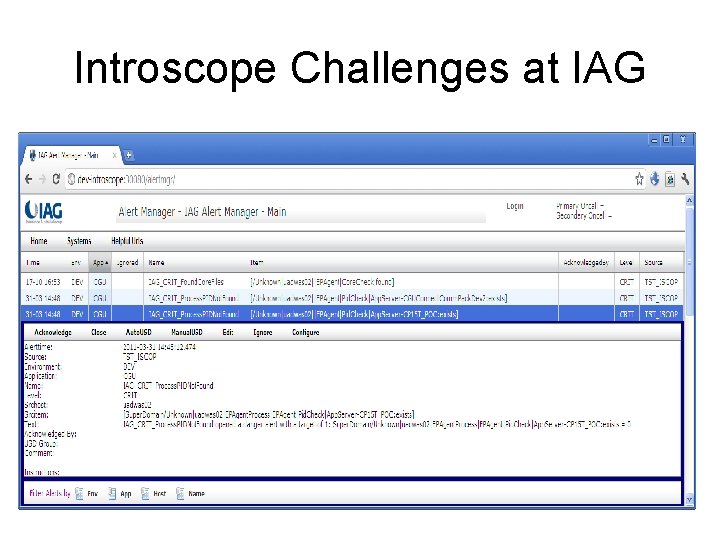
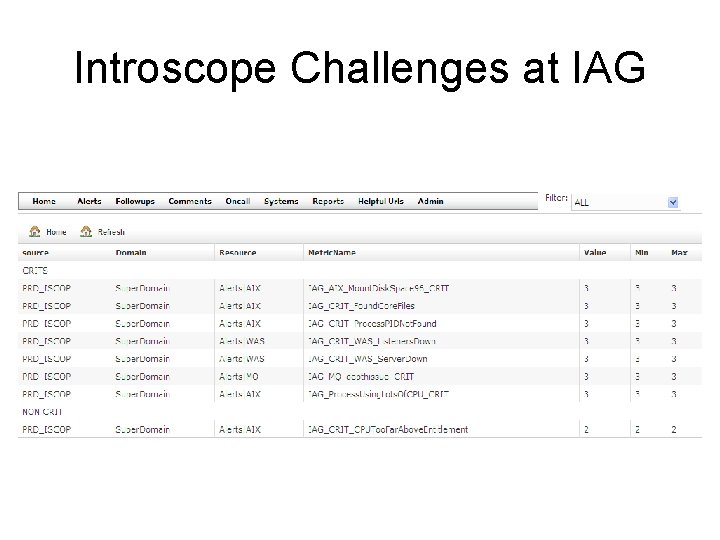
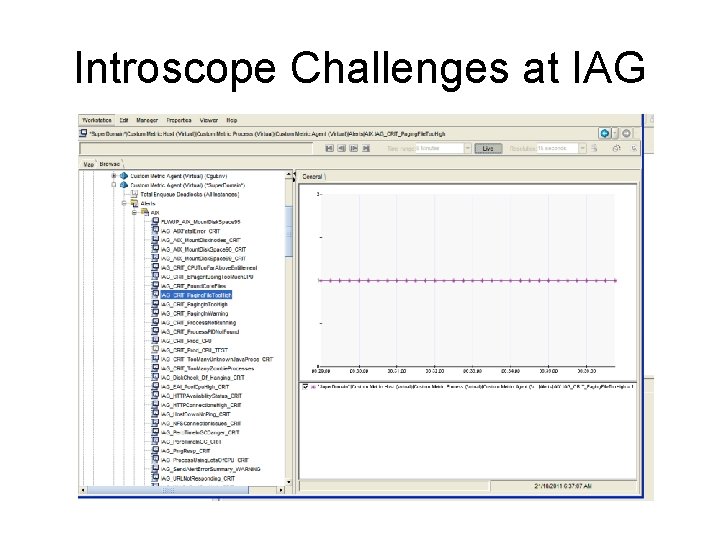
Introscope Challenges at IAG • Alert Monitoring – Keeping Alert monitoring app and Introscope in sync. Once an alert is sent from Introscope at the moment it is quite difficult to find out what metric caused the alert. You can see that an alert is triggered but without going to console and looking around hard to find what triggered the alert – This means that if alerts are missed our alerting collection app gets out of sync. – ** WISH – we could query current active alerts + metrics causing it in Introscope - Possible WS that does this but haven’t had time to find/work it out. Last I checked the WS still just reported on open Alerts but not the metrics causing them ***

Introscope Challenges at IAG • Alert Monitoring – Keeping Alert monitoring app and Introscope in sync. Once an alert is sent from Introscope at the moment it is quite difficult to find out what metric caused the alert. You can see that an alert is triggered but without going to console and looking around hard to find what triggered the alert – This means that if alerts are missed our alerting collection app gets out of sync.

Introscope Challenges at IAG

Introscope Challenges at IAG

Introscope Challenges at IAG

Introscope Challenges at IAG

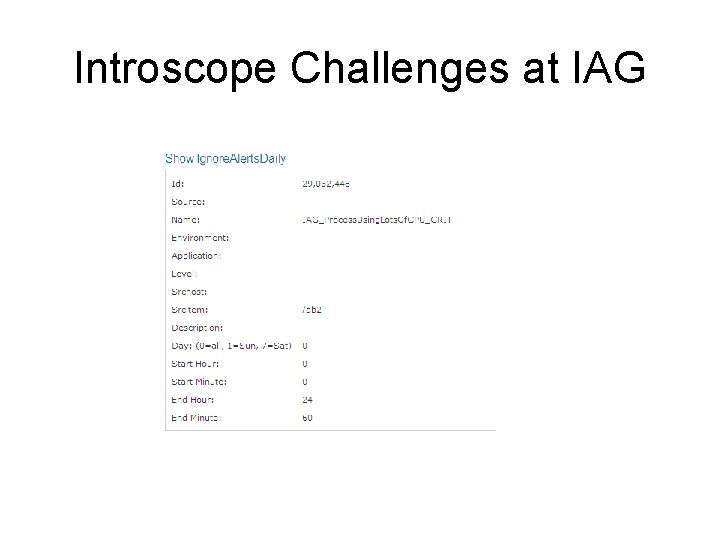
Introscope Challenges at IAG • Alert Blackouts – Easy to Blackout a WHOLE Alert. However we use lots of generic alerts and as such have these alerts going off at different times due to Server/Application bounces and other events. – Wrote Alert Manager application to control this so we could blackout by Alert + Metric

Introscope Challenges at IAG

Introscope Challenges at IAG • Alert Blackouts WISH we could blackout either Alert + metric OR Agent OR Metric Group

Questions • ? ? ?