Introductory Session Time 1 hour Introductory Session Learning


: Nonpregnant/lactating Pregnant/lactating")


 Increased requirement during 3 rd trimester")


 Services • Nutrition assessment and classification • Nutrition")


, BMI,")


 • BMI is a reliable indicator of body fatness and")

 • Measure the adolescent’s weight and height. •")


 • Explain the meaning of ‘counselling’ and what makes it effective.")
 • Demonstrate communication techniques needed for effective counselling. • Use the")


 Wheel • Key tool for assessment and classification • Gateway")

 3. 29")


 • Ensures that health services are")


 that are")


 that may")


, BMI,")
: BMI-for-age: ≥")
: BMI-for-age: Overweight:")
: BMI for-age: ≥")
:")
:")


 for")


 title that includes Results")


 • Part 1—Information systems assessment: Involves quantitative")


 • Ensures that health services are")


 that are")


 that may")


- Slides: 169
Introductory Session Time: 1 hour
Introductory Session Learning Objectives • Discuss expectations and relate them to the course objectives • Take a pre-test to assess knowledge of NCST • Outline the required NCST competency standards
NCST Course Objectives 1. Understand the role of nutrition in the care and treatment of PLHIV and TB patients 2. Assess and classify the nutritional status of clients 3. Provide nutrition counselling to clients 4. Select an appropriate nutrition care plan for a client based on his/her nutritional status 5. Prescribe therapeutic and supplementary foods for undernourished clients 6. Collect information on, monitor, and report on NCST services 7. Manage the quality of NCST services at the facility level
Components of NCST 1. Nutrition assessment and classification 2. Nutrition counselling and education 3. Nutrition care plans and support 4. NCST monitoring and reporting 5. Managing the quality of NCST services
Training Methods • Lectures with slide presentations • Discussions • Group work • Role plays • Demonstrations • Written exercises • Site practice visit
NCST Competencies and Standards • Competence can be defined as the ability to apply knowledge and skills to produce a required nutrition outcome. • Competency standards are the range of skills that are needed to achieve a desired nutrition outcome. • Competency is a combination of knowledge, ability, and skill. • Refer to Reference 0. 3 to review the required NCST competencies
Module 1: Introduction to Nutrition Time: 4 hours 1. 1
Module 1: Learning Objectives 1. Explain the importance of nutrition for good health. 2. Describe the link between nutrition and infection. 3. Explain the keys to food and water safety and good hygiene. 4. Assist clients with dietary management of symptoms and ART side effects. 5. List interventions that can prevent and manage malnutrition. 1. 2
Food and Nutrients • Food is anything eaten or drunk that provides the body with nutrients. • Nutrients are chemical substances in food that are released during digestion and provide energy and nourishment to maintain, repair, or build body tissues. Nutrients include macronutrients and micronutrients. – Macronutrients include carbohydrates, protein, and fat (needed in large amounts). – Micronutrients include vitamins and minerals (needed only in small amounts). 1. 3
Malnutrition • Malnutrition occurs when energy and nutrient intake do not match dietary needs. Malnutrition can either be undernutrition or overnutrition. – Undernutrition is the result of taking in an inadequate amount or combination of nutrients to carry out needed body functions. – Overnutrition is the result of taking in more energy than the body needs over time. 1. 4
Importance of Good Nutrition Good nutrition can: • Help people feel physically and mentally strong and look healthy • Strengthen the immune system • Help people stay productive and able to do physical activities • Help prevent wasting • Improve drug adherence and effectiveness • Help manage common symptoms and drug side effects Poor nutrition can: • Weaken the immune system • Increase vulnerability to infections • Reduce the body’s ability to recover from infections 1. 5
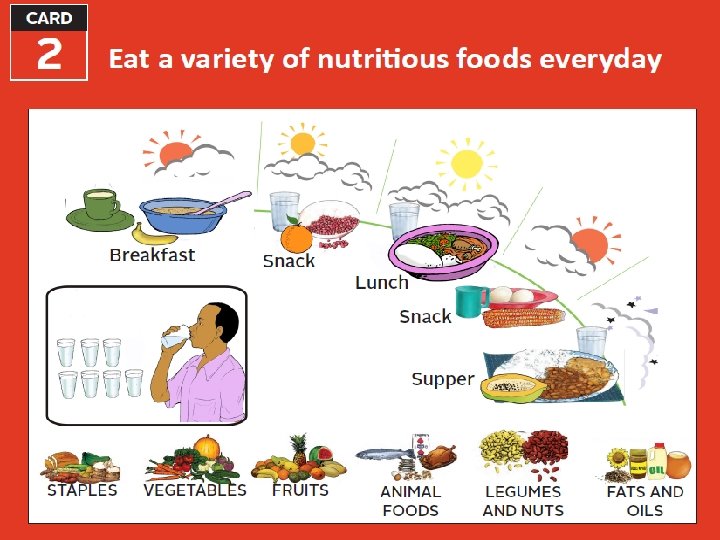
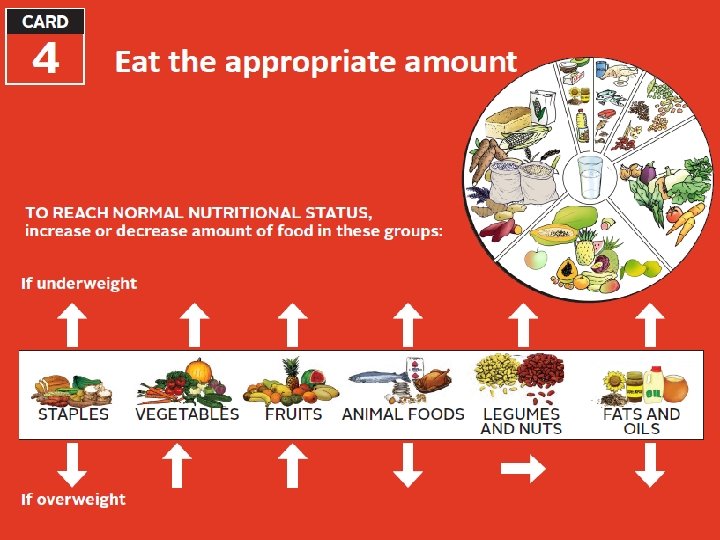
Malawi’s Six Food Groups 1. 6
Daily Energy Requirements Group Adolescents 15– 18 years Adults (≥ 18 years): Nonpregnant/lactating Pregnant/lactating women (during the first 6 months of lactation) Kilocalories (kcal)/day 2, 800 2, 000– 2, 580 2, 460– 2, 570 Source: WHO, FAO, and United Nations University (UNU). 2001. Human Energy Requirements: Report of a Joint WHO/FAO/UNU Expert Consultation, 17– 24 October, 2001. Geneva: WHO. 1. 7
Energy Requirements during Pregnancy and Lactation First trimester +85 kcal/day Second trimester +285 kcal/day Third trimester +475 kcal/day During the first 6 months of lactation +505 kcal/day 1. 8
Cycle of Poor Nutrition and Infection 1. Higher energy needs because of poor nutrient absorption, symptoms, and infection 2. Weight loss, muscle wasting, and vitamin and mineral deficiency Infection, e. g. , HIV or TB 4. More chance of getting infections and faster progression to AIDS or active TB disease 3. Immune system too weak to fight infections 1. 9
Energy Requirements for PLHIV • HIV-infected adult in early/asymptomatic stage: 10% more energy • HIV-infected adult in late/symptomatic stage: 20% more energy • HIV-infected adolescent – Asymptomatic: 10% more energy – Symptomatic: 20– 30% more energy Source: WHO. 2003. Nutrient Requirements of People Living with HIV/AIDS: Report of a Technical Consultation, Geneva, 13– 15 May 2003. Geneva: WHO. 1. 10
Nutrition and TB • TB reduces appetite and increases energy expenditure, causing wasting. • Underweight people are at risk of developing active TB. • Poor nutritional status may speed up progression from TB infection to TB disease. • Protein loss in TB patients can cause nutrient malabsorption. • Increased energy expenditure and tissue breakdown increase energy needs in people with TB. • Poor appetite makes people with TB unable to eat enough to meet their increased micronutrient needs. 1. 11
Energy Requirements during Pregnancy Group Average intake (kcal) Increased requirement during 3 rd trimester (kcal) Healthy 2, 000 +475 HIV+ 2, 000 asymptomatic HIV+ symptomatic 2, 000 Increased requiremen Total needs t for HIV (kcal) 2, 475 +200– 257 (10%) 2, 675 – 2, 732 +475 +400– 514 (20%) 2, 875 – 2, 989 1. 12
Breaking the Nutrition/Infection Cycle Good nutritional status Nutritional needs met Nutrition Interventions Reduced vulnerability to infection Stronger immune system 1. 13
Food and Water Safety and Hygiene Food safety: Preventing food contamination and food-borne illness through proper preparation, cooking, and storage Water safety: Preventing water contamination and water-borne illness through proper treatment and storage Hygiene: Conditions or practices that help maintain health and prevent disease, especially through cleanliness 1. 14
Food and Water Safety for PLHIV • People who are ill are at higher risk of becoming infected if exposed to dangerous bacteria in food and water. • When PLHIV or TB patients get sick, their illness is likely to be more severe and last longer. • PLHIV or TB patients may have a hard time recovering from illness. • Illness and nausea may reduce food intake and cause weight loss that is difficult to recover. • Water- and food-borne illness can damage the mucosal lining of the gut and impair nutrient absorption. 1. 15
Interaction between Food and ART Poor nutrition reduces drug absorption ↕ Drug side effects can reduce nutrient absorption Poor nutrition worsens drug side effects ↕ Drug side effects reduce appetite and lead to poor nutrition 1. 16
Nutrition Care, Support, and Treatment (NCST) Services • Nutrition assessment and classification • Nutrition counselling and education • Nutrition care plans and support – Provision of therapeutic and/or supplementary food for severely and moderately malnourished clients – Education on household water treatment methods and personal and household hygiene – Micronutrient supplementation – Referral to other facility services and economic strengthening, livelihoods, and food security support services 1. 17
Module 2: Nutrition Assessment and Classification Time: 6 hours 2. 1
Module 2: Learning Objectives 1. Take and interpret anthropometric measurements accurately 2. Conduct clinical, biochemical, and dietary assessments 3. Classify nutritional status correctly based on nutrition assessment 2. 2
Importance of Nutrition Assessment • Identifies people at risk for malnutrition for early intervention or referral • Identifies malnourished clients who require intervention • Detects diet habits that increase the risk of disease • Identifies need for nutrition education and counselling • Tracks growth and weight trends • Provides information for selecting a nutrition care plan 2. 3
Types of Nutrition Assessment 1. Anthropometry • Weight, height, mid-upper arm circumference (MUAC), BMI, and BMI-for-age 2. Biochemical • Laboratory tests 3. Clinical • Medical conditions that can affect nutritional status • Bilateral pitting oedema • Appetite test 4. Dietary • 24 -hour recall • Usual intake 2. 4
Anthropometry is the measurement of the size, weight, and proportions of the human body. Anthropometric measurements can be used to assess the nutritional status of individuals and population groups. 2. 5
Anthropometric Measurements Used in NCST • Weight • Height • MUAC Some anthropometric measurements presented as indexes: • BMI-for-age 2. 6
How Often Should Weight Be Measured? All adolescent and adult clients should be weighed as follows: • With normal nutritional status: During the next ART, ANC, or TB visit (2– 3 months) • With moderate malnutrition: Every month • With severe malnutrition: Every 2 weeks for the first month, thereafter every month • With overweight and obesity: Every month 2. 7
How Often Should Height Be Measured? • Adolescents are still growing. Their height should be taken at every visit. • Adults should have their height taken only once. 2. 8
Body Mass Index (BMI) • BMI is a reliable indicator of body fatness and an inexpensive and simple way to measure adult malnutrition. It is used for adults 19 years and older. • WHO has established BMI cutoffs that are used to classify nutritional status. • BMI is not accurate in pregnant women or adults with oedema, whose weight gain is not linked to nutritional status. For these groups, MUAC should be used. 2. 9
BMI Cutoff Points to Classify Nutritional Status BMI Nutritional Status < 16. 0 Severe underweight 16. 0 to 18. 4 Moderate underweight 18. 5 to 24. 9 Normal 25. 0 to 29. 9 Overweight ≥ 30. 0 Obese Source: WHO. 1995. Physical Status: The Use and Interpretation of Anthropometry: Report of a WHO Expert Committee. WHO Technical Report Series 854. Geneva: WHO. 2. 10
BMI-for-Age for Adolescents (15– 18 Years) • Measure the adolescent’s weight and height. • Determine the BMI using the formula, the BMI reference table for adolescents, or a BMI wheel. • After identifying the adolescent’s BMI, use the BMIfor-age reference tables or BMI wheel to determine nutritional status. • Boys and girls have separate BMI-for-age reference tables. 2. 11
BMI-for-Age Cutoff Points to Classify Nutritional Status BMI-for-Age Z-Score Nutritional Status < -3 Severe underweight ≥ -3 to <-2 Moderate underweight ≥ -2 to < +1 Normal ≥ +1 to < +2 Overweight ≥ +2 Obese Source: WHO. 2007. Growth Reference Data for 5– 19 Years. http: //www. who. int/growthref/en/ 2. 12
Measuring MUAC: Find the Midpoint of Upper Arm • Always use the left arm. • Bend the left arm at a 90 o angle. • Find the arm end points at the tip of the shoulder and tip of the elbow. • Use thumbs to place tape at the end points. • Fold tape so that the end points meet. • Make a mark on the arm’s midpoint, where the tape is folded. 2. 13
Measuring MUAC: Measure the Circumference • Straighten the arm. • Wrap the tape around the midpoint and thread the tape through the window. • Adjust the tension of the tape so that it is not too tight or too loose. • Record the measurement in mm where the arrows point inward. 2. 14
MUAC Cutoff Points to Classify Nutritional Status Group Adolescents 15– 18 years Adults (including pregnant and lactating women up to 6 months postpartum) Severe Underweight Moderate Underweight Normal < 185 mm 185 to 219 mm ≥ 220 mm < 190 mm 190 to 219 mm ≥ 220 mm* * 220 to 229 mm for pregnant women and lactating women up to 6 months post-partum 2. 15
Weight Gain During Pregnancy Pre-pregnancy MUAC or MUAC during the first trimester Recommended total weight gain Minimum weight gain per month < 220 mm 13– 18 kg 2 kg ≥ 220 mm to 299 mm 11– 16 kg 1 kg ≥ 300 mm 7– 11 kg 0– 0. 5 kg 2. 16
Biochemical Assessment – Blood Haemoglobin Results and Action Group Non-pregnant adolescent and adult women Pregnant women and lactating women up Action to 6 months postpartum Haemoglobin Severe anaemia concentration <7. 0 g/d. L Haemoglobin concentration <7. 0 g/d. L Provide 120 mg iron + 400 µg folic acid daily 3 months Haemoglobin Mild/moderate concentration anaemia 7. 0– 11. 9 g/d. L Haemoglobin concentration 7. 0– 10. 9 g/d. L Provide 60 mg iron + 400 µg folic acid 6 months ≥ 11. 0 g/d. L Counsel on consumption of iron-rich foods Normal haemoglobin levels ≥ 12. 0– 15. 1 g/d. L 2. 17
Classifying Nutritional Status • Severe underweight with medical complications • Severe underweight without medical complications • Moderate underweight • Normal • Overweight • Obese 2. 18
Module 3: Nutrition Counselling and Education Time: 18 hours 3. 1 43
Learning Objectives (1) • Explain the meaning of ‘counselling’ and what makes it effective. • Describe the multiple influences on nutrition related behaviours. • Adopt a client-centred approach to counselling that helps clients take action with available resources to overcome barriers and manage their own health. 3. 2
Learning Objectives (2) • Demonstrate communication techniques needed for effective counselling. • Use the NCST counselling flipchart to engage clients in learning and changing behaviours to achieve nutrition goals. • Help clients overcome nutrition-related challenges, maintain a healthy weight, and manage symptoms through diet. • Prepare and deliver an engaging nutrition education session. 3. 3
How Well Are We Doing with Regards to Counselling and Education? • What is happening well in nutrition counseling? • What weaknesses do you see? • How do you rate the quality of nutrition education? • What do you think should be improved? 3. 4
What Is COMMUNICATION? The meaningful exchange of information between two or more participants, by way of speech, gestures, writings, behavior, etc. 3. 5
What Does This Mean? • The free-ion spectra emerge from a controlled spark in a rare-gas atmosphere at reduced pressure, with the spectrum of gadolinium as the circuit parameters are changed. The 3 -A spectrum, where low-excitation lines of the doubly ionized fluorescence appear, manifests the spectra of unidirectional pulsed discharges. • Cold green ideas sleep fast behind the store. 3. 6
Breast milk is best! Will you give your baby the benefits from breastfeeding? 3. 7
Telling Is Not Enough! We remember: • 20% of what we hear • 40% of what we see • 80% of what we do 3. 8
Telling Is Not Enough Because: What I hear, I forget. What I see, I remember. What I do, I understand. Confucius 3. 9
Communication Education Counselling Advice Information Sometimes ‘counselling’ is here? 3. 10
What Is Counselling? Counselling is an interactive, collaborative process between a client and a trained counsellor through which the client is supported to plan appropriate actions. Counselling: ü Is not just telling people what to do ü Involves listening more than talking ü Helps clients make informed decisions to solve a problem 3. 11
Behaviour Change Is a Complicated Process Who and what influence an individual’s behaviour? Enabling environment: Laws, economy, religion Community: Services, social norms, CBOs Family, household, and peers Individual The Socio-Ecological Model of Behaviour Change 3. 12
WHO and WHAT Influence Behaviour? • Perception of the problem and its severity • Perceived costs, benefits (expected consequences) of change • Access to resources • Health status • Family and peer pressure • Social norms, including gender roles • Culture, the media, and social status • Personal habits and preferences • Beliefs, opinions, and values • Knowledge and skills 3. 13
Stages of Change and Your Role Provide continuing support Praise/discuss benefits Negotiate an agreement Encourage Provide information Tells others about it Continues to do it Tries it out Intends to try it Knows about it Doesn’t know about it 3. 14
Barriers to Behaviour Change • Habits: People do what is familiar and comfortable • Attitudes: Values, likes, dislikes • Feelings: Dependence/fear, etc. • Social pressure, norms • Economic costs, convenience • Cultural ideologies • Knowledge 3. 15
Counselling Should Be: • Client-centred • Action-oriented • Context-sensitive 3. 16
The ‘HOW’ of Nutrition Counselling 3. 17
The ‘WHAT’ of Nutrition Counselling 60
Always Address the Client’s Core Needs 3. 19
Always Address the Client’s Core Needs: Adequate Diet 3. 20
3. 21
3. 22
3. 23
Body Mass Index (BMI) Wheel • Key tool for assessment and classification • Gateway for counselling and education • Your first ‘visual aid’ 3. 25
How to Conduct Effective Counselling 3. 28
Always Address the Client’s Core Needs: Water, Sanitation, and Hygiene (WASH) 3. 29
3. 30
Why WASH? 73 3. 31
Always Address the Client’s Core Needs: Regular Clinic Visits 3. 32
3. 33
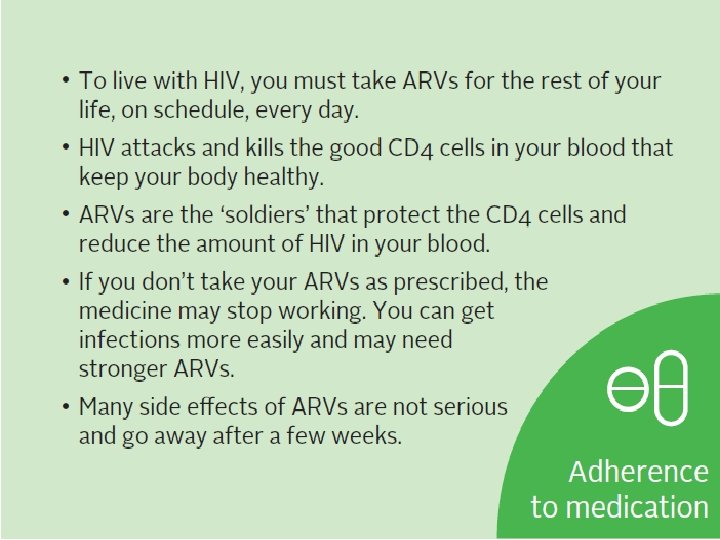
Always Address the Client’s Core Needs: Adherence to Medication 3. 34
Using the New NCST Flipchart • Helps clients learn and apply messages through active, visual engagement • The flipchart is visually appealing and is used to stimulate conversation • Use the pictures and questions to get the client(s) talking • Follow ‘ORPA’ or ‘Think-Feel -Do’ 3. 36
Discuss, Recommend, and Verify the Client’s Understanding • Present a few options for addressing the priority problem and explain the benefits. • Ask about barriers and enabling factors. • Engage client in choosing the best action step given their situation; make sure it’s something s/he feels confident to do. • Verify client’s understanding of the key information (benefits) and the action plan by having him/her explain in own words. 3. 37
Practice: Role Play―Discuss, Recommend, and Verify Understanding REMEMBER: When using the flipchart, engage client with ‘ORPA’. 1. Show the client pictures relevant to the client’s situation. 2. Ask the client to describe what is happening the pictures. 3. Ask the client about common practices in his/her home/community concerning topics pictured. 4. Ask if the client could adopt practices shown in the pictures and have him/her explain how they would do it or why they cannot do it. 5. Discuss a plan for an action step that the client could do, referring to the pictures. 3. 38
Patient Action Plan Goal: ‘I want to have more energy, feel stronger’. Action Plan: This week, I will walk (what) to the end of the road and back (how much) before lunch (when) three times (how many). This week I will: _________________________ (what) _________________________ (when) _________________________ (how much/many) This is how sure I am that I will be able to do this: 1 2 3 4 5 Not Sure Very Sure 3. 39
Nutrition Education with Groups In Advance • Select a clear objective and relevant topic. • Practice to ensure that you are fully conversant in the topic. During the Session • Use simple language. • Use various teaching techniques during the session, e. g. , photographs, flipcharts, real examples, demonstrations, dramas, or songs. • Allow adequate time for clients to ask questions. • Listen carefully and engage clients to find solutions to questions and issues raised. • Present practical solutions for the local context. • Keep the session short, no more than 15 minutes. 3. 40
Use ALIDRAA to Conduct Group Education 3. 41
Tips to Engage Groups in Active Education • Start by asking audience questions about the topic you’re introducing, e. g. , : – What is the best kind of diet to eat? – How does eating a varied diet help your body? – What happens if we eat only papa? • Use pictures to tell a story, e. g. , : – ‘This is Gloria. She is having trouble with her medication and doesn’t know what to do. What advice would you give her’? • How do you manage challenges that can emerge in group discussion? 3. 42
What Is High-Quality Service Delivery? Making sure we are doing the right things at the right time for every client every time. How does this apply to nutrition counselling? 3. 43
Quality Assurance vs. Quality Improvement Quality Assurance (QA) • Ensures that health services are meeting the required standards Quality Improvement (QI) • The combined and continuous efforts of everyone involved in health care delivery to make the changes that will lead to better patient outcomes, system performance, and professional development 3. 44
Quality Assurance vs. Quality Improvement 3. 45
Quality Improvement Methodology Adapted from T. Nolan et al. 1996. The Improvement Guide: A Practical Guide to Enhancing Organizational Performance 3. 46
Quality Improvement Methodology STEP 1. Identify the problem • Recognize a weakness in service quality or an opportunity to improve it. • Map out the process to improve. • Select the team that will solve the problem. • Have the team reach consensus on the problem. 3. 47
Identify Problems/Areas for Improvement Sources for identifying problems/areas for improvement: • Patient complaints • Routine patient treatment data, programme monitoring indicators, direct observation • Problem identification index After identifying problems, prioritize the most critical ones. 3. 48
Developing an Aim Statement An aim statement guides teams to define their focus areas and what they want to achieve over a specific period. A good aim statement must be SMART: • Specific–It should describe clearly and precisely who will benefit and what will be achieved. • Measurable–It should be possible to use data to determine whether the aim has been achieved, and there should be a starting point and target result to specify the scope of the goal. • It should have specific numerical goals for outcomes that are ambitious but achievable. • It should be relevant and easy to understand by others. • It should include a timeframe showing how much improvement will be achieved and by when. 3. 49
Examples of Aim Statements • We will improve the delivery of nutrition services for HIV clients. • At Phimbi Health Centre, we will assess and categorize every client who visits the ART, PMTCT, and TB clinics using MUAC or BMI within 3 months. • At Nyungwe Health Centre, we will reduce the default rate from 12% to 0% between January 2014 and June 2014 by following up patients who miss appointments. 3. 50
Quality Improvement Methodology Adapted from T. Nolan et al. 1996. The Improvement Guide: A Practical Guide to Enhancing Organizational Performance 3. 51
Quality Improvement Methodology STEP 2. Analyse the problem • Map the process(es) that are causing the problem. • Conduct cause-and-effect analysis. • Determine the indicators that will show whether the intended improvement is achieved. • Analyse available data. • Collect additional data (as needed). 3. 52
Process Mapping: Flow Chart Process mapping can be useful for improving services by: • Making the steps in the process clear and understandable • Helping explain the purpose of the steps • Reducing complexity • Eliminating unnecessary steps and reducing waste • Avoiding creating extra work and the need to redo work • Helping teams understand how their work relates to the tasks of others 3. 53
Cause-and-Effect Analysis • Is conducted to understand possible cause of the problem • Is done by asking ‘ 5 whys’ or by drawing a fishbone diagram 3. 54
Fishbone Diagram Effect Categories for problem causes: Staff/providers, resources/equipment, processes/procedures/methods, patients, guidelines/policies/protocols 3. 55
The QI Model Adapted from T. Nolan et al. 1996. The Improvement Guide: A Practical Guide to Enhancing Organizational Performance 3. 56
Quality Improvement Methodology Step 3: Developing Changes • Develop possible changes (interventions) that may yield improvement. • Organize possible changes according to importance and practicality and select one to implement. • Discuss how the change will be implemented. • Explain what improvement is expected from the change. 3. 57
Measuring Improvement Measurement indicators: • Should be linked to the intended change • Help determine if the change led to improvement • Should be integrated into the health facility team’s daily routine 3. 58
Qualities of a Good Indicator A good indicator: • Is clear and unambiguous (teams should not be confused by what the indicator means) • Is quantifiable • Specifies the source of the data and the person responsible for collecting the data • Should be expressed as a proportion or percentage (must have a clear numerator and denominator) • Specifies the frequency with which the data should be collected 3. 59
Testing and Implementing Changes Adapted from T. Nolan et al. 1996. The Improvement Guide: A Practical Guide to Enhancing Organizational Performance 3. 60
Module 4: Nutrition Care Plans and Support Time: 12 hours 4. 1
Learning Objectives • Understand how to choose an appropriate nutrition care plan and support for a client based on his/her nutritional status • Describe therapeutic and supplementary food products available for adolescents and adults in Malawi and how to manage the supplies • Understand the process of referring clients from the facility to community ES/L/FS services 4. 2
Importance of Nutrition Assessment • Identifies people at risk for malnutrition for early intervention or referral • Identifies malnourished clients who require intervention • Detects diet habits that increase the risk of disease • Identifies needs for nutrition education and counselling • Tracks growth and weight trends • Provides information for selecting a nutrition care plan 4. 3
Types of Nutrition Assessment 1. Anthropometry • Weight, height, mid-upper arm circumference (MUAC), BMI, and BMI-for-age 2. Biochemical • Laboratory tests 3. Clinical • Medical conditions that can affect nutritional status • Bilateral pitting oedema • Appetite test 4. Dietary • 24 -hour recall • Usual intake 4. 4
Criteria for Normal Nutritional Status Adolescents 15– 18 years (non-pregnant and non-postpartum): BMI-for-age: ≥ − 2 to +1 OR MUAC: 15– 18 years: ≥ 220 mm (22. 0 cm) Adults ≥ 19 years (non-pregnant/non-post-partum): BMI: 18. 5 to 24. 9 OR MUAC: ≥ 220 mm (22. 0 cm) Pregnant women and lactating women up to 6 months post-partum: MUAC: 220 to 299 mm (22. 0 to 29. 9 cm) 4. 5
Criteria for Overweight and Obesity Adolescents 15– 18 years (non-pregnant and non-postpartum): BMI-for-age: Overweight: ≥ +1 to < +2 Obese: ≥ +2 Adults ≥ 19 years (non-pregnant and non-post-partum): BMI: Overweight: 25. 0 to 29. 9 Obese: ≥ 30. 0 Pregnant women and lactating women up to 6 months post-partum: MUAC: Overweight/Obese: ≥ 300 mm (30. 0 cm) 4. 6
Criteria for Moderate Undernutrition Adolescents 15– 18 years (non-pregnant and non-post-partum): BMI for-age: ≥ − 3 to < − 2 OR MUAC: 185 mm to 219 mm (18. 5 cm to 21. 9 cm) OR Unintentional weight loss of 5%– 10% Adults ≥ 19 years (non-pregnant and non-post-partum): BMI: 16. 0 to 18. 4 OR MUAC: 190 mm to 219 mm (19. 0 cm to 21. 9 cm) Unintentional weight loss of 5%– 10% Pregnant women and lactating women up to 6 months postpartum: MUAC: 190 mm to 219 mm (19. 0 to 21. 9 cm) OR Weight gain: Less than 1 kg per month since the last visit 4. 8
Criteria for Severe Undernutrition without Medical Complications Adolescents 15– 18 years (non-pregnant and non-post-partum): BMI-for-age: < − 3 OR MUAC: < 185 mm (18. 5 cm) OR Unintentional weight loss of more than 10% OR Presence of bilateral pitting oedema + or ++ AND Passed appetite test Adults ≥ 19 years (non-pregnant/non-post-partum): BMI: < 16. 0 OR MUAC: < 190 mm (19. 0 cm) OR Unintentional weight loss of more than 10% Presence of bilateral pitting oedema + or ++ AND Passed appetite test Pregnant women and lactating women up to 6 months post-partum: MUAC: < 190 mm (19. 0 cm) OR Any weight loss
Criteria for Severe Undernutrition with Medical Complications Adolescents 15– 18 years (non-pregnant and non-post-partum): BMI-for-age: < − 3 OR MUAC: < 185 mm (18. 5 cm) OR Unintentional weight loss of more than 10% OR Presence of bilateral pitting oedema + or ++ AND Passed appetite test Adults ≥ 19 years (non-pregnant/non-post-partum): BMI: < 16. 0 OR MUAC: < 190 mm (19. 0 cm) OR Unintentional weight loss of more than 10% Presence of bilateral pitting oedema + or ++ AND Passed appetite test Pregnant women and lactating women up to 6 months post-partum: MUAC: < 190 mm (19. 0 cm) OR Any weight loss
Therapeutic and Supplementary Food Products Used for NCST in Malawi Therapeutic Foods • F-75 • F-100 • RUTF Supplementary Foods • Fortified corn-soya blend (CSB+), also known as likuni phala • Vegetable oil • Vitameal • Nutritionally adequate (quality and quantity) home foods 4. 11
Therapeutic and Supplementary Food Products Used for NCST in Malawi Therapeutic Foods • F-75 and F-100 therapeutic milks are for treatment of severe undernutrition with medical complications • RUTF and CSB+ are for treatment of severe undernutrition without medical complications Supplementary Food • CSB+ and vegetable oil for treatment of moderate undernutrition 4. 12
How NCST Differs from Other Food Supplementation • Food aid (e. g. , from the World Food Programme) aims to increase food security by giving families household food rations, largely staple foods. • NCST prescribes food to supplement the diets of PLHIV and/or TB clients with clinical malnutrition identified through routine anthropometric assessment or health status. 4. 13
Module 5: NCST Monitoring and Reporting Time: 8 hours 5. 1 116
Module 5: Learning Objectives 1. Understand how to use NCST data collection tools 2. Report on NCST service delivery 3. Understand the definition of NCST indicators 4. Enter NCST data in the District Health Information System–Version 2 (DHIS-2) software 5. Understand the principles and processes of NCST data analysis 6. Understand how to conduct routine data quality assessments (RDQA) 5. 2
Importance of Monitoring and Reporting of NCST Services 1. Assess the effectiveness and outcome of nutrition care, support, and treatment interventions 2. Inform and improve the design of service delivery 3. Provide timely results to district and national authorities and partners 4. Identify successful approaches 5. Advocate for support, resource allocation, and expansion of activities 6. Monitor availability and use of therapeutic and supplementary food supplies 5. 3
NCST Data Collection and Reporting Tools 1. Nutrition Care Support and Treatment (NCST) for Adolescent and Adult Register 2. NCST Undernourished Client Management Forms 3. Stock Cards 4. NCST Monthly Report Form 5. 4
NCST Monthly Report Data Error Check Data check Answer Total classified (normal + Moderate + Severe Zero + overweight/obese) – Total who received nutrition assessment at contact point Total who received health services – Total who received nutrition assessment at contact point Greater or equal to zero New admissions of severely undernourished Zero – Those classified as severely undernourished 5. 5
NCST Data Flow from Facility to National Level MOH Central Monitoring and Evaluation Division (CMED) • Data in DHS-2 • CMED provides feedback to the Zonal Health Office and central hospitals Data aggregated at the Central Hospital ANC/PMTCT ART, Pre-ART TB Zonal Health Office • Zonal Health Office provides feedback to the district nutritionists and HMIS officers OPD District Health Office • Reports received and reviewed by District nutritionist or nutrition coordinator • District nutritionist/nutrition coordinator provides feedback to facilities Facility Level • Data aggregated by a focal person at the health facility level • NCST facility focal person provides feedback to NCST service delivery points ANC/ PMTCT clinic ART, Pre-ART clinic TB clinic OPD 5. 6
NCST Indicators 1. 2. 3. 4. Nutrition Assessment: The number and proportion of adolescent and adult clients who were nutritionally assessed using anthropometric measurements (e. g. , BMI or MUAC) during the reporting period Nutrition Counselling: The number and proportion of clients who were nutritionally assessed with anthropometric measurement and also received nutrition counselling at any point during the reporting period Provision of Therapeutic Food Support: The number and proportion of severely undernourished adolescent and adult clients who received therapeutic food at any point during the reporting period Provision of Supplementary Food Support: The number and proportion of moderately undernourished adolescent and adult clients who received supplementary food at any point during the reporting period 5. 7
Challenges of Data Collection 1. Clients may find questions intrusive. 2. Collecting data takes time and increases workload. 3. Weak data collection generates inaccurate information, which is useless for decision making. 4. Facilities may not receive feedback on data they submit to higher levels. 5. Clients may be double-counted if they are registered in different areas. 5. 8
Addressing Data Collection Challenges 1. Become familiar with filling out forms by doing it regularly. 2. Collect and record data as accurately as possible. 3. Ensure that you use the standard MOH report to record report. 4. Record client identification numbers on all forms. 5. Identify changes you can make to retain clients in treatment; this will ensure that missing information is captured. 6. Conduct routine data quality assessments (RDQA). 5. 9
NCST Data Reporting Using DHIS-2 • Monthly report should be entered in DHIS-2 • The district nutritionist should check for inconsistencies before entry. Why use DHIS-2? • It is easy to analyse NCST performance trends. • It helps with tracking indicators and determining need for therapeutic and supplementary food supplies. 5. 10
Data Analysis • Refers to the process of transforming or modeling data with the goal of using the data for planning and decision making at the facility, district, or national level. • Data analysis results should be disseminated to the various levels such as communities, service providers, and managers to provide feedback on progress and outcomes. 5. 11
Clearly defined Elements of a Run Chart (Time Series Chart) title that includes Results of assessment and categorization at Kalembo H/C, Jan 13 -Mar 14 what is being measured, X and Y axes where, and when 100% % of clients have clear 90% scale and include 80% indicator label 70% Reallocated ART counsellor to PMTCT and assigned TB officer to assess clients 60% HSAs at TB and maids at PMTCT not always available 50% 40% 30% Tested changes are annotated 20% 10% 0% 14 - 14 Jan Feb Mar # seen 606 641 448 390 627 935 1217 1309 1145 1572 1047 1121 1203 1134 900 # assessed 4 0 208 177 525 758 951 1309 1145 1572 1047 1121 1203 1134 900 % assessed 1% 0% 46% 45% 84% 81% 78% 100%100%100%100% Jan Feb Mar Apr May Jun Numerator defined, including data source (e. g. , NCST register) Jul Aug Sep Oct Nov Dec Denominator defined, including data source (e. g. , NCST register) Numerator and denominator values shown for each month
Using Bar Graphs to Present Data • Can be used to present the proportion assessed and classified as: o Severe o Moderate o Normal o Overweight and obese 97. 4 100. 0 90. 8 89. 1 90. 0 83. 7 83. 1 81. 6 80. 8 78. 7 80. 0 70. 0 60. 0 50. 0 40. 0 30. 0 20. 0 10. 1 10. 0 2. 0 Jul-16 6. 2 7. 9 1. 4 Aug-16 4. 7 6. 5 6. 3 6. 5 6. 0 11. 9 10. 3 1. 4 0. 9 1. 8 Sep-16 Oct-16 Nov-16 4. 7 1. 3 Dec-16 5. 5 8. 9 8. 5 11. 0 11. 3 1. 4 1. 9 Jan-17 Feb-17 % Clients assessed with normal nutritional status % Clients assessed with moderate undernutrition % Clients assessed with severe undernutrition % Clients assessed with overweight and obesity 5. 13
Data Quality • Data quality means that the information collected as part of the NCST monitoring and reporting system adequately represents NCST’s activities. 5. 14
Components of Routine Data Quality Assessment (RDQA) • Part 1—Information systems assessment: Involves quantitative and qualitative assessment of the relative strengths and weaknesses of processes and systems that generate and manage NCST data • Part 2—Data verification: Involves a quantitative comparison of recounted data from source documents to reported data and a review of the completeness and availability of reports • Part 3—Plan of action development: Involves developing a joint plan of action to strengthen the processes and systems that generate and manage data to improve data quality 5. 15
Module 6: Managing the Quality of NCST Services Time: 16 hours 6. 1
Module 6: Learning Objectives 1. Give examples of quality assurance and quality improvement activities. 2. Implement a systematic process to improve the quality of NCST services at a health care facility. 3. Formulate an action plan for improving the quality of NCST in routine health care delivery. 4. Monitor quality improvement activities. 6. 1
Quality Health Services Are: • Safe • Effective • Patient-centred • Equitable • Efficient 6. 2
What Is High-Quality Service Delivery? Making sure we are doing the right things at the right time for every client every time. 6. 3
Quality Assurance vs. Quality Improvement Quality Assurance (QA) • Ensures that health services are meeting the required standards Quality Improvement (QI) • The combined and continuous efforts of everyone involved in health care delivery to make changes that will lead to better patient outcomes, system performance, and professional development 6. 4
Principles of Quality Improvement 1. Client focus 2. Focus on processes 3. Experimentation and use of data 4. Teamwork 6. 5
Health Delivery System Inputs/Resources • People • Equipment • Supplies • Infrastructure • Information • Technology • Money Processes • What is done? • How it is done? Outcomes • Health services delivered • Change in health behaviour • Change in health status • Client satisfaction 6. 6
Experimentation and Use of Data • Solutions are tested to determine whether they produce the required improvement. • Data are used to analyze processes, identify problems, and to determine whether the changes have resulted in improvement. 6. 7
The Model for Improvement Adapted from T. Nolan et al. 1996. The Improvement Guide: A Practical Guide to Enhancing Organizational Performance 6. 8
Quality Improvement Methodology Adapted from T. Nolan et al. 1996. The Improvement Guide: A Practical Guide to Enhancing Organizational Performance 6. 9
Quality Improvement Methodology STEP 1. Identify the problem • Recognize a weakness in service quality or an opportunity to improve it. • Map out the process to improve. • Select the team that will solve the problem. • Have the team reach consensus on the problem. 6. 10
Identify Problems/Areas for Improvement Sources for identifying problems/areas for improvement: • Patient complaints • Routine patient treatment data, programme monitoring indicators, direct observation • Problem identification index After identifying problems, prioritize the most critical ones. 6. 11
Form a Team Patient Arrives Registration Patient arrives Registration Patient Receptionist Take Temperature Doctor’s Exam Collect Tests Take temperature Doctor’s Exam Collect Tests Nurse Physician Lab technician Specialist’s Exam Patient Leaves Specialist’s Exam Patient leaves Specialist Patient Who would be on your team? 6. 12
Creating Effective QI Teams • Keep the team at a reasonable size (7– 9 members). • Choose motivated team members who want to contribute. • Include people who have influence over their colleagues or communities. • Select people with various levels of seniority. 6. 13
Developing an Aim Statement An aim statement guides teams to define their focus areas and what they want to achieve over a specific period. A good aim statement must be SMART: • Specific–It should describe clearly and precisely who will benefit and what will be achieved. • Measurable–It should be possible to use data to determine whether the aim has been achieved, and there should be a starting point and target result to specify the scope of the goal. • It should have specific numerical goals for outcomes that are ambitious but achievable. • It should be relevant and easy to understand by others. • It should include a timeframe showing how much improvement will be achieved and by when. 6. 14
Examples of Aim Statements • We will improve the delivery of nutrition services for HIV clients. • At Phimbi Health Centre, we will assess and categorize every client who visits the ART, PMTCT, and TB clinics using MUAC or BMI within 3 months. • At Nyungwe Health Centre, we will reduce the default rate from 12% to 0% between January 2014 and June 2014 by following up patients who miss appointments. 6. 15
Quality Improvement Methodology Adapted from T. Nolan et al. 1996. The Improvement Guide: A Practical Guide to Enhancing Organizational Performance 6. 16
Quality Improvement Methodology STEP 2. Analyse the problem • Map the process(es) that are causing the problem. • Conduct cause-and-effect analysis. • Determine the indicators that will show whether the intended improvement is achieved. • Analyse available data. • Collect additional data (as needed). 6. 17
Process Mapping: Flow Chart Process mapping can be useful for improving services by: • Making the steps in the process clear and understandable • Helping explain the purpose of the steps • Reducing complexity • Eliminating unnecessary steps and reducing waste • Avoiding creating extra work and the need to redo work • Helping teams understand how their work relates to the tasks of others 6. 18
Creating and Using a Flow Chart to Understand a System/Process 1. Decide on the beginning and end points of the process being mapped. 2. Identify the steps of the process. 3. Link the steps with arrows showing direction. 4. Review the flow chart to see whether the steps are in their logical order. 6. 19
Creating a Process Flow Chart: Symbols Beginning or end Step Flow lines Unclear step Decision 6. 20
Creating a Process Flow Chart: Flow Lines One flow line Step out of a step Two flow lines out of a Decision YES decision Must ask a yes/no question NO 6. 21
Cause-and-Effect Analysis • Is conducted to understand possible cause of the problem • Is done by asking ‘ 5 whys’ or by drawing a fishbone diagram 6. 22
Fishbone Diagram Effect Categories for problem causes: Staff/providers, resources/equipment, processes/procedures/methods, patients, guidelines/policies/protocols 6. 23
Example of a Fishbone Diagram Staff Data collection Poor documentation Staff lack skills to assess nutritional status Bad attitude of health workers Lack of registers to record assessments Assessing few patients on nutrition Lack of guidelines, standards, and job aids Equipment Lack of anthropometry equipment Patients arriving late to receive services Patients sending guardians to collect drugs on their behalf Patient 6. 24
The QI Model Adapted from T. Nolan et al. 1996. The Improvement Guide: A Practical Guide to Enhancing Organizational Performance 6. 25
Quality Improvement Methodology Step 3: Developing Changes • Develop possible changes (interventions) that may yield improvement. • Organise possible changes according to importance and practicality and select one to implement. • Discuss how the change will be implemented. • Explain what improvement is expected from the change. 6. 26
Measuring Improvement Measurement indicators: • Should be linked to the intended change • Help determine if the change led to improvement • Should be integrated into the health facility team’s daily routine 6. 27
Types of Indicators Patient arrives Input Indicators # of staff trained in nutrition assessments 159 Patient moves through system Short-term result Process Indicators Output Indicators Outcome Indicators Proportion of patients who received nutrition assessment Reduction in mortality due to malnutrition % compliance with assessment guidelines Long-term result 6. 28
Qualities of a Good Indicator A good indicator: • Is clear and unambiguous (teams should not be confused by what the indicator means) • Is quantifiable • Specifies the source of the data and the person responsible for collecting the data • Should be expressed as a proportion or percentage (must have a clear numerator and denominator) • Specifies the frequency with which the data should be collected 6. 29
Example of an Indicator: Proportion of ART, TB, ANC/PMTCT clients assessed and classified Numerator: Number of ART, TB, ANC/PMTCT clients assessed and classified Denominator: Total number of clients who attended the clinic (ART, TB, ANC/PMTCT) Source: NCST registers for adolescents and adults (ART, TB, ANC/PMTCT client registers) Person responsible: Data clerk at ART, nutrition focal persons at TB and ART Frequency: Monthly 6. 30
Using Data are used continuously to: • Identify gaps in service • Determine whether changes led to improvement • To inform decision-making Proportion of patients assessed and categorized at Kaporo Rural Hospital, Jan 13–Mar 14 100% 80% 60% 40% 20% 0% Jan-13 Feb-13 Mar-13 Apr-13 May-13 Jun-13 Jul-13 Aug-13 Sep-13 Oct-13 Nov-13 Dec-13 Jan-14 Feb-14 Mar-14 6. 31
Clearly defined title that includes Results of assessment and categorization at Kalembo H/C, Jan 13 -Mar 14 what is being measured, X and Y axes where, and when 100% Elements of a Time Series Chart % of clients have clear 90% scale and include 80% indicator label 70% Reallocated ART counsellor to PMTCT and assigned TB officer to assess clients 60% HSAs at TB and maids at PMTCT not always available 50% 40% 30% Tested changes are annotated 20% 10% 0% 14 - 14 Jan Feb Mar # seen 606 641 448 390 627 935 1217 1309 1145 1572 1047 1121 1203 1134 900 # assessed 4 0 208 177 525 758 951 1309 1145 1572 1047 1121 1203 1134 900 % assessed 1% 0% 46% 45% 84% 81% 78% 100%100%100%100% Jan Feb Mar Apr May Jun Numerator defined, including data source (e. g. , NCST register) Jul Aug Sep Oct Nov Dec Denominator defined, including data source (e. g. , NCST register) Numerator and denominator values shown for each month
Testing and Implementing Changes Adapted from T. Nolan et al. 1996. The Improvement Guide: A Practical Guide to Enhancing Organizational Performance 6. 33
Testing Changes: Plan • How will the change be implemented? • Who will implement it? • Where will the change be implemented? • When will it be implemented? 6. 34
Testing Changes: Do Implement the plan/solution • Test BIG changes on a small scale initially and then ramp up. • Focus on learning. Negative results are an opportunity to learn, so it is ok if some changes don’t work. • Test one change at a time. • Monitor and document results. Ensure that data are complete. 6. 35
Testing Changes: Study • Review the data and create a time series chart. • Review available qualitative data that are relevant to the quantitative data. • Ask the QI team what the results reveal. 6. 36
Testing Changes: Act Analysis ABANDON No the change. Develop and test other changes. Did the change lead to an improvement? Yes MODIFY the change and conduct another test. No Is the change significant? Yes ADOPT the change. Develop new changes. 6. 37
Monitoring QI Activities • Data collection tools – NCST adolescent and adult register – NCST client management form • Reporting tools – NCST monthly report form • QI documentation journal • QI team maturity index 6. 38