Introduction What Is Poverty and Who Are the


 Per capita GDP Why")

 or Consumption Measure of Number of")


 World Bank. David Dollar,")


 Area 1000 1500 1700 1820")
 1995 2001 2007 2010 Europe")


 and Economic Freedom Quartile Most Free")


- Slides: 68
Introduction: “What Is Poverty and Who Are the Poor? ”
1 Billion People Live in “Extreme Poverty” World Bank 1, 400, 000 1, 000, 000 $1. 00/day World Bank 2010 $1. 25/day
Economic Terminology • • Income Wealth GDP (Gross Domestic Product) Per capita GDP Why do we use GDP to measure poverty?
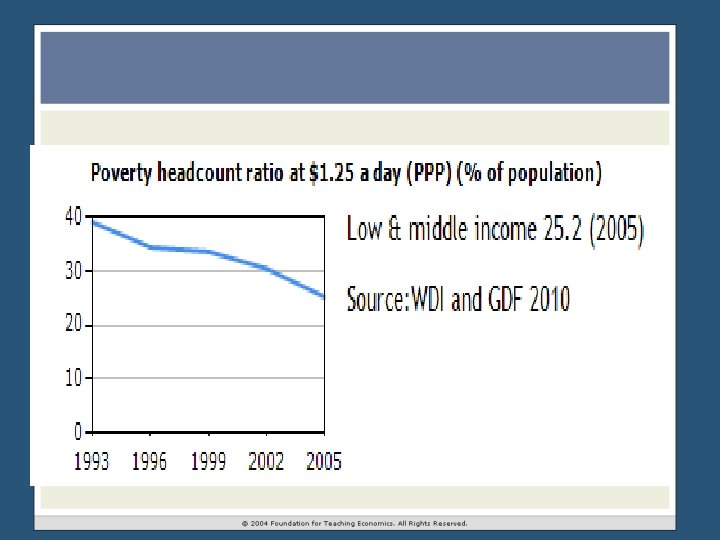
Economic Terminology • Absolute Poverty – measured against a designated minimum threshold of material well-being. The incomes of the poor fall below the minimum threshold. – Current standard = $1/day PPP • Relative Poverty - identified by comparing levels of material well-being experienced by different individuals or groups, rather than by comparing the level of well-being to a standard.
Poverty Can Be Measured by Either Output (GDP) or Consumption Measure of Number of Poor by World Regions 20005 2008 332 million 284 million 6 million 2 million Latin America and the Caribbean 48 million 37 million Middle East and North Africa 11 million 9 million South Asia 598 million 571 million Sub-Saharan Africa 395 million 386 million Total 1. 39 billion 1. 289 billion East Asia and the Pacific Eastern Europe and Central Asia Reduction in number of poor, 2005 -2008: 101 million Sources: World Bank Poverty and Inequality http: //www. worldbank. org/Data/Views/Reports/Table. View. aspx (May 1, 2012
Countries of the World; Low, Middle and High Income
The number of extreme poor has declined by 500 million since 1981
Share of World Population in Poverty, 1820 – 1998 ($1/day) World Bank. David Dollar, Development Research Group, World Bank. “Capitalism, Globalization and Poverty. ” unpublished paper, written for The Foundation for Teaching Economics, March, 2003, p. 27
Number of People Living on Less Than $1 Per Day, 1820 - 1998 1980 World Bank. David Dollar, Development Research Group, World Bank. “Capitalism, Globalization and Poverty. ” unpublished paper, written for The Foundation for Teaching Economics, March, 2003, p. 27
World Bank 2009
• . . VideosReal. Player DownloadsHans Rosling's 200 Countries, 200 Years, 4 Minutes - The Joy of Stats - BBC Four. flv
Height Is a Proxy for Economic Well-Being
~1750
Years of Life Expectancy at Birth Select Years 1950 -55 1975 -80 2005 -10 ~30 (1800) 66 74 81 ~36 (1799 -1803) 69 73 79 India 25 (1901 -11) 39 53 64 China 25 -35 (1929 -31) 41 65 73 38 48 51 46 60 67 Place Middle Ages France UK 20 -30 Africa World 20 -30 Sources: Lee and Feng (1999); Peterson (1995); Wrigley and Schofield (1981, 529); World Resources Institute (2011); UNDP (2002) http: //hdr. undp. org/statistics/data/indic_1_1_1. html
Real Gross Domestic Product Per Capita (1990$ International PPP) Area 1000 1500 1700 1820 1952 Europe $400 ~$640 870 1, 130 4, 370 USA 600 1, 260 10, 650 23, 380 27, 948 India 530 610 1, 570 1, 957 540 3, 200 3, 583 1, 220 1, 489 5, 190 6, 049 China 450 600 600 Africa 400 400 World 420 550 600 670 2, 270 Sources: Maddison (1998, 1999) Development Centre Studies The World Economy: Historical Statistics, Maddison, 2003. 1995 2001 13, 950 19, 256
Real Gross Domestic Product Per Capita (2005$ International PPP) 1995 2001 2007 2010 Europe $24, 674 28, 364 30, 789 29, 765 USA 33, 903 39, 602 41, 260 40, 650 India 1, 452 1, 832 2, 685 3, 240 China 1, 849 2, 868 5, 239 6, 810 Africa 1, 498 1, 589 1, 914 2, 022 World 7, 037 7, 955 9, 535 9, 869 Sources: Maddison (1998, 1999) Development Centre Studies The World Economy: Historical Statistics, Maddison, 2003.
The Good News and The Bad News Number of People Living on Less than $1. 25/day (millions) 1981 1990 1999 2005 2008 East Asia & Pacific 1, 096 926 656 332 284 Sub-Saharan Africa 205 290 376 395 386 Source: World Bank Poverty and Inequality Database http: //databank. worldbank. org/Data/Views/Reports/Table. View. aspx (April 30, 2012)
David Dollar, Development Research Group, World Bank. “Capitalism, Globalization and Poverty. ” unpublished paper, written for The Foundation for Teaching Economics, March, 2003, p. 24.
What does Capitalism have to do with Poverty?
Measurement: Fraser Institute Economic Freedom: • • • Size of government and taxation Protection of private property and the rule of law Soundness of money Trade regulation and tariffs Regulation of business, labor and capital markets 21
Background: Economic Freedom Project • 25 year project u Transparency is a highly valued part of the project • Based entirely on third party data from World Bank, International Monetary Fund (IMF), Global Competitiveness Report, etc. (based on both objective and survey data) u We rank 141 countries representing 95% of the world’s population according to the extent to which they permit their citizens to be economically free 22
Per Capita Income and Economic Freedom Quartile Most Free ……………. Least Free Sources: The Fraser Institute; The World Bank, World Development Indicators, 2011
Overall Economic Freedom Index: Top Ten Source: The Fraser Institute 2011.
Overall Economic Freedom Index: Bottom Ten Source: The Fraser Institute 2011.
Per Capita Income and Economic Freedom Quartile Most Free ……………. Least Free Sources: The Fraser Institute; The World Bank, World Development Indicators, 2011
Income Share of the Poorest 10% and Economic Freedom Most Free ……………. . Least Free Sources: The Fraser Institute; The World Bank, World Development Indicators, 2011. 27
Income of the Poorest 10% and Economic Freedom Most Free ……………. Least Free Sources: The Fraser Institute; The World Bank, World Development Indicators, 2011.
Growth in Real GDP Per Capita (developing nations) and Economic Freedom Quartile Most Free ……………. . …… Least Free Sources: The Fraser Institute; The World Bank, World Development Indicators, 2011. 29
Life Expectancy at Birth and Economic Freedom Quartiles Most Free ……………. Least Free Sources: The Fraser Institute; The World Bank, World Development Indicators, 2011. 30
Economic Freedom and Life Satisfaction Higher values indicate higher levels of satisfaction Most Free …………………. Least Free Sources: The Fraser Institute; New Economic Foundation (2009), The (un)Happy Planet Index 2. 0. Why good lives don't have to cost the Earth. 31
EFW map 32
Economic Growth improves the lives of the poor by making the pie bigger Bigger “slices” mean higher standards of living
C: UsersPublicDesktopGapminder Desktop. lnk
Proposition: A nation’s institutions determine its ability to reduce poverty. Institutions: the formal and informal “rules of the game” that shape incentives and outline expected and acceptable forms of behavior in social interaction. • • Private Property Rights Rule of law Open, competitive markets Entrepreneurship and innovation
Proposition: A nation’s institutions determine its ability to reduce poverty. Institutions: the formal and informal “rules of the game” that shape incentives and outline expected and acceptable forms of behavior in social interaction. • • Private Property Rights Rule of law Open, competitive markets Entrepreneurship and innovation
Proposition: A nation’s institutions determine its ability to reduce poverty. Institutions: the formal and informal “rules of the game” that shape incentives and outline expected and acceptable forms of behavior in social interaction. • • Private Property Rights Rule of law Open, competitive markets Entrepreneurship and innovation
Property Rights benefit the poor by making owned capital secure and productive. Lesson 2: “Property Rights and the Rule of Law”
Formal Legal Characteristics • Definable • Enforceable • Transferable
An Important Note • The term “Property Right” is shorthand for Human Rights. – The right to freely use and transfer possessions including yourself. • People, Not Property. – Recognition of people’s right of ownership to themselves and their labor.
Defined but not Enforced • A right that is defined but not enforced is useless. defending & enforcing Property Rights is paramount
Property Rights and Growth • Property Right holders have an incentive to preserve their property. • Owners consider the future. • Owners will improve a property. – The value of improvements reside with the owner.
Investment • Secure property rights make investment more likely. • Property Rights allow people to obtain debt. – Use of past and future incomes. – Collateralization is of greatest benefit to the poor.
Property Rights and the Poor • Property Rights are of the greatest benefit to the poor. – The rich can enforce rights over their property. – The poor cannot. • The definition and enforcement of Property Rights gives the poor the same right enjoyed by the rich. • Secure property rights also contribute to economic growth by enabling the poor to shift effort from protective to productive activities.
Enforcing the Rules • Rule of Force – Anarchy • Rule of Men – Laws are enforced at the good will of the enforcer. • Rule of Law – Both the governed and the governing are ruled by the same laws.
Big Picture • Rights to property promote economic growth by encouraging preservation, improvement and investment in owned resources. • In societies without clearly defined property rights the poor are disadvantaged because they lack the resources to enforce their rights.
Big Picture • To effectively stimulate economic growth property rights must exist within a society characterized by stable and predictable rules of law.
The Role of Competition Lesson 3: “Competition Opens Markets to the Poor”
To Compete or Not? The question is not whether we shall have competition, but what forms it will take. - Paul Heyne • Competition will always occur. – Scarcity • We cannot fulfill all our wants at no cost.
Non-Market Competition • What determines participation? – Connections – Wealth – Etc. • What determines production? – No effective production signals. – No effective incentives to innovate.
Market Competition – Suppliers compete with Suppliers. – Demanders compete with Demanders – All are trying to Maximize Profits • Profits draw a crowd – It is about increasing revenue and lowering costs.
Revenue and Costs • Since demand curves slope downward, for producers, there are three ways to increase profits. – Sell more at lower prices. – Lower costs – Innovate new goods that can command a premium.
Prices and Production • Prices are determined by the interaction of the Supply and Demand for a good. S Pe P 2 e D Qe Q 2 e An Increase in the Supply of a good increases quantity traded and lowers price
More Sellers More Supplied at Lower Prices
Innovation = Lower Costs = Increased Supply $$$$$ $ 1 2 3
Graphing calculator Communications $$$$$ $ 1 2 3
Construction Engineering
Opportunity • The greatest impact on the poor comes from the opportunities that competitive markets provide. – Employment – Increased output – increased labor usage. – Entrepreneurship – The poor can get in the game – not restricted to approved classes.
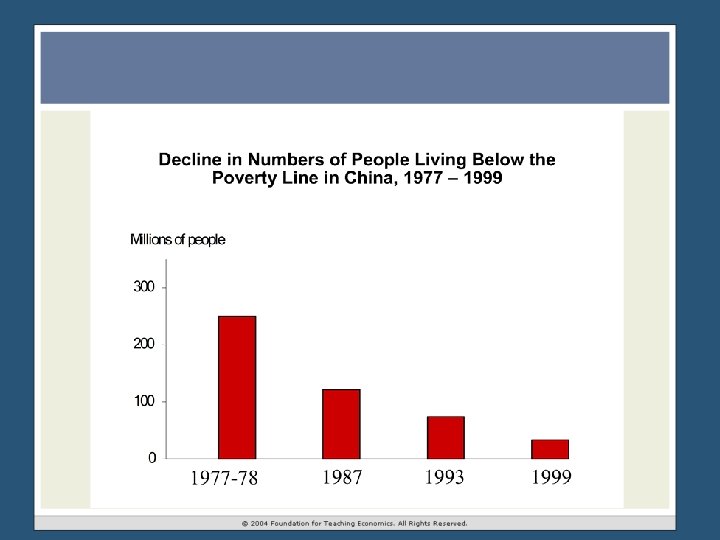
Case Study – Opening Markets in China 1977 -78 • 250 million Chinese peasants with incomes below the country’s official poverty line of approximately 70 cents (U. S. ) per day. • 600 -700 million Chinese living on less than $1 per day, the commonly used international poverty line. • Most of the population were peasants, herded together into communal farms. This system produced very poor economic results with widespread poverty and periodic famines.
Case Study – Opening Markets in China 1978 • Economic reforms begin: limited property rights and open markets • Communes were broken up and families given individual plots of land families were allowed to sell some of their output in farm markets. • The right to enter the market with their produce drastically changed the incentives facing Chinese farmers. • This institutional reform led to a dramatic surge in grain production in China and fueled spectacular poverty reduction.
The Big Picture • Competition and Markets benefit the poor by – – – Providing more goods at lower prices. Increasing the quality and variety of goods available. Providing opportunities for work. Stimulating entrepreneurial activities. Unleashing the talent and abilities that were always there.
Conclusions and Caveats Economic Growth Overcomes Poverty Markets create wealth and foster economic growth
Institutions of Capitalism Provide the Framework and Incentives for the Creation of Wealth • Property Rights • Rule of law • Competitive markets • Entrepreneurship / Innovation
Questions that Remain Unequal Income Distribution Income Mobility Individualism of Property Rights Barriers to the Institutions of Capitalism
Institutions of Capitalism The Mix Importance of the Rule of Law
Capitalism and Markets • Lock us in mutual dependence • Promote other regarding behavior • Foster a civil society where anonymous cooperation is the norm • Benefit the poor in ways that are most important to them, providing Wealth, Dignity, and Mobility