Introduction to Understanding Your Histogram By Tibor Vari

Introduction to Understanding Your Histogram By Tibor Vari President of Teaneck Camera Club 2005 -2006 & 2006 -2007, VP 2003 -2004, 2004 -2005 First VP of NJFCC 2007 -2008 Salon Worker: Slides/Digital, Nature, Color Prints By The Maker Numerous Medals, MAs & HMs in Club, NJFCC & PSA competitions Landscape Workshop Tour Guide, Judge, Youth Sports, Weddings, Proms, Home Family Portraits Winter in Yosemite Feb 20 -24, 2013 I have had a 35 mm since I was 18 (Olympus OM 1 & OM 2) 08/1993 Nikon N 6006, 05/1995 Nikon N 90, 08/1996 Nikon N 90 s, 05/2000 Nikon F 100, 02/2001 Nikon F 5, 11/2001 Canon G 2 Digital, 09/2004 Nikon D 70 Digital, 04/2005 Nikon D 2 x (100% digital with Nikon F 5 & F 100 sold 02/2006), 04/2007 Nikon D 200, 08/2008 Nikon D 700 Tibor Vari’s website is at http: //www. tiborvari. com Email: tibor@tiborvari. com

Introduction to Understanding Your Digital Camera’s Histogram By Tibor Vari

Agenda Digital/Film Basics Color by Numbers Dynamic Range So What is a Histogram? Samples Myths Summary Sources

Digital/Film Basics • A Digital Sensor is similar to film in that – You can overexpose an image (blown highlights) – You can underexpose an image (too dark) – The meter will expose for 18% gray • Dynamic range is about 5 -6 F-Stops for digital (about the same as slide film) • Digital stores color information as numbers

Color by the Numbers • • A Pixel = 3 “buckets” Red, Green, & Blue Each color bucket ranges from 0 -255 • • White 255, 255 Black 0, 0, 0 Red 255, 0, 0 Green 0, 255, 0 Blue 0, 0, 255 Magenta 255, 0, 255 Cyan 0, 255 Yellow 255, 0 Total color combinations = 256*256 = 16, 777, 216!

Dynamic Range of Light Values
 +2 stops: extremely")
Tonality +2 ½ stops: textureless white Broad expanse of snow (overcast) +2 stops: extremely light Textured snow, sand dune +1 ½ stops: light Birch bark +1 stop: light Khaki shirt + ½ stop: dark light Caucasian skin in sun Metered value: medium tone Most grass, green leaves -½ stop: light dark Caucasian skin in shadow -1 stop: dark Animals with dark hide -1 ½ stops: dark Dark Shadows with texture (pine tree bark) -2 stops: extremely dark Fur on a black cat -2 ½ stops: detailless black Night sky Sunny 16 Rule Daylight exposure = 1/ISO second at F 16 Camera meter wants to make everything 18% gray • Snow or Beach Scenes - Compensate by +1 to +2 F-Stops • Dark subjects like a black cat - Compensate by -1 to -2 F-Stops

3 Way Tug of War Shutter Speeds 1/1000 1/500 1/250 1/125 1/60 1/30 1/15 1/8 ¼ ½ 1” Freeze Action <-Silky Water-> 2” 4” 8” 15” 30” Low Light Lots of sunlight F 11 -F 22 Wide Open Apertures Slow Film (ISO 50) Fast Film (ISO 400+) Narrow Apertures F Stops F 1. 4 2. 8 4 5. 6 8 11 16 22 32 Portraits Landscapes Shallow DOF Great DOF Background blurred Everything sharp ISO (film/digital speed – generally in 1/3 to ½ stops) 50 100 200 400 800 1600 3200

So What is a Histogram? • A Digital camera histogram is a graphical representation of the brightness levels (from pure black to pure white), in an scene and the relative count of pixels within each brightness level.

40 colored tiles represented by the histogram Where the shadows, midtones and highlights fall within the histogram http: //www. dpreview. com/learn/? /key=histogram By Vincent Bockaert

Pixel sensor collects light while shutter is open http: //clarkvision. com/imagedetail/does. pixel. size. matter/ by R N Clark

Digital Histogram on a D 2 x Camera monitors are not calibrated! Thus you cannot judge exposure or colors by it! Use your histogram to determine image exposure! If you do, you will not have to look at the image using the camera monitor at all! Finally, your monitor will be difficult to see in daylight – the histogram will in fact be easier to see

Sample Image This image is well exposed though a bit flat. The black shadow and white highlights are virtually nil. Note: Taken from http: //www. sphoto. com/techinfo/histograms 2. htm by Steve Hoffman

Sample Image Mid-tone 118 R Shadow 24 R 124 G 136 B 23 G 18 B Highlights 238 R 232 G 220 B Pixel count high for sky

Sample Image R 249 G 186 B 89 R 144 G 160 B 175 R 16, G 13, B 12. 6 second at F 22, ISO 100, 24 mm

Sample Image R 67 G 60 B 54 R 2 G 2 B 2 R 255 G 213 B 171 ¼ second at F 18, ISO 100, 200 mm

Blown Shadows & Highlights #1 Workarounds: • use balanced fill flash on the foreground • use a graduated neutral density filter • take multiple exposures and merge them digitally • go home Images & text from http: //www. nikonians. org/html/resources/guides/digital/histogram_101/index. html by Digital Darrell

1, 2 & 3 Stop Neutral Density Filters Image from: http: //www. luminous-landscape. com/tutorials/understanding-grads. shtml

Blown Shadows & Highlights #2 Exposed for mountain Exposed foreground Merged in Photoshop Blown Shadows Blown Highlights Added Saturation, curves Black Pixel count White Pixel count Contrast, Adj Levels

Typical histogram examples

“Blinkies'” http: //www. dpreview. com/learn/? /key=histogram By Vincent Bockaert
 There really isn't just one proper histogram for")
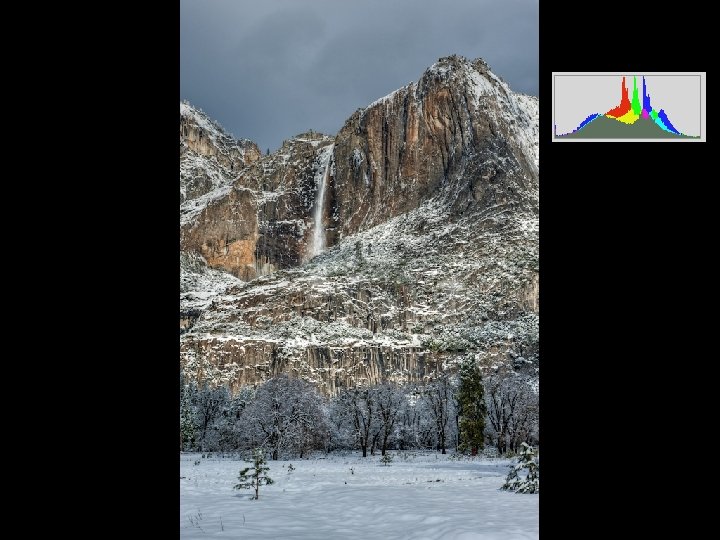
Interpreting your Histogram (High Key sample) There really isn't just one proper histogram for any given image. You can shift the tonal range (the histogram) around to lighten, darken or adjust the contrast in an image. To take advantage of the information supplied by an image's histogram you have to be able to visually interpret the image content, taking into consideration the location and approximate percentage of highlight, shadow and midtone pixels in the image itself. Because of the snow, you would expect this image to have a majority of its pixels to the right side.
 1/500 second at F 5. 6, ISO 200,")
Interpreting your Histogram (High Key sample) 1/500 second at F 5. 6, ISO 200, 105 mm There really isn't just one proper histogram for any given image. You can shift the tonal range (the histogram) around to lighten, darken or adjust the contrast in an image. To take advantage of the information supplied by an image's histogram you have to be able to visually interpret the image content, taking into consideration the location and approximate percentage of highlight, shadow and midtone pixels in the image itself. Because of the snow, you would expect this image to have a majority of its pixels to the right side.
 A majority of the pixels are to the")
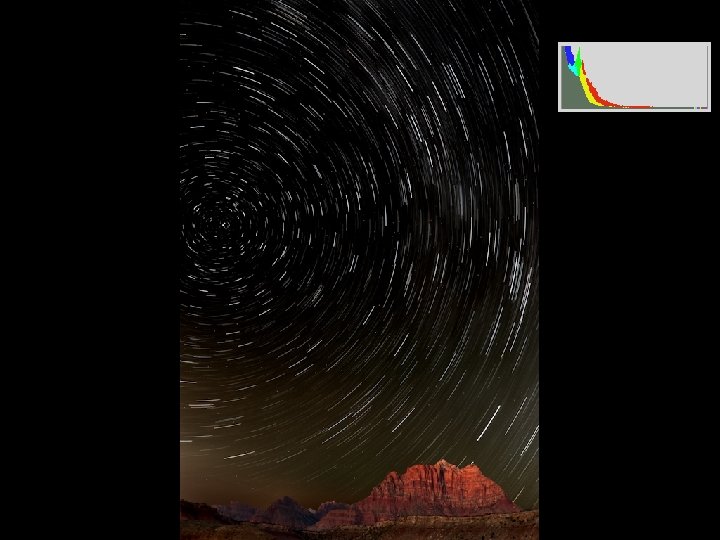
Interpreting your Histogram (Low Key Sample) A majority of the pixels are to the left of the center of the graph. ISO 800 F 16. 2 s (1/5) +. 5 comp A Mode Note: ISO 200 F 16. 8 s A Mode ISO 200 F 8. 2 s A Mode Highlights clipped, No software can recover details from clipped shadows or highlights

Tough Images Whites not clipped so detail is retained Note: Image from http: //www. naturescapes. net/092004/gd 0904. htm by Greg Downing


A Couple of Myths • A perfect histogram is a camel back! • Better to underexpose – you can always bring it back up in Photoshop!

Summary • The histogram is a powerful tool to help you properly expose your images! • Watch for blown shadows and/or highlights – if you have them, make exposure adjustments or use ND filters. Use the “blinkies” if your camera has them • Use the histogram and not your camera monitor to judge if your image is properly exposed • Instant feedback in the field if you got the shot! No waiting two weeks for the slides to return! • Interpret your histogram based on the scene. • Try keeping the histogram to the right but at the same time not clipping the whites (interpret it)

Sources Below are some websites that I used for research. Please note that I made liberal use of some of their images to use as examples in this discussion. • • • http: //porg. 4 t. com/Histogram. html http: //www. luminous-landscape. com/tutorials/understanding-series/understanding-histograms. shtml http: //www. sphoto. com/techinfo/histograms. htm http: //electronics. howstuffworks. com/digital-camera. htm http: //www. nikonians. org/html/resources/guides/digital/histogram_101/index. html http: //www. naturescapes. net/092004/gd 0904. htm Histogram 201 Concept: Expose to the right http: //www. luminous-landscape. com/tutorials/expose-right. shtml

- Slides: 33