INTRODUCTION TO UML Structural View Class Diagram Object

INTRODUCTION TO UML

Structural View - Class Diagram - Object Diagram Behavioural View - Sequence Diagram - Collaboration Diagram - State-chart Diagram - Activity Diagram User’s View -Use Case Diagram Implementation View - Component Diagram Environmental View - Deployment Diagrams and views in UML
 is a standard language for writing software blueprints.")
UML The Unified Modeling Language (UML) is a standard language for writing software blueprints. The UML may be used to visualize, specify, construct, and document the artifacts of a softwareintensive system.

UML… The UML is a language for: Visualizing Specifying Constructing Documenting

THE UML IS A LANGUAGE A language provides a vocabulary and the rules for combining words in that vocabulary for the purpose of communication. A modeling language is a language whose vocabulary and rules focus on the conceptual and physical representation of a system.

UML IS A LANGUAGE FOR DOCUMENTING Requirements Architecture Design Source code Project plans Tests Prototypes Releases

WHERE CAN THE UML BE USED? Enterprise information systems Banking and financial services Telecommunications Transportation Defense/aerospace Retail Medical electronics Scientific Distributed Web-based services

BUILDING BLOCKS OF THE UML Things Relationships Diagrams

THINGS IN THE UML Structural things Behavioral things Grouping things Annotational things

STRUCTURAL THINGS Structural things are the nouns of UML models. These are the mostly static parts of a model, representing elements that are either conceptual or physical. there are seven kinds of structural things. Conceptual or logical(Class, interface, collaboration, Use case, Active Class) Physical—(Node, Component)

CLASS A class is a description of a set of objects that share the same attributes, operations, relationships, and semantics. A class implements one or more interfaces.

INTERFACE an interface is a collection of operations that specify a service of a class or component. An interface therefore describes the externally visible behavior of that element.

COLLABORATION A collaboration defines an interaction and is a society of roles and other elements that work together to provide some cooperative behavior that's bigger than the sum of all the elements.

USE CASE A use case is a description of set of sequence of actions that a system performs that yields an observable result of value to a particular actor.

ACTIVE CLASS an active class is a class whose objects own one or more processes or threads and therefore can initiate control activity.

COMPONENT a component is a physical and replaceable part of a system that conforms to and provides the realization of a set of interfaces.

NODE a node is a physical element that exists at run time and represents a computational resource, generally having at least some memory and, often, processing capability.

BEHAVIORAL THINGS Behavioral things are the dynamic parts of UML models. These are the verbs of a model, representing behavior over time and space. 1. interaction is a behavior that comprises a set of messages exchanged among a set of objects within a particular context to accomplish a specific purpose.

BEHAVIORAL THINGS 2. a state machine is a behavior that specifies the sequences of states an object or an interaction goes through during its lifetime in response to events, together with its responses to those events.

GROUPING THINGS Grouping things are the organizational parts of UML models. A package is a general-purpose mechanism for organizing elements into groups. Structural things, behavioral things, and even other grouping things may be placed in a package.

ANNOTATIONAL THINGS Annotational things are the explanatory parts of UML models. These are the comments you may apply to describe, illuminate, and remark about any element in a model. Note

RELATIONSHIPS IN THE UML Dependency Association Generalization Realization Aggregation Composition


RELATIONSHIPS IN THE UML Association � Association is a relationship where all object have their own lifecycle and there is no owner. � Let’s take an example of Teacher and Student. � Multiple students can associate with single teacher and single student can associate with multiple teachers but there is no ownership between the objects and both have their own lifecycle. Both can create and delete independently.

Aggregation � Aggregation is a specialize form of Association where all object have their own lifecycle but there is ownership � and child object can not belongs to another parent object. Let’s take an example of Department and teacher. A single teacher can not belongs to multiple departments, but if we delete the department teacher object will not destroy. � It is a “has-a” relationship.

Compostion � It is a strong type of Aggregation. � Child object dose not have their lifecycle and if parent object deletes all child object will also be deleted. � Let’s take again an example of relationship between House and rooms. House can contain multiple rooms there is no independent life of room and any room can not belongs to two different house � if we delete the house, room will automatically delete.

RELATIONSHIPS IN THE UML Generalization

Dependency � In UML, a dependency relationship is a relationship in which one element, the client, uses or depends on another element, the supplier. � You can also use a dependency relationship to represent precedence, where one model element must precede another. Realization � In UML modeling, a realization relationship is a relationship between two model elements, in which one model element (the client) realizes the behavior that the other model element (the supplier) specifies

DIAGRAMS Class diagram � Class diagram: describes the structure of a system by showing the system's classes, their attributes, and the relationships among the classes. Data Members/attributes/properties. Member functions/operations
")
Class diagram Student s_name : String s. Rollno : Int age()
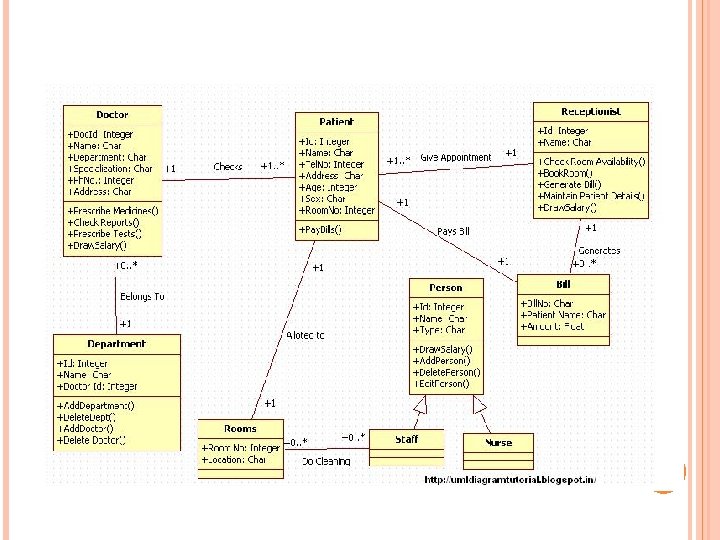

Class diagram clearly shows the mapping with object oriented languages like Java, C++ etc. So from practical experience class diagram is generally used for construction purpose.

THE FOLLOWING POINTS SHOULD BE REMEMBERED WHILE DRAWING A CLASS DIAGRAM: The name of the class diagram should be meaningful to describe the aspect of the system. Each element and their relationships should be identified in advance. Responsibility (attributes and methods) of each class should be clearly identified. For each class minimum number of properties should be specified. Because unnecessary properties will make the diagram complicated. Use notes when ever required to describe some aspect of the diagram. Because at the end of the drawing it should be understandable to the developer/coder. Finally, before making the final version, the diagram should be drawn and rework as many times as possible to make it correct.

CLASS DIAGRAMS ARE USED FOR: Describing the static view of the system. Showing the collaboration among the elements of the static view. Describing the functionalities performed by the system. Construction of software applications using object oriented languages.

Example- ATM Machine system Atm- its transactions-bank –customer-atm cards etc

SEQUENCE DIAGRAM

10 th Lecture

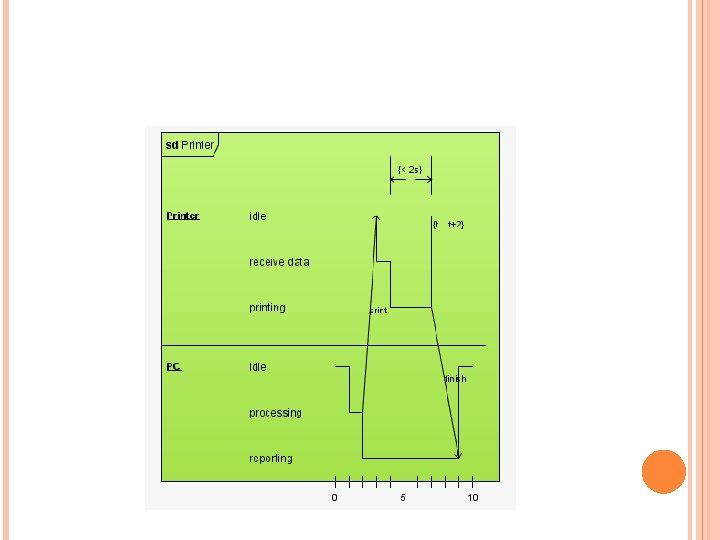
TIMING DIAGRAM Communication diagrams, sequence diagrams and timing diagrams are different views of the interaction. UML timing diagrams are used to display the change in state or value of one or more elements over time. Timing diagrams focus on the timing or duration of the message or conditions in change along a timeline in the diagram. It can also show the interaction between timed events and the time and duration constraints that govern them.

TIMING DIAGRAM Timing diagrams are used to explore the behaviors of objects throughout a given period of time. The differences between timing diagram and sequence diagram are the axes are reversed so that the time is increased from left to right and the lifelines are shown in separate compartments arranged vertically.

You create timing diagrams to represent a part of the timing of a system. You can use timing diagrams to examine and further model time constraints and duration. You can create multiple timing diagrams that each focus on a different lifeline or view of the interaction. The elements that you add to a sequence diagram are not added to the corresponding timing diagram. However, the elements that you add to a timing diagram are added to the corresponding sequence diagram. You can add elements to the timing diagram by creating new elements or by selecting existing elements. The timing diagram represents only a partial view of the interaction and therefore does not contain all the elements of a sequence diagram.

States and conditions Timing diagrams contain states or conditions. Sequence diagrams have state invariants that closely resemble a state or condition. A state invariant in a timing diagram is interpreted as the time, or duration, that the particular state invariant lifeline is in a specified state. The following example shows a timing diagram that contains two lifelines, state invariants, messages, duration observations and constraints and time observations and constraints.
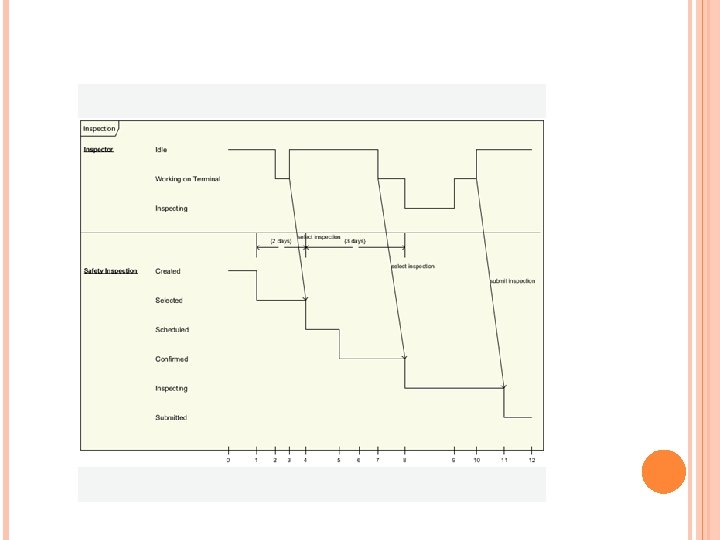

The following nodes and edges are typically drawn in a UML timing diagram: lifeline, state or condition timeline, destruction event, duration constraint, time constraint.

Lifeline is a named element which represents an individual participant in the interaction. While parts and structural features may have multiplicity greater than 1, lifelines represent only one interacting entity. See lifeline from sequence diagrams for details. Lifeline on the timing diagrams is represented by the name of classifier or the instance it represents. It could be placed inside diagram frame or a "swimlane". Lifelines representing instances of System and Virus
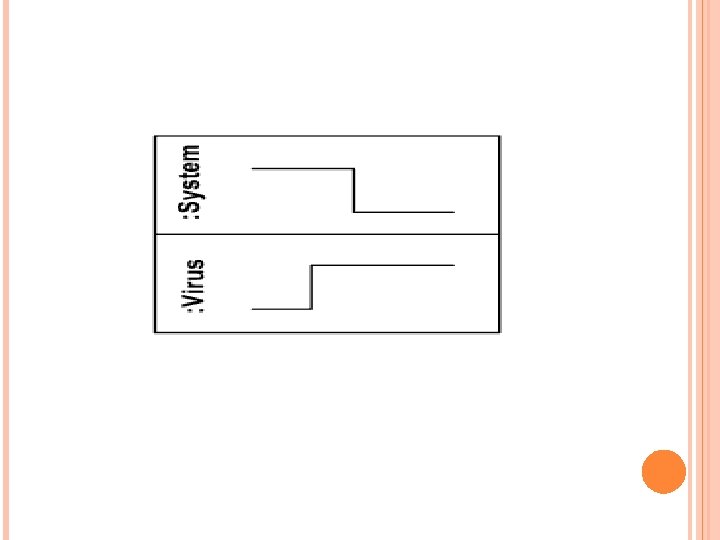

State or Condition Timeline Timing diagram could show states of the participating classifier or attribute, or some testable conditions, such as a discrete or enumerable value of an attribute. Timeline shows Virus changing its state between Dormant, Propagation, Triggering and Execution state

Duration Constraint Duration constraint is an interval constraint that refers to a duration interval. The duration interval is duration used to determine whether the constraint is satisfied. Ice should melt into water in 1 to 6 minutes

Time Constraint Time constraint is an interval constraint that refers to a time interval. The time interval is time expression used to determine whether the constraint is satisfied. The semantics of a time constraint is inherited from constraints. All traces where the constraints are violated are negative traces, i. e. , if they occur, the system is considered as failed. Person should wake up between 5: 40 am and 6 am

Destruction Occurrence Destruction occurrence is a message occurrence which represents the destruction of the instance described by the lifeline. Virus lifeline is terminated

COMPONENT DIAGRAM In the Unified Modeling Language, a component diagram depicts how components are wired together to form larger components and or software systems. They are used to illustrate the structure of arbitrarily complex systems. The component diagram's main purpose is to show the structural relationships between the components of a system.

a component represented implementation items, such as executables, documents, database tables, files, and library files. In component-based development (CBD), component diagrams offer architects a natural format to begin modeling a solution. Component diagrams allow an architect to verify that a system's required functionality is being implemented by components, thus ensuring that the eventual system will be acceptable.

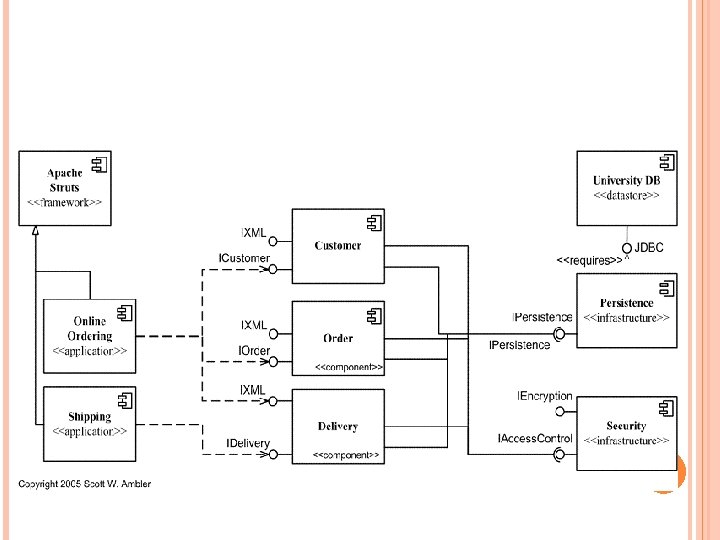
COMPONENT DIAGRAM THIS SIMPLE COMPONENT DIAGRAM SHOWS THEO RDER SYSTEM'S GENERAL DEPENDENCY USING UML

COMPONENT DIAGRAM UML component diagrams shows the dependencies among software components, including the classifiers that specify them (for example implementation classes) and the artifacts that implement them; such as source code files, binary code files, executable files, scripts and tables.

SYMBOLS Required interface Provided interface

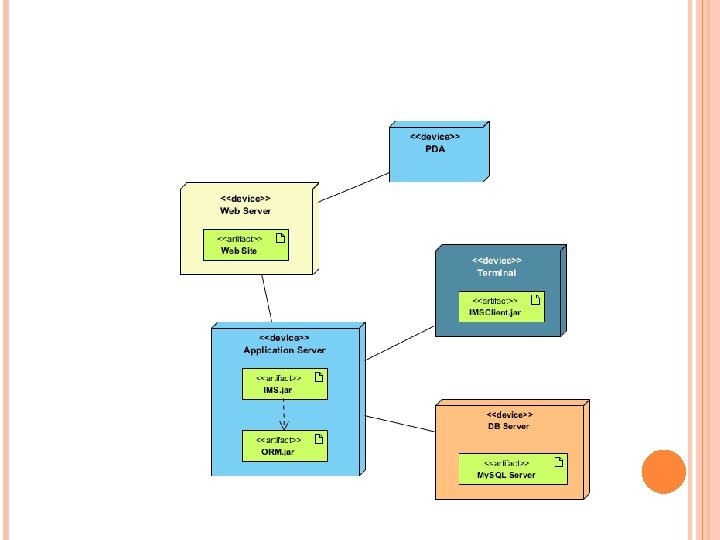
DEPLOYMENT DIAGRAM A deployment diagram in the Unified Modeling Language models the physical deployment of artifacts on nodes. To describe a web site, for example, a deployment diagram would show what hardware components ("nodes") exist (e. g. , a web server, an application server, and a database server), what software components ("artifacts") run on each node (e. g. , web application, database), and how the different pieces are connected

DEPLOYMENT DIAGRAM

PURPOSEThe name Deployment itself describes the purpose of the diagram. Deployment diagrams are used for describing the hardware components where software components are deployed. Component diagrams and deployment diagrams are closely related. Component diagrams are used to describe the components and deployment diagrams shows how they are deployed in hardware.

So most of the UML diagrams are used to handle logical components but deployment diagrams are made to focus on hardware topology of a system. Deployment diagrams are used by the system engineers.

The purpose of deployment diagrams can be described as: Visualize hardware topology of a system. Describe the hardware components used to deploy software components. Describe runtime processing nodes.

HOW TO DRAW DEPLOYMENT DIAGRAM? Deployment diagram represents the deployment view of a system. It is related to the component diagram. Because the components are deployed using the deployment diagrams. A deployment diagram consists of nodes. Nodes are nothing but physical hardwares used to deploy the application. Deployment diagrams are useful for system engineers.

An efficient deployment diagram is very important because it controls the following parameters Performance Scalability Maintainability Portability So before drawing a deployment diagram the following artifacts should be identified: Nodes Relationships among nodes

WHERE TO USE DEPLOYMENT DIAGRAMS? Software applications are developed to model complex business processes. Only efficient software applications are not sufficient to meet business requirements. Business requirements can be described as to support increasing number of users, quick response time etc. To meet these types of requirements hardware components should be designed efficiently and in a cost effective way.

DEPLOYMENT DIAGRAM

FUNCTIONAL REQUIREMENTS

- Slides: 69