Introduction to the uses of Scottish Neighbourhood Statistics

Introduction to the uses of Scottish Neighbourhood Statistics and the Scottish Index of Multiple Deprivation Matt Perkins Office of the Chief Statistician Scottish Government

Overview • SNS – Overview of website • SIMD – Background – Points to consider • Using SNS and SIMD – An example
 • Used as single")
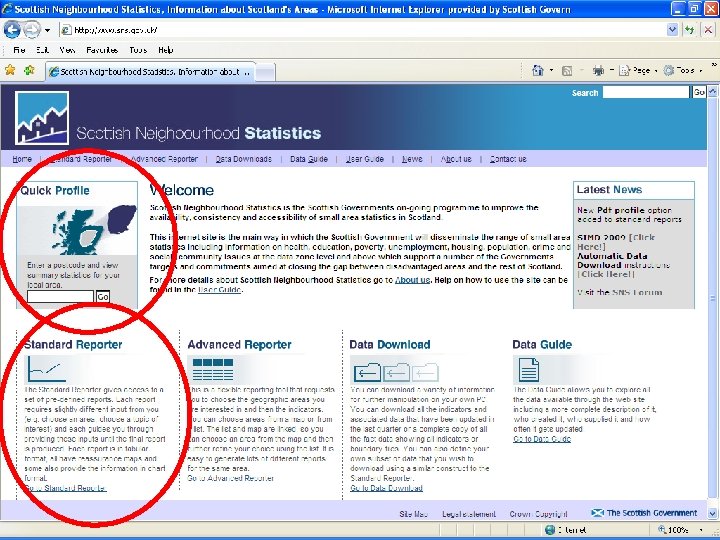
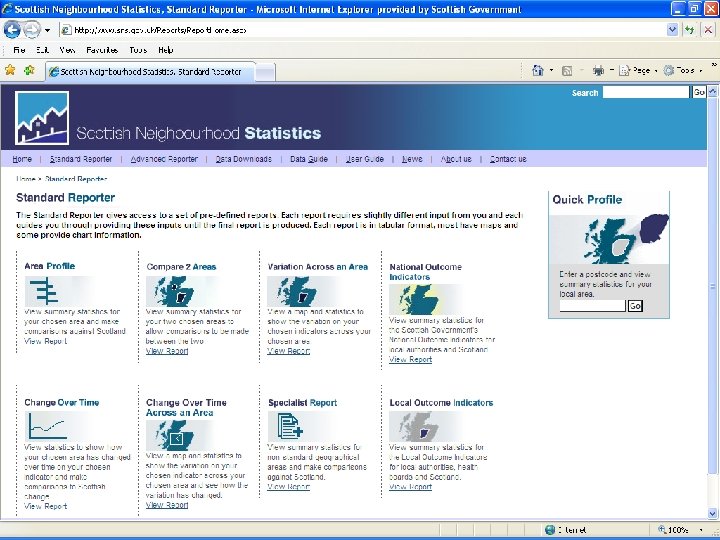
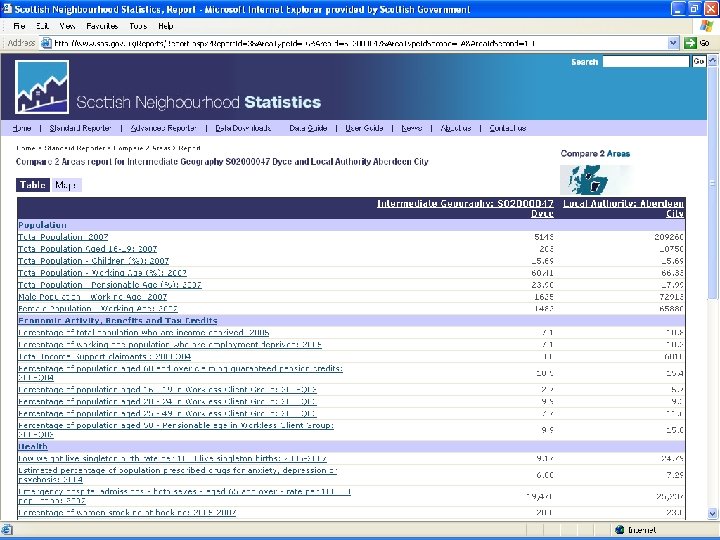
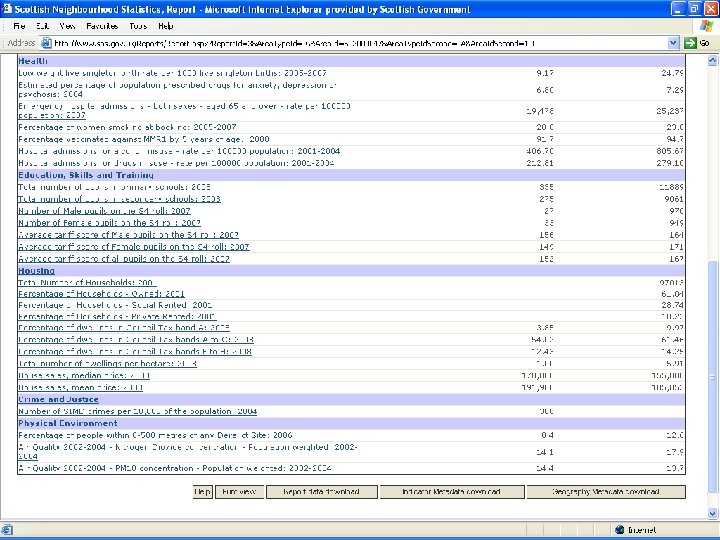
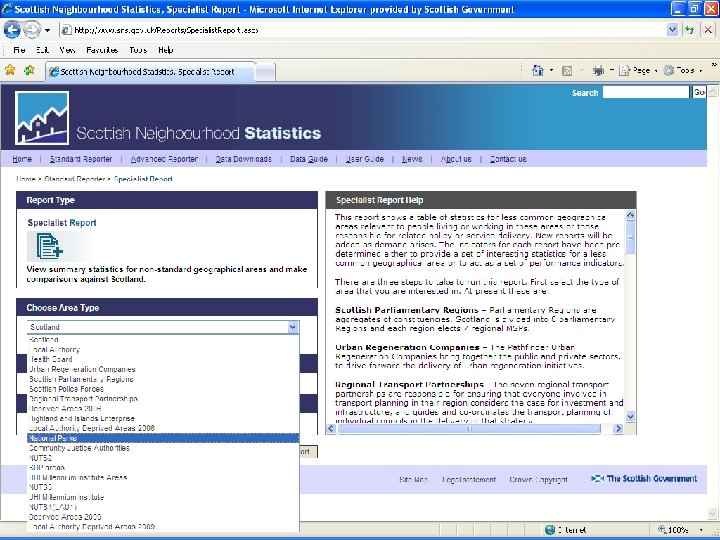
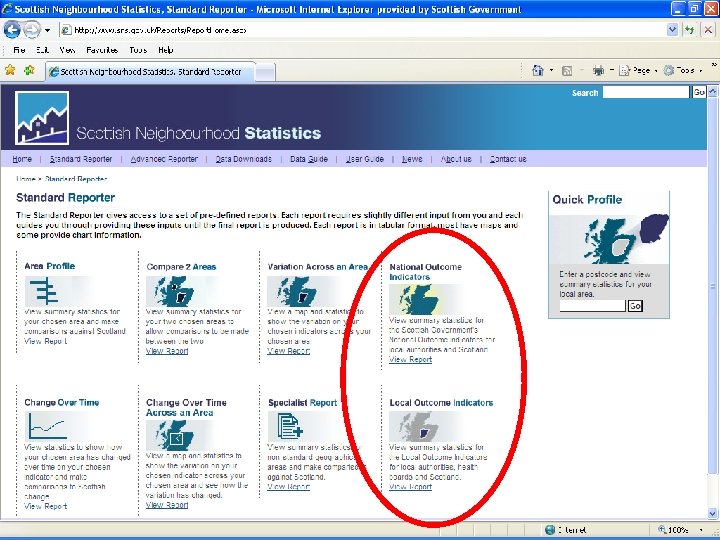
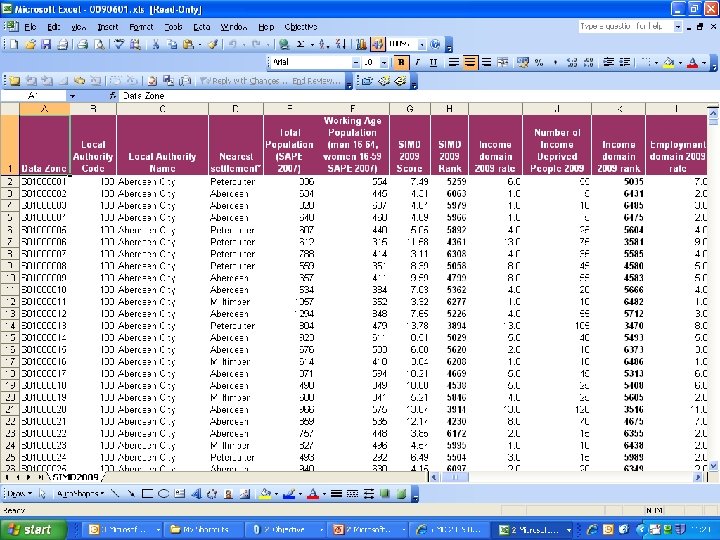
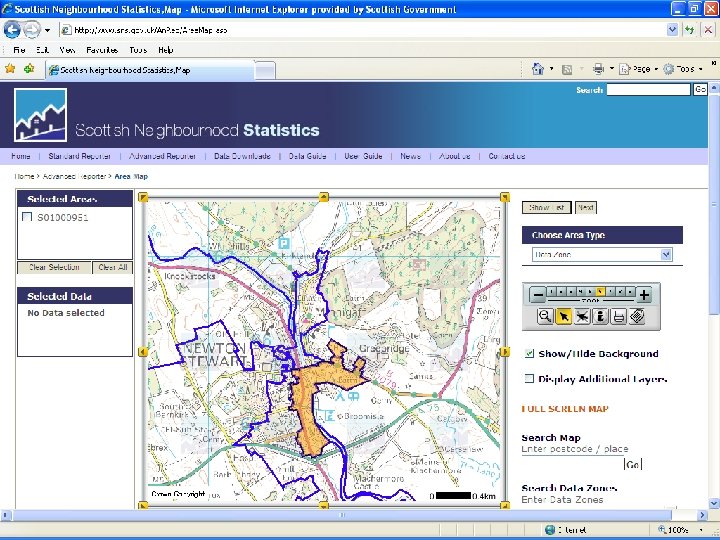
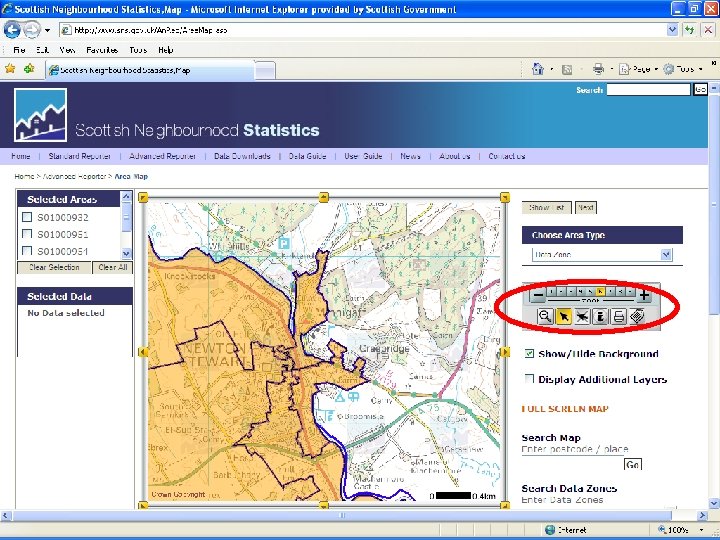
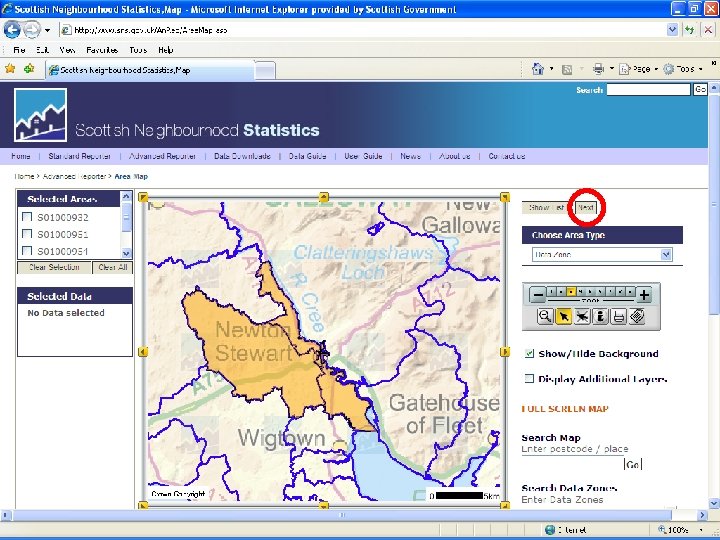
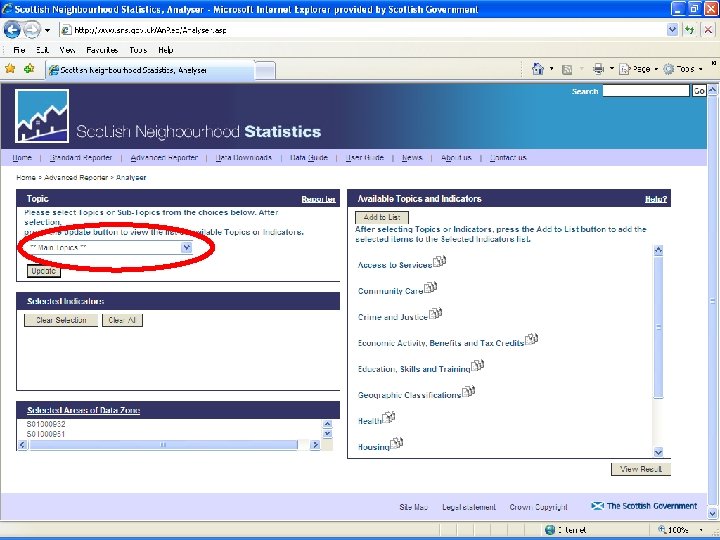
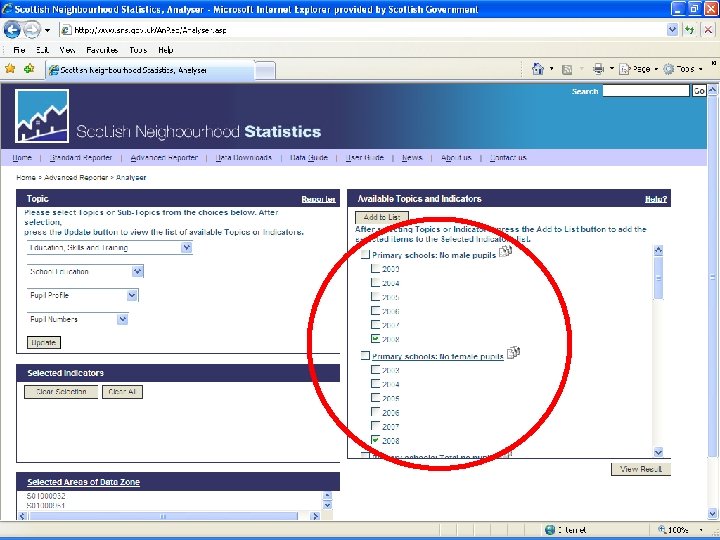
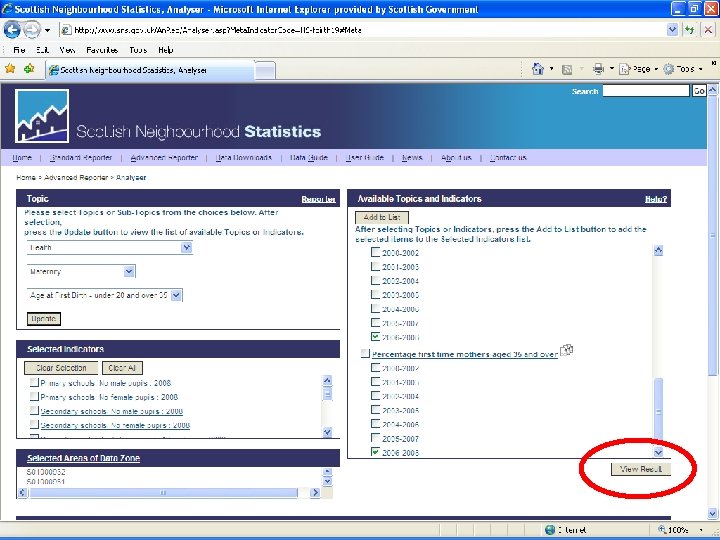
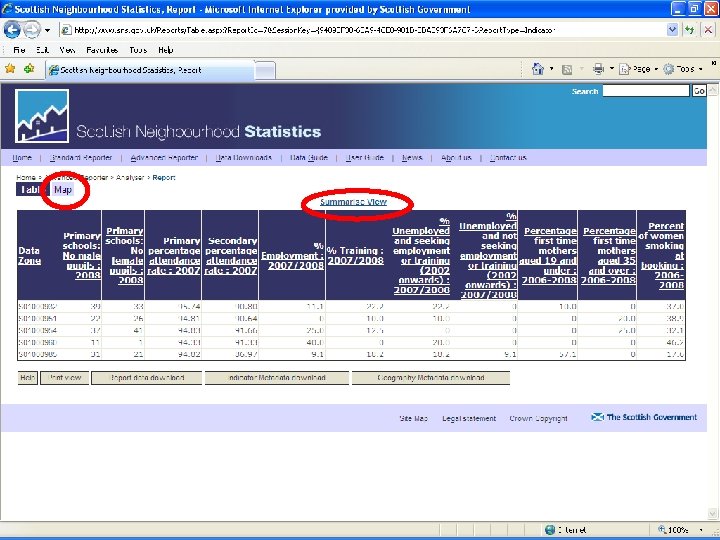
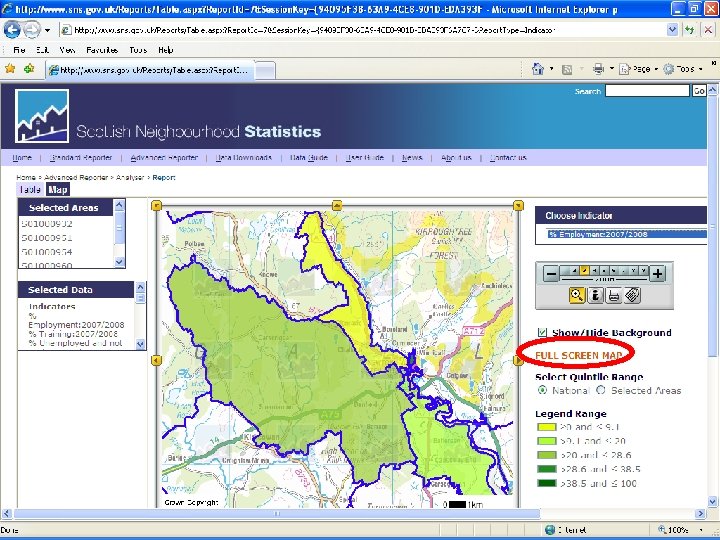
What is SNS? • Public website (www. sns. gov. uk) • Used as single point for accessing small area statistics for Scotland • Indicators across various topics and geographies • Many at data zone level • Range of pre-defined and custom reports

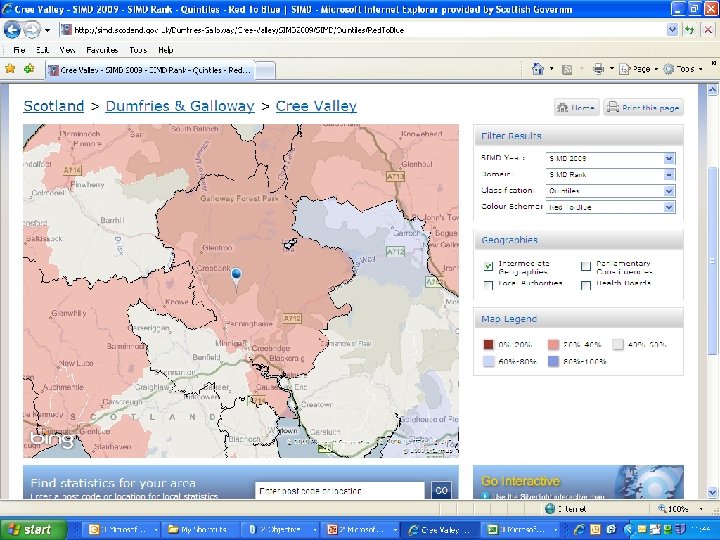
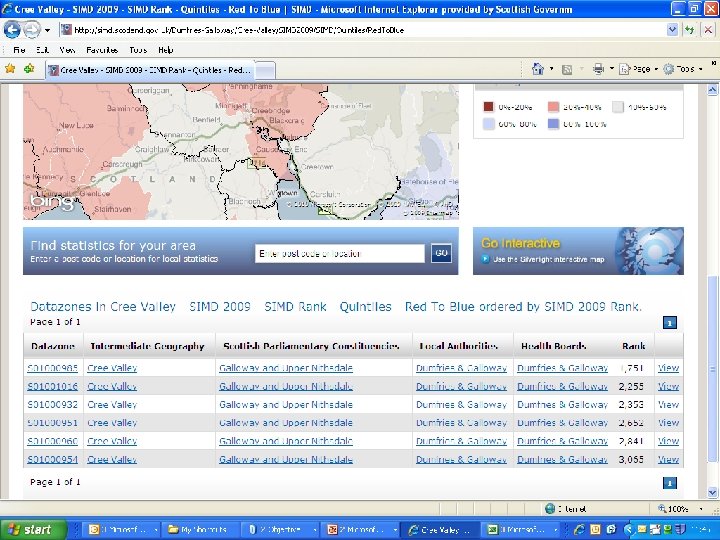
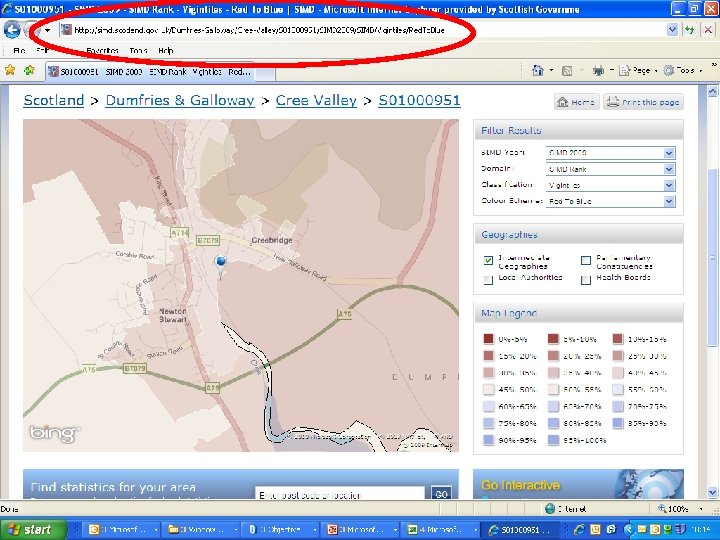
What are datazones? • • • Statistical geography Fixed boundaries over time 6, 505 datazones in Scotland Average population of 750 people Geographical building blocks

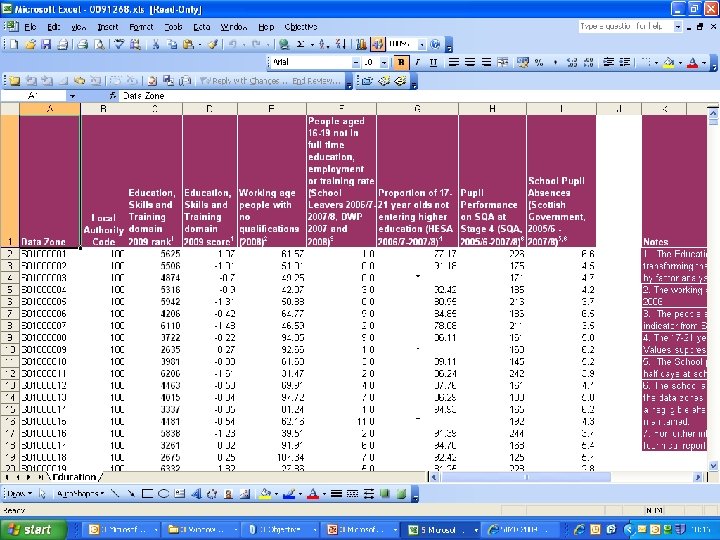
SNS Topics • • • Access to Services Community Care Crime and Justice Economic Activity, Benefits and Tax Credits Education, Skills and Training Geographic Classifications Health Housing Index of Deprivation Population Transport

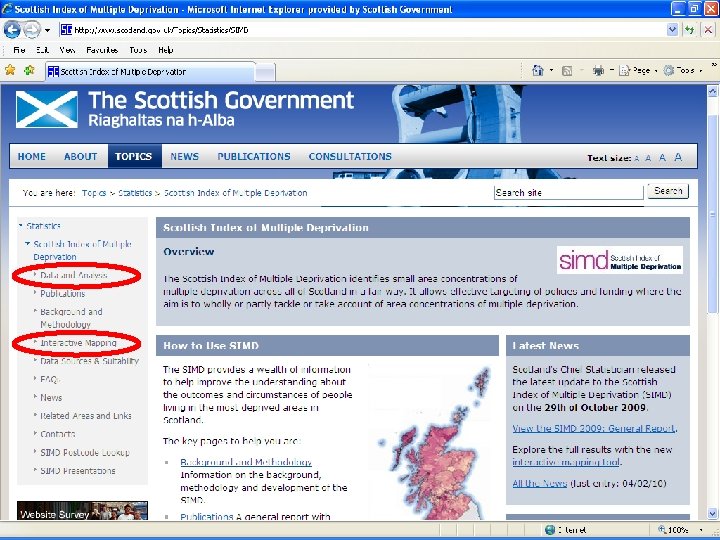
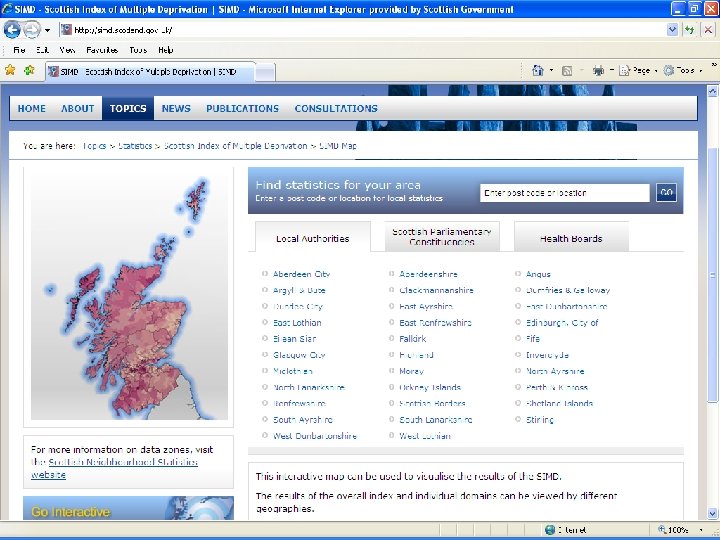
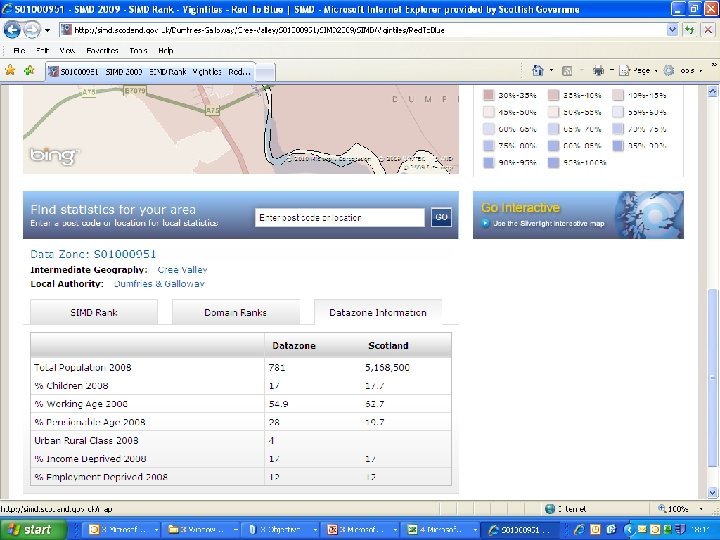
What is the SIMD? • The Scottish Index of Multiple Deprivation identifies small area concentrations of multiple deprivation across all of Scotland • Stable ‘data zone’ geography • Combines individual indicators on income, employment, health, education, access, housing and crime into ‘domains’ and overall index rank • Rank 1 = most deprived, 6, 505 = least deprived • The most deprived 976 areas are the 15% most deprived in Scotland • SIMD 2009 published on 29 th October.

Points to consider • The Index is relative ie shows an area is more or less deprived than another one but not how much more deprived. Use Income and Employment domains and the indicators. • There will always be a 15% most deprived – if a datazone moves out another will move in. • Changes to methodology so care is needed when comparing over time eg crime domain, tax credit data. • The least deprived area is not the most affluent, it just lacks deprivation • No datazones in the 15% most deprived does not mean no deprivation, just no concentrations of multiple deprivation • Not all people who are deprived live in deprived areas and not all living in a deprived area are deprived. • The SIMD is one measure of deprivation

Some ways to use the index • 15% most deprived datazones in Scotland, (or 10%, or 20%) • Local vs National share of deprived datazones • SIMD domains • SIMD within an area eg 10% most deprived data zones in a Local Authority • SIMD indicators available on SIMD website • Relative vs Absolute change • Change over time (Caution over methodology changes). • Concentrations within an area (income and employment domains)

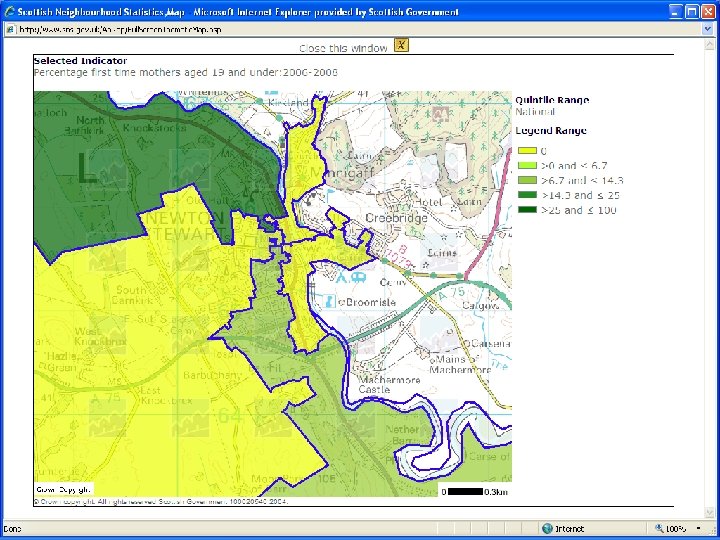
A worked example: Dumfries and Galloway


Box plots showing distribution of D&G datazones 0. 15 0. 26 0. 25 0. 09 0. 24


Contacts for further information or to arrange a workshop or seminar: Matt Perkins Tel: 0131 244 0443 matt. perkins@scotland. gsi. gov. uk Neighbourhood Statistics (SNS & SIMD) Tel: 0131 244 0442 neighbourhoodstatistics@scotland. gov. uk
- Slides: 38