Introduction to the Use of Autosomal DNA Testing


: a DNA sequence variation occurring")
 segment: a segment of DNA that is")
: a region of two paired chromosomes where at")


")


 pedigree")
 pedigree")
 pedigree")
 pedigree")
 and Katharina Wall (b. 1834)")


")


 1820 Census, Mason Co. , KY 1840")
 family")
 family")

, father of Elizabeth Reeves (b. ca 1802)")


- Slides: 73
Introduction to the Use of Autosomal DNA Testing to Solve Genealogical Research Questions by Tim Janzen MD tjanzen@comcast. net My. Heritage Genealogy Conference October 29, 2017 May be downloaded from http: //tinyurl. com/TJOct 2017 -1
Overview �Basic autosomal DNA terms �Background information about autosomal DNA �Autosomal DNA analysis �The impact of endogamy on the inheritance of Autosomal DNA �Autosomal DNA success stories
Structure of DNA
Male Chromosomes
Major Types of DNA �Y chromosome: found only in males and passed from father to son; only 26 million base pairs sequenced thus far out of about 60 million �Mitochondrial DNA: found in both males and females, but passed on only by the mother to her children; 16, 569 base pairs in a circle �Autosomal DNA: 44 chromosomes; each parent contributes one half of the DNA to their children �X chromosome: 2 in females and 1 in males; sons receive one chromosome from their mother and daughters receive one chromosome from each parent
Autosomal DNA �May be used to determine the relative degree to which 2 people are related to each other on any line of descent if they share at least one common ancestor in the recent past �Has significant potential for genealogical researchers since there a total of 44 chromosomes that can be tested �Limited by the fact that the chromosomes recombine at conception and thus one half of each parent’s markers is not passed to a specific child �Of most benefit in determining relationships between people who share a common ancestor
Food for Thought: The DNA Puzzle
Fitting Together the Pieces
The DNA Puzzle �Approximately 7093 c. Ms in the genome �Match size is generally a minimum of ca 7 c. Ms, so there a minimum of 1000 pieces in the puzzle �Generally all ancestors generally contribute at least a portion of their autosomal DNA to each of their descendents back to at least 5 to 6 generations �At 10 generations back in time only about 12% of one’s ancestors are contributors of autosomal DNA to your genome; only ca 120 of your 1024 ancestors are genetic ancestors �http: //www. genetic-inference. co. uk/blog/2009/11/how -many-ancestors-share-our-dna
Autosomal DNA Terms �Single Nucleotide Polymorphism (SNP, pronounced snip): a DNA sequence variation occurring when a single nucleotide — A, T, C or G — in the genome (or other shared sequence) differs between members of a biological species or paired chromosomes in an individual. For example, two sequenced DNA fragments from different individuals, AAGCCTA to AAGCTTA, contain a difference in a single nucleotide. In this case we say that there are two alleles: C and T. Almost all common SNPs have only two alleles.
Autosomal DNA Terms �Identical by Descent (IBD) segment: a segment of DNA that is found to be identical (except for rare mutations or testing errors) in two people who are related to each other due to the fact that this segment was passed down to both of them from a common ancestor. �Identical by State (IBS) segment (false match): a region of the genome where two people by coincidence share at least one matching base pair for the entire region. In such cases the segment does not come from a common ancestor.
Autosomal DNA Terms �Half-identical region (HIR): a region of two paired chromosomes where at least one of the two alleles from one person's pair of chromosomes matches at least one of the two alleles from a different person's pair of chromosomes throughout the entire region. A half-identical region may be either identical by descent (IBD) or identical by state (IBS)(a false match). �Centimorgan (c. M): a unit of measure of genetic recombination frequency; one c. M is equal to 1% chance that a marker at one genetic locus will be separated from a marker at another locus due to crossover in a single generation; 1 c. M is on average about 1 million base pairs.
Example of a HIR with 10 SNPs
Example of a HIR that is IBD
Example of a HIR that is IBS
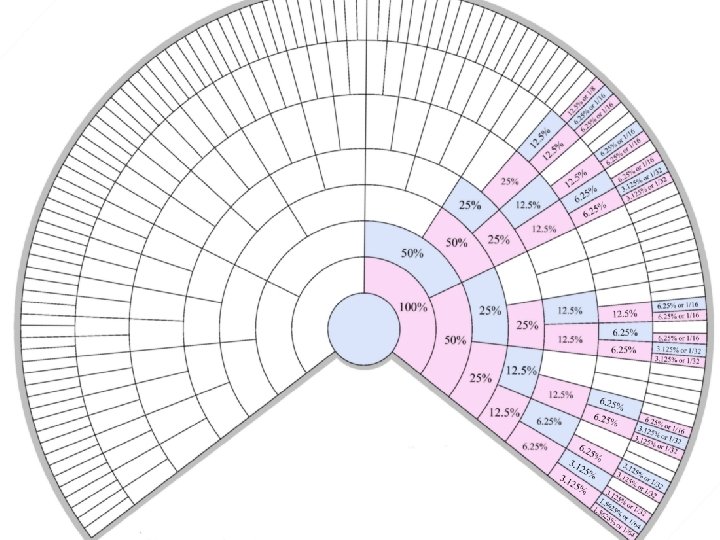
Autosomal DNA Testing Basics �Parent/child pairs share 50% of their autosomal DNA �Siblings share 50% of their autosomal DNA �Aunts, uncles/nieces, nephews share 25% of their autosomal DNA �First cousins share 12. 5% of their autosomal DNA �Second cousins share 3. 125% of their autosomal DNA �Third cousins share 0. 78% of their autosomal DNA �Fourth cousins share 0. 195% of their autosomal DNA �Fifth cousins share 0. 049% of their autosomal DNA �Sixth cousins share 0. 0122% of their autosomal DNA
Autosomal DNA Testing Basics �Parents/children share 3552 autosomal c. Ms �Siblings share 2600 c. Ms on average �Aunts, uncles/nieces, nephews share 1776 c. Ms on average �First cousins share 888 c. Ms on average �Second cousins share 222 c. Ms on average �Third cousins share 55 c. Ms on average �Fourth cousins share 14 c. Ms on average �Fifth cousins share 3. 5 c. Ms on average �Sixth cousins share 0. 76 c. Ms on average
Ranges of total c. Ms of IBD segments based on family relationship �Parent/child: 3539 -3748 c. Ms � 1 st cousins: 533 -1379 c. Ms � 1 st cousins once removed: 115 -851 c. Ms � 2 nd cousins: 46 -515 c. Ms � 2 nd cousins once removed: 0 -325 c. Ms � 3 rd cousins: 0 -217 c. Ms � 3 rd cousins once removed: 0 -173 c. Ms � 4 th cousins: 0 -127 c. Ms � 5 th cousins: 0 -94 c. Ms
Ranges of percentage of genome in common based on family relationship �Parent/child: 47. 54 -53. 24 � 1 st cousins: 7. 31 -14. 23 � 1 st cousins once removed: 2. 88 -8. 51 � 2 nd cousins: 1. 15 -5. 68 � 2 nd cousins once removed: 0. 33 -2. 60 � 3 rd cousins: ca 0. 16 -1. 21 � 3 rd cousins once removed: 0 -1. 32 � 4 th and more distant cousins: 0 -. 73
Odds of matching a relative in a DNA database � 1 st cousin or closer: 100% � 2 nd cousin: >99. 9% � 3 rd cousin: ca 90% � 4 th cousin: ca 50% � 5 th cousin: ca 15% � 6 th cousin: ca 1%
Two basic types of autosomal DNA analysis for genealogical purposes �Quantitative analysis. This is where one compares the amount of autosomal DNA in c. Ms that two or more people share in common to see if it meets the amount expected. This technique can be safely used going back 4 to 5 generations. �Triangulation. This is process of reviewing the pedigree charts of people who match on the same autosomal DNA segment to see if a common ancestor can be found. This technique can be used going back many generations. �The two techniques can frequently be combined, at least for evaluation of genealogical relationships going back 5 generations.
Developing a proper perspective about autosomal DNA testing using purely a quantitative analysis �Easy to solve: first degree relationships: parent to child relationships; sibling relationships �Relatively easy to solve: second degree relationships to 2 nd cousins: grandparent to child relationships; first and second cousin relationships �Moderately difficult to solve: third to 4 th cousins relationships �Very difficult to solve: 5 th cousin relationships �Extremely difficult to solve: 6 th cousin relationships and more distant relationships; much data is required
Principles of Autosomal DNA Interpretation �It is possible to use the amount of autosomal DNA that two people share in common with each other to predict how closely related they are, particularly if they are 2 nd cousins or more closely related than that. �The smaller the number of unique autosomal SNPs included in the dataset being analyzed, the more inaccurate the precise start and stop positions of the shared half-identical regions will be in general. �The datasets used for autosomal DNA analysis for genealogical purposes typically include at least 500, 000 autosomal SNPs and provide broad coverage of the entire human genome.
Principles of Autosomal DNA Interpretation �It should be noted that for each genealogical relationship there is a range of results possible in terms of the amount of shared autosomal DNA except at the parent/child level of relationship where the amount shared is always 50%. �Due to the random nature of DNA mutations and recombination, results from some families may fall outside of the statistical norms. �The fewer the number of generations back to your genealogical brick walls, the easier they are to solve using autosomal DNA. �Use genealogical data to complement the analysis of autosomal DNA data.
Principles of Autosomal DNA Interpretation �Caution should be exercised with attempting to determine the true genealogical relationship among people who are thought to be related to each other more distantly than second cousins. �In situations such as this where the genealogical relationship is uncertain, testing additional relatives, particularly first and second cousins of the people involved and then averaging the amount of shared autosomal DNA can help better clarify the true genealogical relationship. �It should be noted that when performing such calculations it is generally best to remove all half-identical regions (HIRs) below 4 c. Ms since the majority of HIRs under 4 c. Ms are false matches.
Principles of Autosomal DNA Interpretation �When there is doubt as to the true genealogical relationship between two closely related people, testing additional close relatives can help clarify the true genealogical relationship. �As a general rule, all relatives who are second cousins or more closely related to each other will share at least some autosomal DNA with each other. �Beyond the second cousin level of genealogical relationship, the amount of autosomal DNA that is shared in common between two relatives can be quite variable, ranging from no shared autosomal DNA to 200 centimorgans (c. Ms) or more for some second cousins once removed.
Distribution of IBD segment length relative to the number of generations back to shared ancestor as simulated by Speed and Balding
Sometimes Close is yet so Far: Comparison between Betty Janzen and her two brothers to J. M. predicts 3 rd cousin once removed relationship, right?
Wrong! Comparison between Betty Janzen, her two brothers and their three Youngman cousins to J. M. predicts no closer than 4 th cousin relationship
Creating Your Master Match List Spreadsheet �Download your family’s matching segment data (HIR data) from the links provided for the companies that provide chromosome browsers and from GEDmatch using the Tier 1 utility Matching Segment Search. �Integrate all of this data into one Excel file. �Sort your Excel file first by chromosome, then by whether or not one of your children shares the same segment as your match, and then by start position. �Merge duplicate data from the same people.
Betty Janzen’s Match List
Betty Janzen’s Match List
Gold Mining Your match list is like gold mining You have to pan a lot of dirt to find the gold nuggets
Gold Mining and your Match List �You need to be constantly working your match list. �Frequently download the shared segment data for new matches from the DNA testing companies and GEDmatch and incorporate it into your match list. �If people don’t have a pedigree chart posted on the company’s website then ask them for it. �If you have both your match’s matching segment data and their pedigree then you are “golden”. �Consider adding their pedigree chart data to either your personal database or to a large universal family tree such as the Family. Search Family Tree, Geni. com, and/or Wiki. Tree. �I maintain separate files for my matches’ GEDCOM files or screen shots of their basic 4 or 5 generation pedigree charts.
Tim’s Tips for Correspondence �Contact all of your close matches who share at least 20 c. Ms with you and if you have time contact all matches who share as little as 7 c. Ms with you �Be willing to share your genealogy information! �Ask your matches to share their genealogy information with you, preferably as a GEDCOM file �Keep track of all your correspondence in an organized way �Have standardized introductory and follow up messages
The Endogamous Issue �Some people have lots of ancestors who appear multiple times in their pedigree charts and others have relatively few. �Endogamy is generally driven by ethnic or religious background or by the fact that one’s ancestors lived in the same location for many years. �Mapping your chromosomes and determining precisely how you inherited a particular DNA segment from a match is generally more complicated if you come from an endogamous group as compared to a non-endogamous group. �Examples of endogamous groups: Polynesians, Ashkenazi Jews, Low German Mennonites, people from Newfoundland many “islands”.
The problem of endogamy: Robert Janzen and his Suderman cousin
Robert Janzen and his Suderman cousin’s Half-identical Regions
Robert Janzen and his Suderman cousin’s HIRs mapped to Robert Janzen’s ancestors
Peters (b. 1847) pedigree
Agatha Bergen (b. 1848) pedigree
Jacob A. De Fehr (b. 1851) pedigree
Katharina Wiens (b. 1852) pedigree
Four of Robert Janzen’s Ancestors Jacob Janzen (b. 1832) and Katharina Wall (b. 1834) Peters (b. 1846) and Agatha Bergen (b. 1848)
Resources for information about Autosomal DNA �https: //isogg. org/wiki/Autosomal_DNA_testing_com parison_chart (provides information about the autosomal DNA tests offered by the major companies) �http: //isogg. org/wiki/Portal: Autosomal_DNA �http: //isogg. org/wiki/Autosomal_DNA_statistics �https: //www. familytreedna. com/learn/autosomalgenealogy-matching
My. Heritage autosomal DNA matching �http: //blog. myheritage. com/2016/05/myheritage-isadding-free-dna-matching �http: //helpcenter. myheritage. com/DNAmatching/82928365/How-can-I-upload-my-autosomal -DNA-test-results. htm �Match review page released Aug. 22, 2017 https: //blog. myheritage. com/2017/08/new-reviewmatch-page-discover-how-you-are-related-to-yourdna-matches �My. Heritage is still developing the product �No fees if raw data files are uploaded now
My. Heritage DNA Matching �Many people have pedigree charts �No e-mail is provided and you must use My. Heritage’s interface to send messages �The review page displays matching ancestors, shared surnames and shared ethnicities �The pedigree display has a nice visual layout �Match threshold is about 13 c. Ms for the longest segment and about 4 c. Ms for shorter segments �Data is phased before generating the list of matches �No matching segment data provided at this time �A chromosome browser is coming!
My. Heritage DNA Matches
GEDmatch �www. gedmatch. com �created by John Olson and Curtis Rogers �provides a means for people to compare autosomal SNP data �Data from all major genetic genealogy testing companies may be uploaded �allows uploads of phased data files
GEDmatch �“one-to-many” search feature finds all of one’s autosomal matches in the database using the �“one-to-one” comparison feature finds matching HIRs between any two people �also allows uploads GEDCOM files �About 500, 000 people in the GEDmatch database �Basic membership is free �Tier 1 Utilities membership is $10 per month
GEDmatch options
GEDmatch Tier 1 Utilities
An Autosomal Success Story: A. K. �A. K. is a match for my mother, Betty Janzen. �He transferred his data to GEDmatch. �I ran the matching segment data report for him (a Tier 1 option) using a 5 cm and 500 SNP threshold. �I searched for my e-mail address in the report and located all of my relatives in the report. �A. K. shares 47 c. Ms on average with my mom, her two brothers and 6 other 2 nd cousins on the Lawrence/Mc. Cleary side of my mom's family. �The 47 c. M average suggests a 3 rd cousin once removed to 3 rd cousin relationship between my mom and this match. �The segment on chromosome 1 that A. K. shares with Betty Janzen on chromosome 1 had previously been mapped to Mary Mc. Cleary (b. 1850) based on a comparison to another Mc. Cleary cousin.
A. K. , the data
My message to A. K. �“Your ancestor ‘Sarah J. ’, b. ca 1841 in ‘Indiana’ is Sarah Jane Mc. Cleary (b. 24 Sep 1841 in Iowa), the daughter of Moses Mc. Cleary (b. 18 May 1815 in Tuscarawa Co. , Ohio, d. 28 May 1865 in Johnson Co. , Kansas) and Margaret Perry (b. 19 Mar 1816 in Ohio, d. 26 Mar 1884 in Lenope, Kansas). I descend from Sarah Jane Mc. Cleary's sister Mary Mc. Cleary (1850 -1888). See http: //trees. ancestry. com/tree/73764861/family for my mom's family tree. You share 47 c. Ms on average with my mom, her two brothers and 6 other 2 nd cousins on the Lawrence/Mc. Cleary side of my mom's family. This suggests a 3 rd cousin once removed to 3 rd cousin relationship. The true relationship is 3 rd cousin once removed. In addition, I have previously mapped the segment on chromosome 1 that you share with my mom back to Mary Mc. Cleary due to the fact that another Mc. Cleary cousin shares that same segment with my mom. I didn't have any family data for Sarah Jane Mc. Cleary in my database. However, I did have a marriage for her to 'Alvin' Mitchell on 13 May 1860 in my database. It seems that I have the incorrect first name for her husband that his first name
A. K. ’s old pedigree chart
A. K. ’s new pedigree chart
Mary Mc. Cleary (1850 -1888)
An Adoptee Success Story �H. K. was adopted shortly after birth. �He knows his maternal ancestry, but not his paternal ancestry. �He did an autosomal DNA test and is a match to my mother Betty Janzen. �After some discussion he allowed me to upload his data to GEDmatch on my account. �I reviewed his mother’s pedigree chart and noted that he has a Reeves ancestor, Harriet Reeves (b. ca 1820) whose ancestry was unknown.
An Adoptee Success Story
DNA comparison data for H. K.
DNA comparison data for H. K.
Census data for John Reeves (b. 1782) 1820 Census, Mason Co. , KY 1840 Census, Mason Co. , KY
John Reeves (b. ca 1783) family
John Reeves (b. ca 1745) family
An Adoptee Success Story �Conclusion: There is a combination of both autosomal DNA data and genealogical data that strongly suggests that Harriet Reeves (b. ca 1819) was the son of John Reeves (b. ca 1783) and Sarah Fenton (b. ca 1788)
Gravestone of Stacy Reeves (17781849), father of Elizabeth Reeves (b. ca 1802)
Key Points in Quantitative Autosomal DNA Analysis �Analyze the people who should be most closely related to each other first. Analysis of their results will generally be more accurate than analysis of more distantly related clusters. �Target the oldest generation for testing. �Maximize the number of people tested if at all possible. �Test people from different lines of descent if at all possible. �Always be willing to review previous conclusions you may have drawn about genealogical relationships.
X Chromosome �Use in genetic genealogy is limited, but there are uses for it, particularly in terms of determining relationships between close relatives of adoptees. �Chromosome mapping can be done with the X chromosome. �Has significant value when the results are used in conjunction with other DNA, particularly autosomal test results
Some sources of X chromosome matching segment data �Family Tree DNA’s Family Finder chromosome browser �GEDmatch X One-to-one feature
Interpretation of X chromosome matching segment data �Mothers share a complete X chromosome with their sons and portions of each of their 2 X chromosomes with their daughters totaling 1 X chromosome �Fathers share a complete X chromosome with their daughters and none of their X chromosome with their sons �Close relatives such as siblings can share as much as a complete X chromosome with each other or may share little or no X chromosome segments with each other �The amount of the X chromosome in c. Ms that more distant relatives share with each other is highly variable and is dependent on the genealogical relationship and on the inheritance pattern of the X chromosome
Questions? �This presentation may be downloaded from http: //tinyurl. com/TJOct 2017 -1