Introduction to the t Test Chapter 7 Chapter


 The number by which you divide to get the estimated")
")


, but with")


- Slides: 36
Introduction to the t Test Chapter 7 Chapter 8
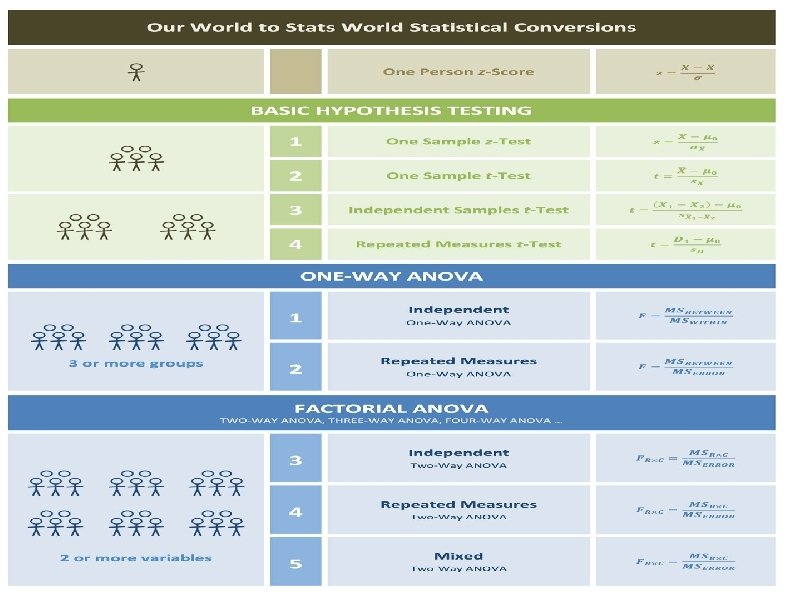
Chapter Outline The t-test for a Single Sample The t-test for Independent Means The t-test for Dependent Means Assumptions of the t-test for a Single Sample, Independent, and Dependent Means Effect Size and Power for the t-test
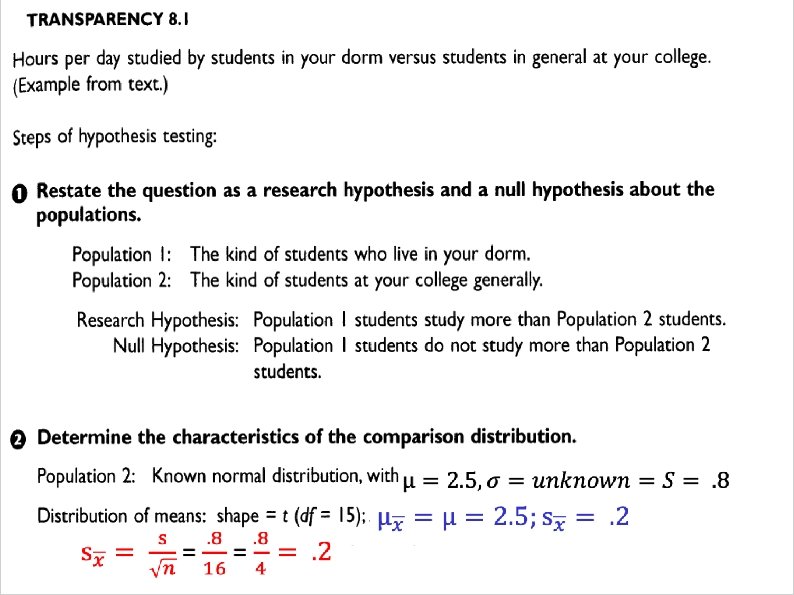
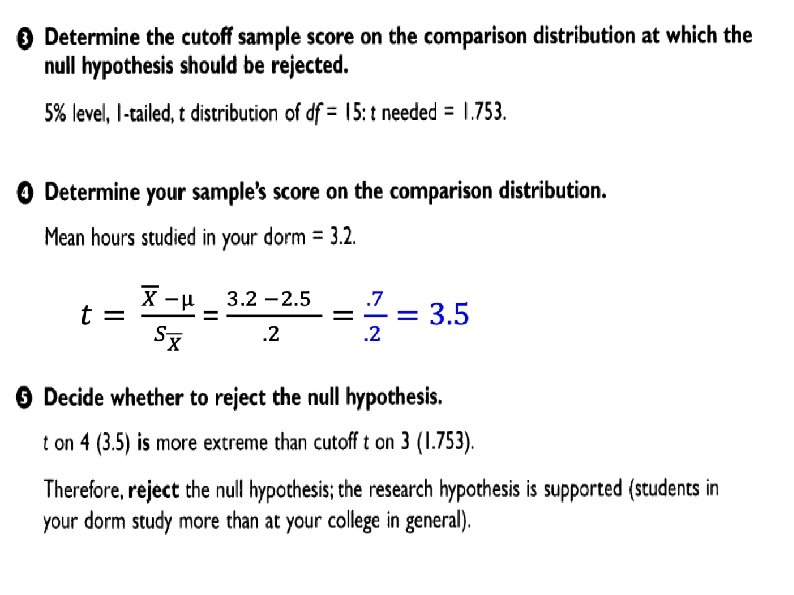
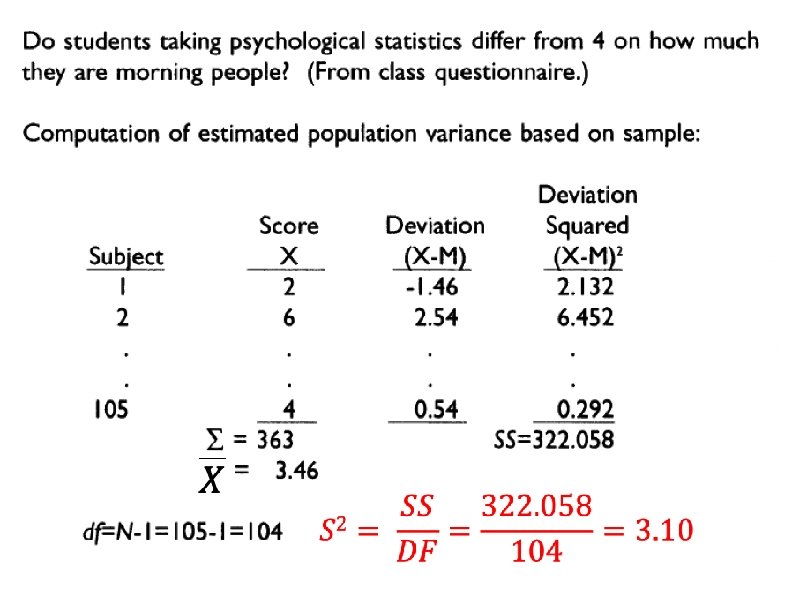
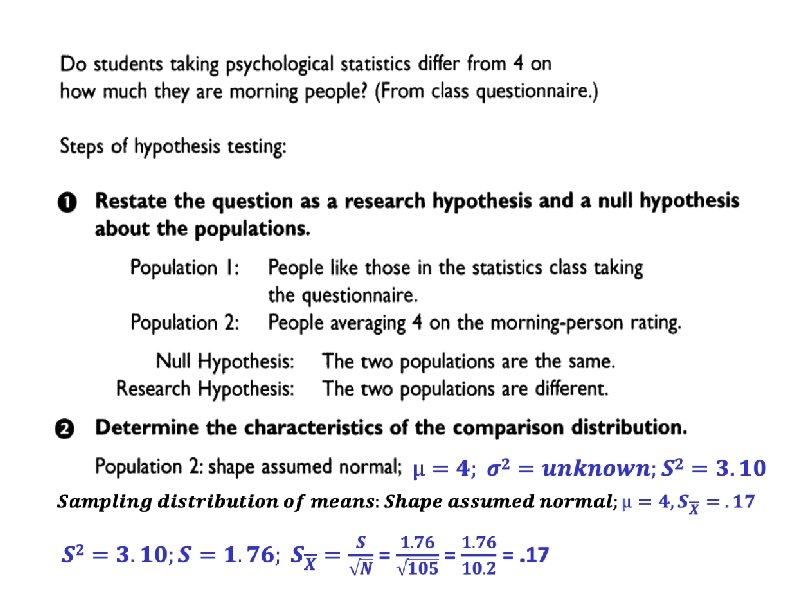
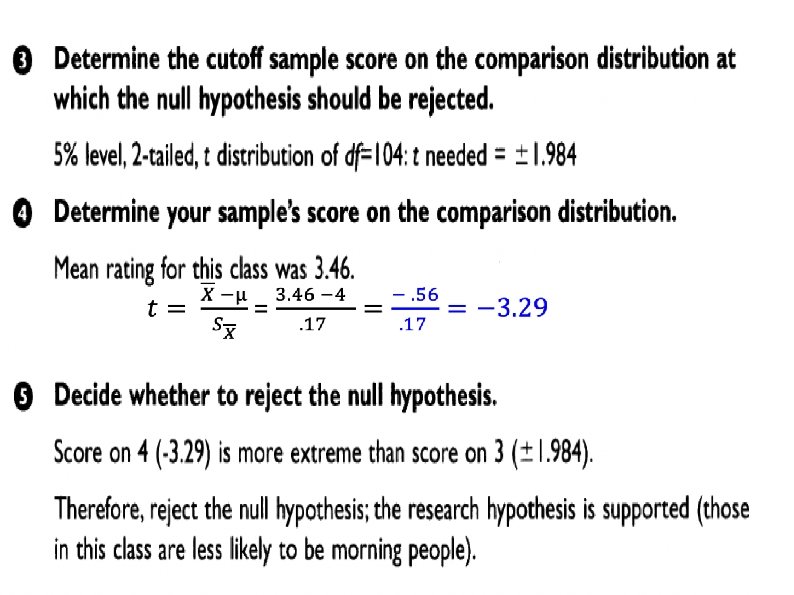
The t-test: For a Single Sample Comparing a sample to a population Pop. Mean (µ) known BUT Pop. SD 2 (σ2) is UNKNOWN! 2 Estimated Pop. Variance (S ) Logic of hypothesis testing same as before (Z-test) BUT IN Step 2, Because Pop. SD 2 is unknown, with a t-test you have to estimate it! With an estimated variance, the shape of the distribution is not normal, so a special table is used to find cutoff scores.
If σ2 is not known Only information we have about population is sample If sample represents its population, variance should say something about the variance pop. it represents
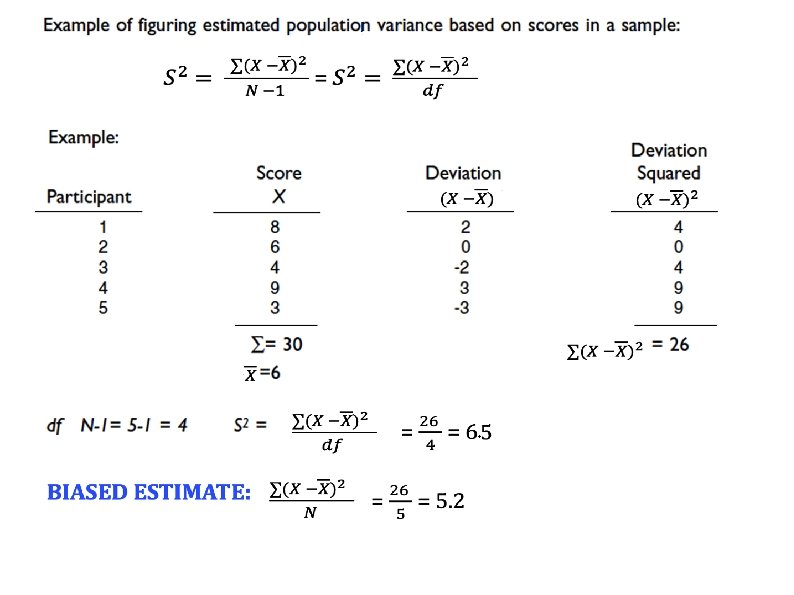
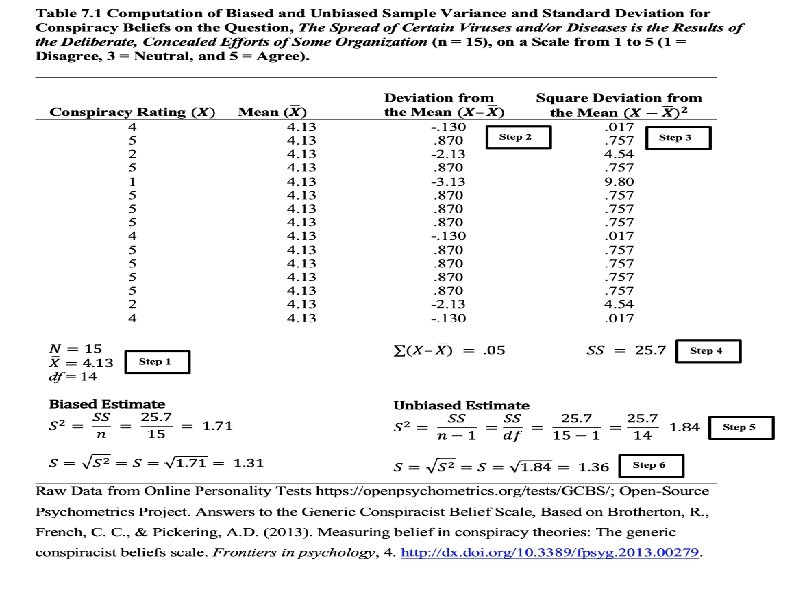
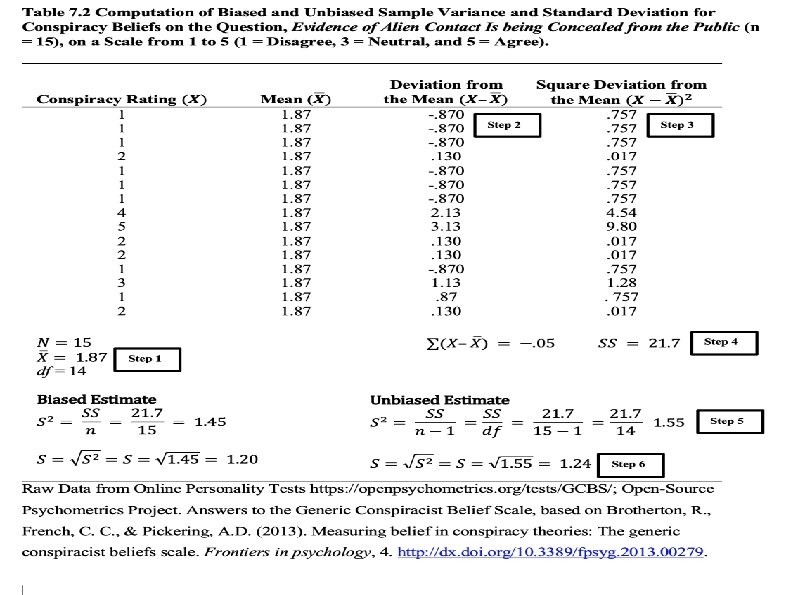
Estimating population variance If sample = small variance, population = small variance If sample = large variance, population = large variance Sample’s variance cannot be used directly as an estimate of the population variance A sample’s variance is smaller (mathematically) than its population’s variance
Estimating population variance
Terminology Estimated Population Variance = S 2 = Sample Variance Estimated Population Standard Deviation = Sample Standard Deviation
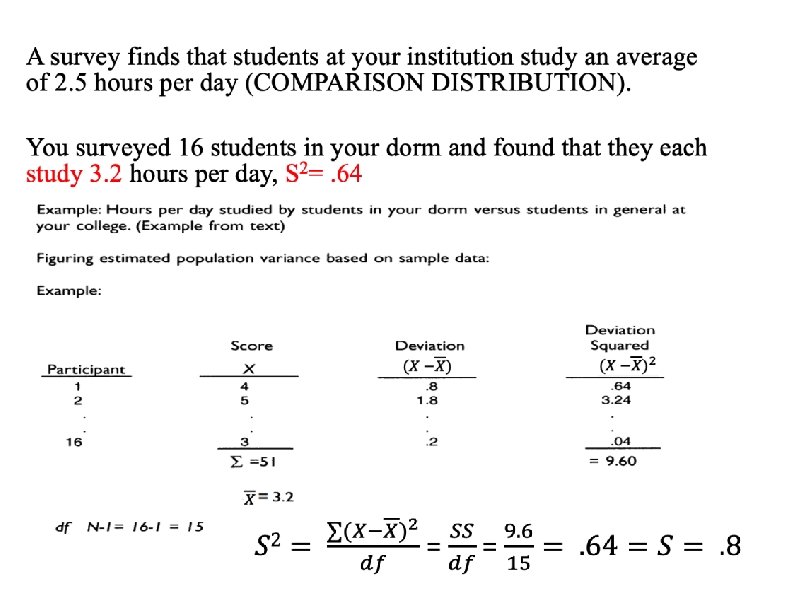
Degrees of Freedom (df) The number by which you divide to get the estimated population variance Number of scores free to vary when estimating a population parameter If you know the mean of the population and all but one of the scores in the sample, you can figure out the score you don’t know. Once you know the mean, one of the scores in the sample is not free to have any possible value and the df then would = N – 1
Degrees of Freedom (DF)
t-Tests
The t-Statistic
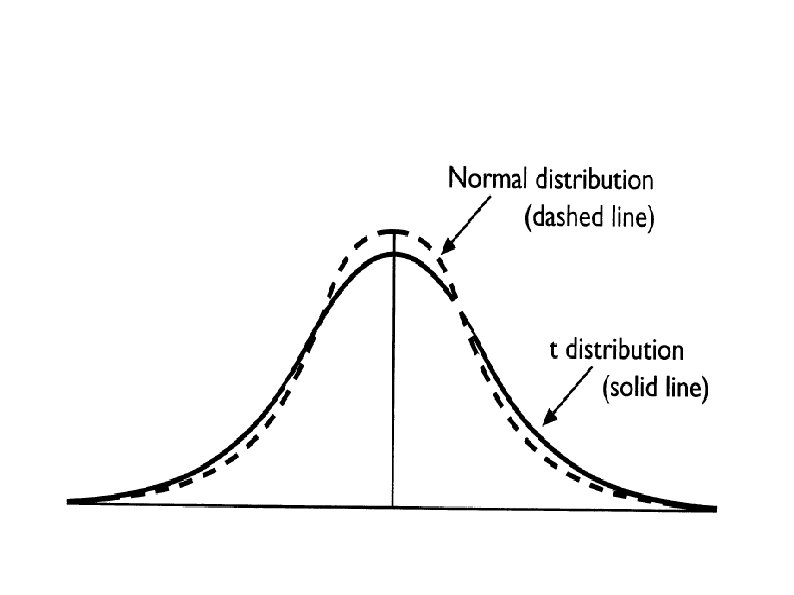
T-distribution USED when estimating pop. Variance Similar to normal curve (Unimodal, symmetrical), but with fatter tails When using small samples (less true information, loses some accuracy) Estimating Pop. Variance with less info. More room for error Need more extreme sample means to reject H 0
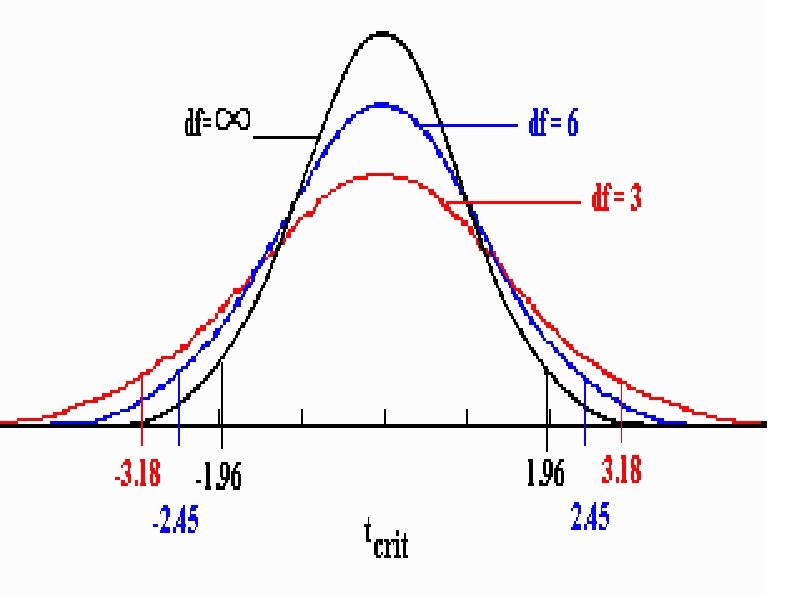
t distribution There are many t-distributions, the shapes of which vary according to df used to calculate the distribution. There is only t distribution for any particular df. Assumption of normality is required! The more degrees of freedom, the closer the t distribution is to the normal curve With N ≥ 100 or infinite degrees of freedom, t distribution = normal curve
t distribution df = inf df = 3 df = 1
What happens as sample gets larger?
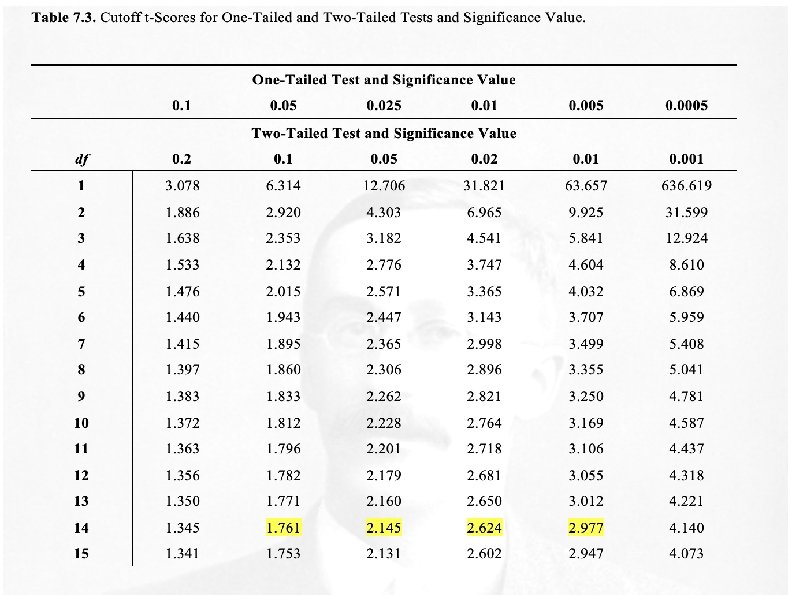
When Using a t Table… Determine whether you have a one- or a two-tailed test. If you are using a one-tailed test, decide whether your cutoff score is a positive or a negative t score. If your one-tailed test is testing whether the mean of Population 1 is greater than the mean of Population 2, the cutoff t score is positive. If the one-tailed test is testing whether the mean of Population 1 is less than the mean of Population 2, the cutoff t score is negative. Decide which significance level you will use. Find the column labeled with the significance level you are using. Go down to the row for the appropriate degrees of freedom. If your study has degrees of freedom between two of the higher values on the table, you should use the degree of freedom that is nearest to yours and less than yours.
How Are You Doing? How does a sample’s variance differ from the population’s? How do we adjust for bias when estimating the population variance? What does N – 1 represent? What is a t distribution? What is a t score? How is a t score calculated?
t Tests in Research Articles Results from t tests are generally reported in the following format: t (df) = x. xx, p <. 05 x. xx represents the t score. Commonly, the significance level will be set at p <. 05, but it is also often set at p <. 01. It is rare to see a study that uses a t test for a single sample. Often a t test for dependent means will be given in the text, but sometimes results are reported in a table format.
Key Points When you have to estimate the population variance from scores in a sample, you will use a formula that divides the sum of square deviation scores by the degrees of freedom. With an estimated population variance, the comparison distribution is a t distribution; it is close to normal, but varies depending on the associated degrees of freedom. A t score is a sample’s number of deviations from the mean of the comparison distribution this is used in situation when the population variance is estimated. A t test for a single sample is used when the population mean is known but the population variance is unknown.