Introduction to Statistics Why Statistics Autism rates have


 � Solution a. Shades of paint")

 �Solution a. Temperatures could be measured")
 d. Heights are measurements and again,")


")


- Slides: 46
Introduction to Statistics!
Why Statistics? • Autism rates have increased dramatically in the last decade. • Dr. Andrew Wakefield published a study that showed a link between autism and a certain immunization vaccine. • Vaccination rates have dropped to a dangerous low as a result.
Immunization? ? • Dr. Andrew Wakefield’s research was a fraud. • He had altered or misrepresented the medical histories of his sample patients. (For financial gain from attorneys eager to sue vaccine manufacturers) • He is no longer allowed to practice medicine. • Let’s learn how to properly design a study!!
�A population is a particular group of interest. Getting Started �A variable is a value or characteristic that changes among members of the population. �Data are the counts, measurements, or observations gathered about a specific variable in a population in order to study it.
�A parameter is a numerical description of a Getting Started population characteristic. �A sample is a subset of the population from which data are collected. �Sample statistics are numerical descriptions of sample characteristics.
Population vs. Sample Getting Started Population Sample Whole group Part of the group Group we want to know about Group we do know about Characteristics are called parameters statistics Parameters are generally Statistics are always known unknown Statistics change with the Parameters are fixed sample
Branches of Statistics �The branch of descriptive statistics, as a science, gathers, sorts, summarizes, and displays the data. �The branch of inferential statistics, as a science, involves using descriptive statistics to estimate population parameters.
Data Classification �Qualitative data consist of labels or descriptions of traits. �Quantitative data consist of counts or measurements. �Continuous data are quantitative data that can take on any value in a given interval and are usually measurements. �Discrete data are quantitative data that can take on only particular values and are usually counts.
Qualitative Data �qualitative data can consist of just labels or names �qualitative data can be arranged in a meaningful order, but calculations such as addition or division do not make sense.
Classifying Data as Qualitative or Quantitative �Classify the following data as either qualitative or quantitative. a. Shades of red paint in a home improvement store b. Rankings of the most popular paint colors for the season c. Amount of red primary dye necessary to make one gallon of each shade of red paint d. Numbers of paint choices available at several stores
Classifying Data as Qualitative or Quantitative (cont. ) � Solution a. Shades of paint are descriptions and cannot be measured, so these are qualitative data. b. Rankings are numeric but not measurements or counts, so these are qualitative data. c. The amounts of dye needed are measured and therefore are quantitative data. d. The numbers of paint choices must be counted, so they are quantitative data as well.
Classifying Quantitative Data as Continuous or Discrete �Determine whether the following data are continuous or discrete. a. Temperatures in Fahrenheit of cities in South Carolina b. Numbers of houses in various neighborhoods in a city c. Numbers of elliptical machines in every YMCA in your state d. Heights of doors
Classifying Data as Continuous or Discrete (cont. ) �Solution a. Temperatures could be measured to any level of precision based on thermometer used, so these are continuous data. b. Numbers of houses are discrete data because houses are counted in whole numbers. A house under construction is still a house. c. The numbers of elliptical machines are counts, so these are discrete data.
Classifying Data as Continuous or Discrete (cont. ) d. Heights are measurements and again, depending on the ruler, the heights could be measured to any level of precision, so they are continuous data.
Displaying data
Pictograph
BAR GRAPH
BAR GRAPH
BAR GRAPH
HISTOGRAM
STEM AND LEAF PLOT
STEM AND LEAF PLOT
STEM AND LEAF PLOT
CIRCLE GRAPH (PIE CHART)
LINE GRAPH
LINE GRAPH – Bad example
LINE GRAPH – bad example
DOT PLOT
SCATTERPLOT
SCATTERPLOT
Activity �Get in groups of 8 -10. �Take your pulse for 60 seconds. �Do 2 mins of exercise (run in place, run out of the classroom, jumping jacks, push-ups) �Take your pulse for 60 seconds. �Record your groups data in a double sided stem-andleaf plot. �Display your data using some other type of graph.
Abuses of Statistics
�If you torture data long enough, they’ll admit to anything. �“Some people use statistics as a drunken man uses lampposts--for support rather than illumination, ” Andrew Lang
Inappropriate use of Statistics ADT Security Systems advertised that “when you go on vacation, burglars go to work. ” Their ad stated that “according to FBI statistics, over 26% of home burglaries take place between Memorial Day and Labor Day. ”
A New York Times editorial criticized a chart caption that described a dental rinse as one that “reduces plaque on teeth by over 300%.
Study: The National Safety Council informs us that nearly half of the auto fatalities occur at speeds of 40 mph or less and that 65% of all accidents occur within 25 miles of home. Conclusion: Speed makes little difference for fatalities and it is safer to drive while on an out-of-town vacation than to the corner market.
A daily newspaper ran a survey by asking readers to call in their response to this question: “Do you support the development of atomic weapons that could kill millions of innocent people?
The Newport Chronicle claims that pregnant mothers can increase their chances of having healthy babies by eating lobsters. That claim is based on a study showing that babies born to lobster-eating mothers have fewer health problems than babies born to mothers who don’t eat lobsters.
Study: A report of shark attacks off American beaches stated the attacks on males out numbered females 12: 1. Conclusion: Sharks are somehow attracted to men and/or repelled by women.
Google “Spurious Correlations”
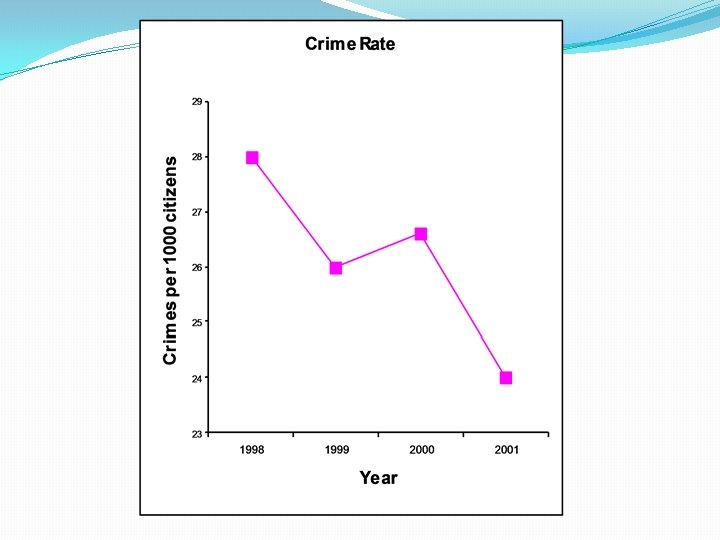
Misleading graphs �Mayor Marcus is running for a second term as Mayor against the challenger Councilwoman Claudia. One of the hot topics is crime prevention. Each of the graphs below displays crime statistics for the 4 years of Mayor Marcus’s current term. What are the differences between the two graphs? Depending on which candidate you are, which graph would you chose to make your point?
�The annual whole milk consumption in the US in 1986 was 112. 9 pounds person. In 2005, the consumption dropped to 57. 3 pounds person; about half. The pictograph at the right is a display of that change. Is it an accurate representation of the data? Explain.
Ways to Skew Data �Bad samples �Small or self-selected �Loaded questions �Correlation and causality �Unclear percentages �Missing data �Misleading graphs