Introduction to Statistics RCS 6740 51904 Statistics and


 – Range • Calculated by subtracting the")


- Slides: 21
Introduction to Statistics RCS 6740 5/19/04
Statistics and Research Design ¬ Statistics: Theory and method of analyzing quantitative data from samples of observations … to help make decisions about hypothesized relations. – Tools used in research design ¬ Research Design: Plan and structure of the investigation so as to answer the research questions (or hypotheses)
Statistics and Research Design ¬ Analogy: – Research design is the blueprint of the study. – In quantitative designs, statistical design and procedures are the craft and tools used to conduct quantitative studies. – The logic of hypothesis testing is the decision-making process that links statistical design to research design.
Statistics ¬ There are two types of statistics – Descriptive Statistics: involve tabulating, depicting, and describing data – Inferential Statistics: predicts or estimates characteristics of a population from a knowledge of the characteristics of only a sample of the population
Descriptive Statistics Scales of Measurement – Nominal • No numerical or quantitative properties. A way to classify groups or categories. • Gender: Male and Female • Major: Rehab or Counselor Ed – Ordinal • Used to rank and order the levels of the variable being studied. No particular value is placed between the numbers in the rating scale. • Movie Ratings: 4 Stars, 3 Stars, 2 Stars, and 1 Star
Descriptive Statistics Scales of Measurement Cont. – Interval • Difference between the numbers on the scale is meaningful and intervals are equal in size. NO absolute zero. • Allows for comparisons between things being measured • Temperatures on a thermometer: The difference between 60 and 70 is the same as the difference between 90 and 100. You cannot say that 70 degrees is twice as hot as 35 degrees, it is only 35 degrees warmer. – Ratio • Scales that do have an absolute zero point than indicated the absence of the variable being studied. Can form ratios. • Weight: 100 pounds is ½ of 200. • Time
Descriptive Statistics ¬ Frequency Distributions – In tables, the frequency distribution is constructed by summarizing data in terms of the number or frequency of observations in each category, score, or score interval – In graphs, the data can be concisely summarized into bar graphs, histograms, or frequency polygons
Descriptive Statistics – Normal Curve – Bimodal Curve
Descriptive Statistics – Positively Skewed – Negatively Skewed
Descriptive Statistics ¬ Measures of Central Tendency – Mode • The most frequently occurring score • 3 3 3 4 4 4 5 5 5 6 6: Mode is 6 • 3 3 3 4 4 4 5 5 6 6 7 7 8: Mode is 3 and 4 – Median • The score that divides a group of scores in half with 50% falling above and 50% falling below the median. • 3 3 3 5 8 8 8: The median is 5 • 3 3 5 6: The median is 4 (Average of two middle numbers) – Mean • Preferred whenever possible and is the only measure of central tendency that is used in advanced statistical calculations: – More reliable and accurate – Better suited to arithmetic calculations • Basically, and average of all scores. Add up all scores and divide by total number of scores. • 2 3 4 6 10: Mean is 5 (25/5)
Descriptive Statistics ¬ Measures of Central Tendency – Your Turn! – Mode • Example: 2 3 4 4 4 6 8 9 10 11 11 – Median • Example: 2 3 4 4 4 6 8 9 10 11 11 – Mean • Example: 2 3 4 4 4 6 8 9 10 11 11
Descriptive Statistics ¬ Measures of Variability (Dispersion) – Range • Calculated by subtracting the lowest score from the highest score. • Used only for Ordinal, Interval, and Ratio scales as the data must be ordered – Example: 2 3 4 6 8 11 24 (Range is 22) – Variance • The extent to which individual scores in a distribution of scores differ from one another – Standard Deviation • The square root of the variance • Most widely used measure to describe the dispersion among a set of observations in a distribution.
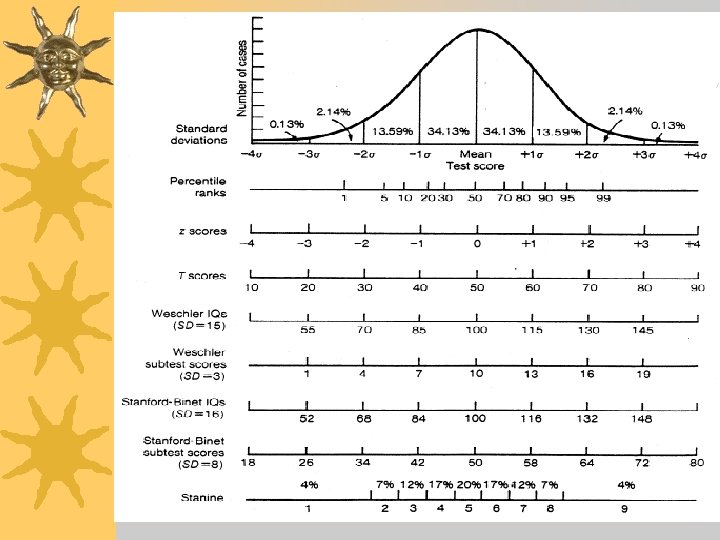
Descriptive Statistics ¬ Standard Scores: Z-Scores and T-Scores – Z-Scores • Most widely used standard score in statistics • A Z score of 1. 5 means that the score is 1. 5 standard deviations above the mean; a Z score of -1. 5 means that the score is 1. 5 standard deviations below the mean • Always have the same meaning in all distributions • To find a percentile rank, first convert to a Z score and then find percentile rank off a normal-curve table
Descriptive Statistics ¬ Standard Scores: Z-Scores and T-Scores – T-Scores • Most commonly used standard score for reporting performance • May be converted from Z-scores and are always rounded to two figures; therefore, eliminating decimals • Always reported in positive numbers • The mean is always 50 and the standard deviation is always 10
Descriptive Statistics ¬ Correlation or Covariation – A correlation coefficient is a statistical summary of the degree or magnitude and direction of the relationship or association between two variables – It is possible to have a negative or positive correlation ¬ Linear Regression – The purpose of a regression equation is to make predictions on a new sample of observations from the findings on a previous sample
Inferential Statistics ¬ Types of Samples and Sampling – We will discuss this on June 7 th ¬ Interval Estimate – A range or band within which the parameter is thought to lie, instead of a single point or value as the estimate of the parameter
Inferential Statistics ¬ Sampling Distributions – The sampling distribution of the mean is a frequency distribution, not of observations, but of means of samples, each based on n observations. – The standard error of the mean is used as an estimate of the magnitude of sampling error. It is the standard deviation of the sampling distribution of the sample means.
Inferential Statistics ¬ Confidence Intervals – Same as the percentage of cases in a normal distribution that lie within 1, 2, or 3 standard deviations from the mean ¬ Central Limit Theorem – States that the distribution of samples (means, medians, variances, and most other statistical measures) approaches a normal distribution as the sample size, n, increases ¬ Hypothesis Testing – will cover June 2 nd
Inferential Statistics ¬ Types of Statistical Analysis - Descriptive – Quantify the degree of relationship between variables – Parametric tests are used to test hypotheses with stringent assumptions about observations • t-test, ANOVA – Nonparametric tests are used with data in a nominal or ordinal scale • Chi-Square, Mann-Whitney U, Wilcoxon
Inferential Statistics ¬ Types of Statistical Analysis - Inferential – Allow generalization about populations using data from samples – The test for nominal data is the Chi-Square test – The tests for ordinal data are the Kolmogorov test, the Kolmogorov Smirnov test, the Mann-Whitney U test, and the Wilcoxon Matched-Pairs Signed-Ranks test – The tests for interval and ratio data include the t-test, ANOVA, ANCOVA, and Post-Hoc ANOVA tests