Introduction to Statistics for the Social Sciences SBS

Introduction to Statistics for the Social Sciences SBS 200, COMM 200, GEOG 200, PA 200, POL 200, or SOC 200 Lecture Section 001, Fall 2015 Room 150 Harvill Building 10: 00 - 10: 50 Mondays, Wednesdays & Fridays. http: //courses. eller. arizona. edu/mgmt/delaney/d 15 s_database_weekone_screenshot. xlsx

Homework Assignment Go to D 2 L - Click on “Interactive Online Homework Assignments” Assignment 8 HW 8 -Normal Curve, z scores and probabilities Due: Monday, October 2 nd

Hand out z tables

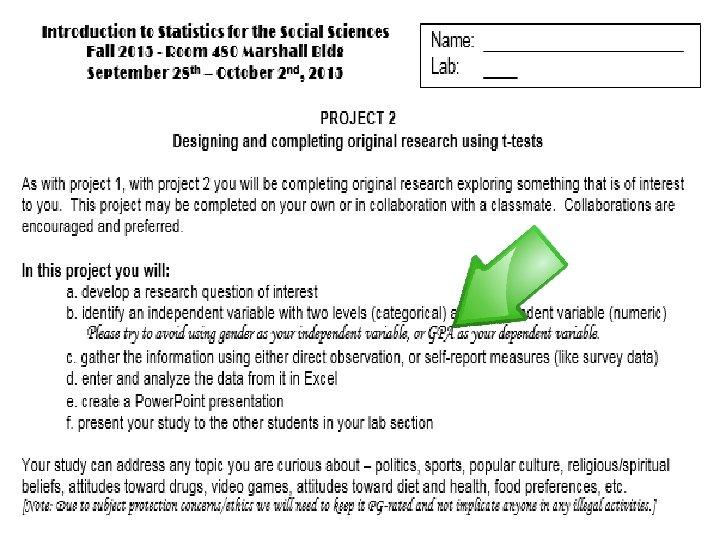
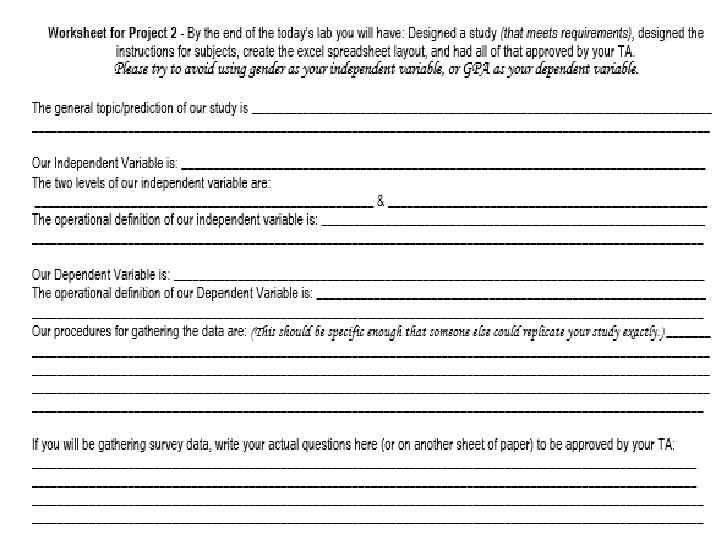
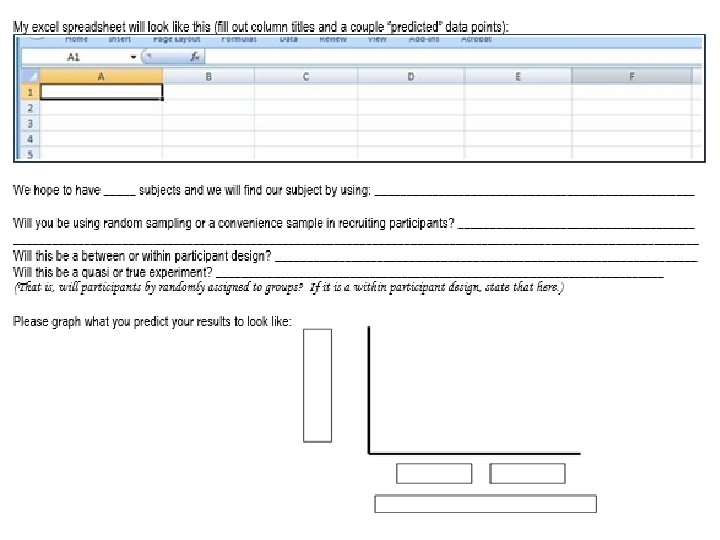
Everyone will want to be enrolled in one of the lab sessions Labs continue this week, Project 1


More information on registering clickers coming soon

By the end of lecture today 9/30/15 Counting ‘standard deviationses’ – z scores Connecting raw scores, z scores and probability Connecting probability, proportion and area of curve Percentiles
 Please read chapters 1 -")
Schedule of readings Before next exam (October 16 th) Please read chapters 1 - 8 in Open. Stax textbook Please read Chapters 10, 11, 12 and 14 in Plous Chapter 10: The Representativeness Heuristic Chapter 11: The Availability Heuristic Chapter 12: Probability and Risk Chapter 14: The Perception of Randomness

z= -1 68% If we go up one standard deviation 1 + z score = +1. 0 and raw score = 105 z= If we go down one standard deviation z score = -1. 0 and raw score = 95 85 90 95 100 105 110 115 z= -2 95% z= 85 90 95 100 105 110 115 z= -3 99. 7% 85 90 95 100 105 110 115 If we go up two standard deviations 2 z score = +2. 0 and raw score = 110 + If we go down two standard deviations z score = -2. 0 and raw score = 90 If we go up three standard deviations z score = +3. 0 and raw score = 115 +3 z = If we go down three standard deviations z score = -3. 0 and raw score = 85 z score: A score that indicates how many standard deviations an observation is above or below the mean of the distribution z score = raw score - mean standard deviation Mean = 100 Standard deviation = 5

Scores, standard deviations, and probabilities Actually 95. 44 To be exactly 95% we will use z = 1. 96 Actually 68. 26

Scores, standard deviations, and probabilities The normal curve always has the same shape. They differ only by having different means and standard deviation

Scores, standard deviations, and probabilities What is total percent under curve? 100% What proportion of curve is above the mean? . 50 The normal curve always has the same shape. They differ only by having different means and standard deviation

Scores, standard deviations, and probabilities What percent of curve is below a score of 50? 50% Mean = 50 Standard deviation = 10 What score is associated with 50 th percentile? median

Scores, standard deviations, and probabilities What percent of curve is below a score of 100? 50% Mean = 100 Standard deviation = 5 What score is associated with 50 th percentile? median
 Raw")
Raw scores, z scores & probabilities convert Distance from the mean (z scores) Raw Scores (actual data) We care about this! Proportion of curve (area from mean) 68% z = -1 z=1 What is the actual number on this scale? “height” vs “weight” “pounds” vs “test score” convert z = -1 We care about this! “percentiles” “percent of people” “proportion of curve” “relative position” 68% Raw Scores (actual data) convert z=1 Proportion of curve (area from mean) Distance from the mean convert (z scores)

Findzzscore: score A score that indicates how many standard deviations observation is above or below the mean of the distribution for rawan score of 60 z-table Distance from the mean z score = raw score - mean standard deviation ( from raw to z scores) Raw Scores (actual data) 60 10 50 (from z to area) Proportion of curve (area from mean) z=1 Mean = 50 Standard deviation = 10

Findzzscore: score A score that indicates how many standard deviations observation is above or below the mean of the distribution for rawan score of 30 z-table Distance from the mean z score = raw score - mean standard deviation ( from raw to z scores) Raw Scores (actual data) 30 10 50 (from z to area) Proportion of curve (area from mean) z=-2 Mean = 50 Standard deviation = 10
")
Raw scores, z scores Find z score & probabilities z-table (from z to area) Distance from the mean ( from raw to z scores) for raw score of 70 Raw Scores (actual data) Proportion of curve (area from mean) If we go up to score of 70 we are going up 2. 0 standard deviations Then, z score = +2. 0 z score = raw score - mean standard deviation z score = Mean = 50 Standard deviation = 10 70 – 50 10 . = 2

Findzzscore: score A score that indicates how many standard deviations observation is above or below the mean of the distribution for rawan score of 80 z score = raw score - mean standard deviation Distance from the mean ( from raw to z scores) Raw Scores (actual data) 80 10 50 z-table (from z to area) Proportion of curve (area from mean) z=3 Mean = 50 Standard deviation = 10

Find z score Raw for raw score of 20 scores, z scores & probabilities z-table (from z to area) Distance from the mean ( from raw to z scores) Raw Scores Proportion of curve (actual data) (area from mean) If we go down to score of 20 we are going down 3. 0 standard deviations Then, z score = -3. 0 z score = raw score - mean standard deviation z score = Mean = 50 Standard deviation = 10 20 – 50 10 = - 30 10 . =-3

Normal distribution Raw scores z-scores Have z Find raw score Formula probabilities Z Scores z table Have z Find area Have area Find z Have raw score Find z Raw Scores Area & Probability

Hand out z tables

Draw picture of what you are looking for. . . Find z score (using formula). . . Look up proportions on table Ties together z score with • • probability proportion percent area under the curve 68% 34%
 Draw")
Find the area under the curve that falls between 50 and 60 1) Draw the picture 2) Find z score 3) Go to z table - find area under correct column 4) Report the area 60 50 10 Distance from the mean ( from raw to z scores) Raw Scores (actual data) z=1 z-table (from z to area) Proportion of curve (area from mean) 34. 13% 50 60

Mean = 50 Standard deviation = 10 Find the area under the curve that falls between 40 and 60 z score = 68. 26% 34. 13% raw score - mean standard deviation Hint always draw a picture! z score = 60 - 50 10 z score = 40 - 50 10 z score = 10 = 1. 0 10 z score = z table 10 = -1. 0 10 z table z score of 1 = area of. 3413 +. 3413 =. 6826
 Draw the picture Standard deviation 2) Find z score 3) Go to")
Mean 1) Draw the picture Standard deviation 2) Find z score 3) Go to z table - find area under correct column 4) Report the area = 50 = 10 Find the area under the curve that falls between 30 and 50 z score = raw score - mean standard deviation Distance from the mean ( from raw to z scores) z score = 30 - 50 10 - 20 10 Raw Scores (actual data) z-table (from z to area) Proportion of curve (area from mean) = - 2. 0 Hint always draw a picture!
 Draw the picture Standard deviation 2) Find z score 3) Go to")
Mean 1) Draw the picture Standard deviation 2) Find z score 3) Go to z table - find area under correct column 4) Report the area = 50 = 10 47. 72% Find the area under the curve that falls between 30 and 50 z score = raw score - mean standard deviation 30 - 50 10 - 20 10 = - 2. 0 z table z score of - 2 = area of. 4772 Hint always draw a picture!

Mean = 50 Standard deviation = 10 Let’s do some problems 47. 72% Find the area under the curve that falls between 70 and 50 z score = raw score - mean standard deviation 70 - 50 10 20 = +2. 0 10 z table z score of 2 = area of. 4772 Hint always draw a picture!

Mean = 50 Standard deviation = 10. 4772 Let’s do some problems . 4772 95. 44% z score of 2 = area of. 4772 Find the area under the curve that falls between 30 and 70. 4772 +. 4772 =. 9544 Distance from the mean ( from raw to z scores) Raw Scores (actual data) z-table (from z to area) Proportion of curve (area from mean) Hint always draw a picture!

Scores, standard deviations, and probabilities Actually 95. 44 To be exactly 95% we will use z = 1. 96 Actually 68. 26

Mean = 50 Standard deviation = 10 Writing Assignment Let’s do some problems

Mean = 50 Standard deviation = 10 Let’s do some problems Find the area under the curve that falls below 60 means the same thing as Find the percentile rank for score of 60 Pro 1 ble m ? 60

Mean = 50 Standard deviation = 10 Let’s do some problems ? Find the percentile rank for score of 60 . 5000 . 3413 60 Distance from the mean ( from raw to z scores) Raw Scores (actual data) 1) Find z score = 60 - 50 =1 10 2) Go to z table - find area under correct column (. 3413) z-table (from z to area) Proportion of curve (area from mean) 3) Look at your picture - add. 5000 to. 3413 =. 8413 4) Percentile rank or score of 60 = 84. 13% Pro 1 ble m Hint always draw a picture!

Mean = 50 Standard deviation = 10 ? Find the percentile rank for score of 75 . 4938 75 1) Find z score = 75 - 50 10 z score = 25 = 2. 5 10 2) Go to z table Pr ob lem 2 Hint always draw a picture!

Mean = 50 Standard deviation = 10 ? Find the percentile rank for score of 75 . 5000. 4938 75 1) Find z score = 75 - 50 10 z score = 25 = 2. 5 10 2) Go to z table 3) Look at your picture - add. 5000 to. 4938 =. 9938 4) Percentile rank or score of 75 = 99. 38% lem Hint always draw a picture! Pro b 2

- Slides: 41