Introduction to Statistics for the Social Sciences SBS

Introduction to Statistics for the Social Sciences SBS 200 - Lecture Section 001, Fall 2018 Room 150 Harvill Building 10: 00 - 10: 50 Mondays, Wednesdays & Fridays. 10/3/18 http: //www. youtube. com/watch? v=o. SQJP 40 Pc. GI

Screen Alyson Lecturer’s desk Row A Chris Row C Row B Row A 15 14 12 11 10 13 20 Row B 19 24 23 22 21 Row C 20 19 28 27 26 25 24 23 Row D 22 21 20 19 30 29 28 27 26 25 24 23 Row E 23 22 21 20 19 35 34 33 32 31 30 29 28 27 26 Row F 25 35 34 33 32 31 30 29 28 27 26 Row G 37 36 35 34 33 32 31 30 29 28 41 40 39 38 37 36 35 34 33 32 31 30 25 Row D Row E Row F Row G Row H Row L 33 31 29 23 22 21 Tr ey 21 8 7 6 5 Row A 2 1 3 2 Row B 8 7 6 5 4 12 11 10 9 8 7 6 5 4 3 2 1 24 23 22 21 20 19 18 17 16 15 14 13 12 11 10 9 8 7 6 5 4 3 2 25 24 23 22 21 20 19 18 17 16 15 14 13 12 11 10 9 8 7 6 5 4 3 2 Row H 27 26 25 24 23 22 21 20 19 18 17 16 15 14 13 12 29 Row J 28 27 26 25 24 23 22 21 20 19 18 17 16 15 14 13 12 11 10 9 8 7 6 5 4 3 2 1 Row J 29 Row K 28 27 26 25 24 23 22 21 20 19 18 17 16 15 14 13 12 11 10 9 8 7 6 5 4 3 2 1 Row K 25 Row L 24 23 22 21 20 19 18 17 16 15 14 13 12 11 10 9 20 19 Row M 18 4 3 Row N 15 14 13 12 11 10 9 8 7 6 5 4 3 2 1 Row P 15 14 13 12 11 10 9 8 7 6 5 4 3 2 1 4 3 18 17 18 16 17 15 16 18 14 15 17 18 13 14 13 16 17 12 11 10 15 16 14 15 13 12 11 10 14 17 16 15 14 13 12 11 10 9 13 8 7 6 5 table 14 13 12 11 10 9 8 7 6 Projection Booth Harvill 150 renumbered 3 4 9 32 31 30 29 28 27 26 Row M 9 5 2 1 1 Row C Row D Row E o Fl 1 Row F 1 Row G 11 10 9 8 7 6 5 4 3 2 2 1 1 1 Row L Row M Jun 1 Left handed desk Row H

The Gre e She n ets
 Please read chapters 1 -")
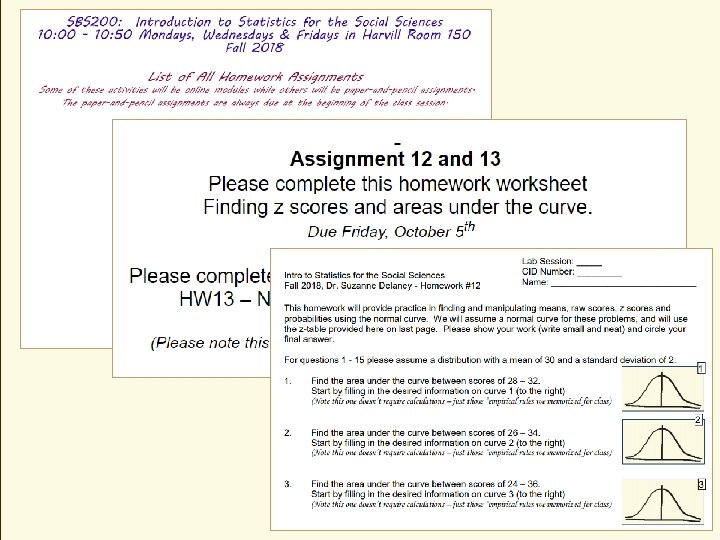
Schedule of readings Before next exam (October 12 th) Please read chapters 1 - 8 in Open. Stax textbook Please read Chapters 10, 11, 12 and 14 in Plous Chapter 10: The Representativeness Heuristic Chapter 11: The Availability Heuristic Chapter 12: Probability and Risk Chapter 14: The Perception of Randomness

s t s e t - cel t s x b E a L ith w

Hand out z tables

Normal distribution Raw scores z-scores Have z Find raw score Formula probabilities Z Scores z table Have z Find area Have area Find z Have raw score Find z Raw Scores Area & Probability

Mean = 50 Standard deviation = 10 Writing Assignment Let’s do some problems 2 he t t r a e u P n Conti ignment – ss A g n ti i r 4 W m e l e b r Pro z-sco

Mean = 50 Standard deviation = 10 Find the percentile rank for score of 45 45 1) Find z score = 45 - 50 10 z score = - 5 = -0. 5 10 2) Go to z table Pro b 3 lem ?

Mean = 50 Standard deviation = 10 Find the percentile rank for score of 45. 1915 ? 45 1) Find z score = 45 - 50 10 z score = - 5 = -0. 5 10 2) Go to z table Pro b 3 lem ?

Mean = 50 Standard deviation = 10 Find the percentile rank for score of 45. 1915 . 3085 45 1) Find z score = 45 - 50 10 z score = - 5 = -0. 5 10 2) Go to z table 3) Look at your picture - subtract. 5000 -. 1915 =. 3085 Pro b 3 lem 4) Percentile rank or score of 45 = 30. 85% ?

Mean = 50 Standard deviation = 10 Find the percentile rank for score of 55 55 1) Find z score = 55 - 50 10 z score = 5 = 0. 5 10 2) Go to z table Pro b 4 lem ?

Mean = 50 Standard deviation = 10 Find the percentile rank for score of 55 . 1915 55 1) Find z score = 55 - 50 10 z score = 5 = 0. 5 10 2) Go to z table Pro b 4 lem ?

Mean = 50 Standard deviation = 10 Find the percentile rank for score of 55 . 1915. 5 55 1) Find z score = 55 - 50 10 z score = 5 = 0. 5 10 2) Go to z table 3) Look at your picture - add. 5000 +. 1915 =. 6915 Pro b 4 lem 4) Percentile rank or score of 55 = 69. 15% ?

Mean = 50 Standard deviation = 10 Find the score for z = -2 Find the score that is associated with a z score of -2 3? 0 Hint always draw a picture! raw score = mean + (z score)(standard deviation) Raw score = 50 + (-2)(10) Raw score = 50 + (-20) = 30 Please note: When we are looking for the score from proportion we use the z-table ‘backwards’. We find the closest z to match our proportion

Find the score for percentile rank of 77%ile Mean = 50 Standard deviation = 10 . 7700 ? Pro b 5 lem Please note: When we are looking for the score from proportion we use the z-table ‘backwards’. We find the closest z to match our proportion ?

Find the score for percentile rank of 77%ile. 5 Mean = 50 Standard deviation = 10 . 27. 5 ? . 5 +. 27 =. 77. 27 . 7700 ? Pro b 5 1) Go to z table - find z score for area. 2700 (. 7700 -. 5000) =. 27 area =. 2704 (closest I could find to. 2700) z = 0. 74 lem Please note: When we are looking for the score from proportion we use the ztable ‘backwards’. We find the closest z to match our proportion

Find the score for percentile rank of 77%ile. 5 Mean = 50 Standard deviation = 10 . 27. 5 x = ? 57. 4 . 27 . 7700 ? 2) x = mean + (z)(standard deviation) x = 50 + (0. 74)(10) x = 57. 4 Pro b 5 lem Please note: When we are looking for the score from proportion we use the ztable ‘backwards’. We find the closest z to match our proportion

Find the score for percentile rank of 55%ile Mean = 50 Standard deviation = 10 ? . 5500 ? Pro b 6 lem Please note: When we are looking for the score from proportion we use the ztable ‘backwards’. We find the closest z to match our proportion

Find the score for percentile rank of 55%ile. 5 Mean = 50 Standard deviation = 10 . 05. 5 ? . 5 +. 05 =. 55. 05 . 5500 ? Pro b 7 1) Go to z table - find z score for area. 0500 (. 5500 -. 5000) =. 05 area =. 0517 (closest I could find to. 0500) z = 0. 13 lem Please note: When we are looking for the score from proportion we use the ztable ‘backwards’. We find the closest z to match our proportion

Find the score for percentile rank of 55%ile. 5 Mean = 50 Standard deviation = 10 . 05. 5 ? . 05 . 5500 ? Pro b 7 1) Go to z table - find z score for area. 0500 (. 5500 -. 5000) =. 05 area =. 0517 (closest I could find to. 0500) z = 0. 13 lem Please note: When we are looking for the score from proportion we use the ztable ‘backwards’. We find the closest z to match our proportion

Find the score for percentile rank of 55%ile. 5 Mean = 50 Standard deviation = 10 . 05. 5 ? x = 51. 3 . 05 . 5500 ? 1) Go to z table - find z score for area. 0500 (. 5500 -. 5000) =. 0500 area =. 0517 (closest I could find to. 0500) z = 0. 13 Pro b 2) x = mean + (z)(standard deviation) x = 50 + (0. 13)(10) x = 51. 3 7 lem Please note: When we are looking for the score from proportion we use the ztable ‘backwards’. We find the closest z to match our proportion

. 5 -. 13 =. 37 Find the score for percentile rank of 13%ile Mean = 50 Standard deviation = 10 . 3700 . 37. 13 . 5 x = 38. 7 ? . 1300 ? 1) Go to z table - find z score for area. 3700 (. 5000 -. 1300) =. 3700 area =. 3708 (closest I could find to. 3700) z = 1. 13 Pro b 2) x = mean + (z)(standard deviation) x = 50 + (-1. 13)(10) x = 38. 7 8 lem Please note: When we are looking for the score from proportion we use the ztable ‘backwards’. We find the closest z to match our proportion

. 5 -. 13 =. 37 Find the score for percentile rank of 13%ile Mean = 50 Standard deviation = 10 . 3700 . 37. 13 . 5 x = 38. 7 ? . 1300 ? 1) Go to z table - find z score for area. 3700 (. 5000 -. 1300) =. 3700 area =. 3708 (closest I could find to. 3700) z = 1. 13 Pro b 2) x = mean + (z)(standard deviation) x = 50 + (-1. 13)(10) x = 38. 7 8 lem Please note: When we are looking for the score from proportion we use the ztable ‘backwards’. We find the closest z to match our proportion

Mean = 500 Standard deviation = 100 Let’s do some problems ? Find the percentile rank for score of 600 . 5000 . 3413 600 1) Find z score = 600 - 500 =1 100 2) Go to z table - find area under correct column (. 3413) 3) Look at your picture - add. 5000 to. 3413 =. 8413 4) Percentile rank or score of 600 = 84. 13% Pro 9 ble m Hint always draw a picture!

Mean = 500 Standard deviation = 100 ? Find the percentile rank for score of 750 . 4938 750 1) Find z score = 750 - 500 100 z score = 250 = 2. 5 100 2) Go to z table Pr ob l 10 em Hint always draw a picture!

Mean = 500 Standard deviation = 100 ? Find the percentile rank for score of 750 . 5000. 4938 750 1) Find z score = 750 - 500 100 z score = 250 = 2. 5 100 2) Go to z table 3) Look at your picture - add. 5000 to. 4938 =. 9938 Pro 4) Percentile rank or score of 750 = 99. 38% m Hint always draw a picture! 1 ble 0

Mean = 500 Standard deviation = 100 Find the percentile rank for score of 450 1) Find z score = 450 - 500 100 z score = - 50 = -0. 5 100 2) Go to z table Pro ble m 11 ?

Mean = 500 Standard deviation = 100 Find the percentile rank for score of 450. 1915 ? 450 1) Find z score = 450 - 500 100 z score = - 50 = -0. 5 100 2) Go to z table Pro ble 11 m ?

Mean = 500 Standard deviation = 100 Find the percentile rank for score of 450. 1915 . 3085 450 1) Find z score = 450 - 500 100 z score = - 50 = -0. 5 100 2) Go to z table 3) Look at your picture - subtract. 5000 -. 1915 =. 3085 Pro ble 4) Percentile rank or score of 450 = 30. 85% 11 m ?

Mean = 500 Standard deviation = 100 Find the percentile rank for score of 550 1) Find z score = 550 - 500 100 z score = 50 = 0. 5 100 2) Go to z table Pro ble 12 m ?

Mean = 500 Standard deviation = 100 Find the percentile rank for score of 550 . 1915 550 1) Find z score = 550 - 500 100 z score = 50 = 0. 5 100 2) Go to z table Pro ble 12 m ?

Mean = 500 Standard deviation = 100 Find the percentile rank for score of 550 . 1915. 5 550 1) Find z score = 550 - 500 100 z score = 50 = 0. 5 100 2) Go to z table 3) Look at your picture - add. 5000 +. 1915 =. 6915 Pro ble 12 m 4) Percentile rank or score of 550 = 69. 15% ?

Normal distribution Raw scores z-scores Have z Find raw score Formula probabilities Z Scores z table Have z Find area Have area Find z Have raw score Find z Raw Scores Area & Probability

- Slides: 38