Introduction to Statistics for the Social Sciences SBS

Introduction to Statistics for the Social Sciences SBS 200 - Lecture Section 001, Fall 2017 Room 150 Harvill Building 10: 00 - 10: 50 Mondays, Wednesdays & Fridays. http: //www. youtube. com/watch? v=o. SQJP 40 Pc. GI

Remember bring your writing assignment forms notebook and clickers to each lecture

• • Three tries Will show up in grades within 24 hours

Everyone will want to be enrolled in one of the lab sessions Labs continue Today
 Correlation (scatterplots) Comparing two means (bar graph)")
Project 1 Likert Scale (summated scale) Correlation (scatterplots) Comparing two means (bar graph)
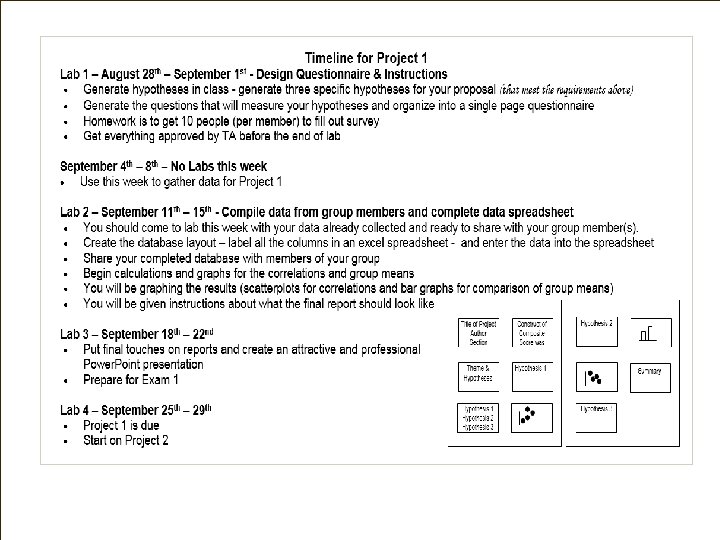
 Questions?")
Project 1 - Likert Scale - Correlations - Comparing two means (bar graph) Questions?

If you want to know if studying improves test performance in young children Break up group of kids into two groups Group 1 - studies & tested What is the independent variable? What is the dependent variable? How many levels are there of the IV? Is this a “quasi” or “true” experiment? “Between” or “within” participant design? Group 2 - does not study & tested

If you want to know if “Ginseng drink” is associated with feelings of satisfaction What is the independent variable? First test group with placebo drink (sugar pill) What is the dependent variable? How many levels are there of the IV? “Between” or “within” participant design? Placebo Then test same group with “Ginseng drink”
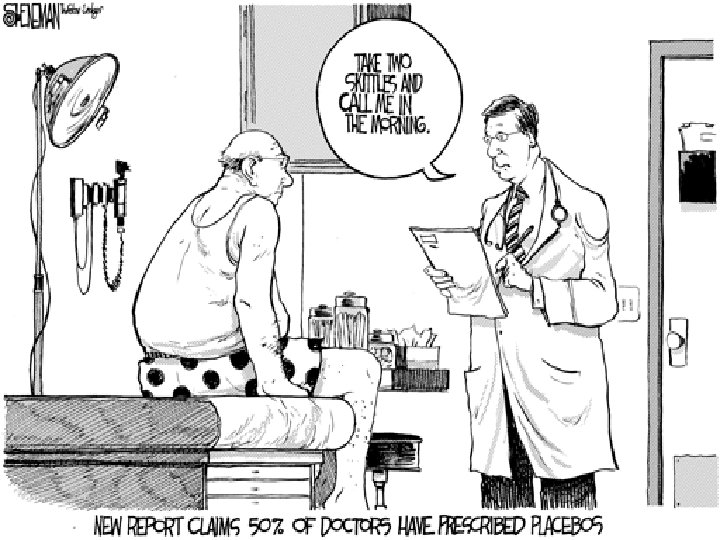
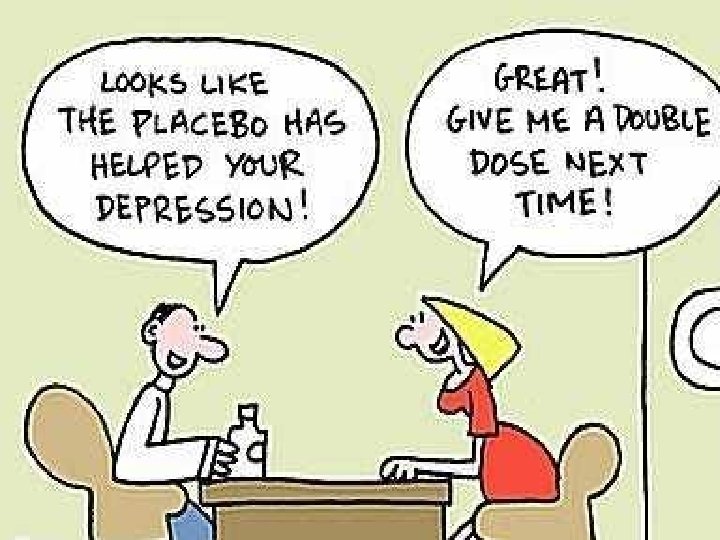
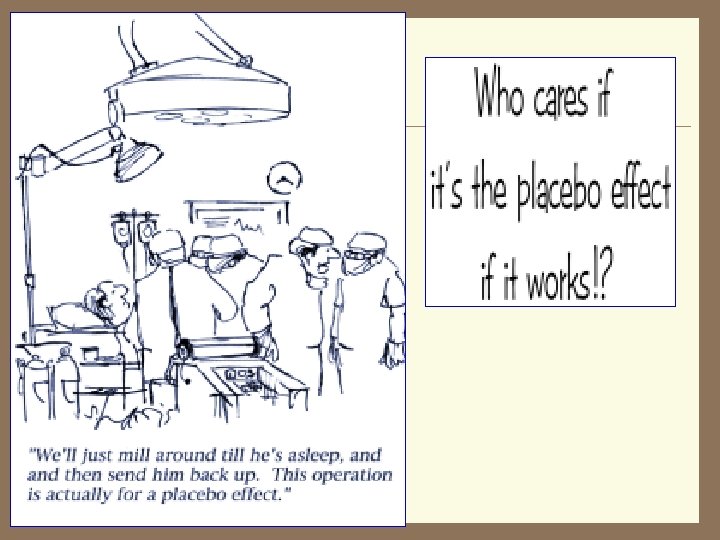

 versus double blind procedure • Single blind procedure (example: use of")
Placebo (single blind) versus double blind procedure • Single blind procedure (example: use of placebo) • Double blind procedure What about experimenter bias?

Continuous versus discrete Continuous variable: Variables that can assume any value. There are (in principle) an infinite number of values between any two numbers Discrete variable: Variables that can only assume whole numbers. There are no intermediate values between the whole numbers Duration Number of eggs in a carton Amount of milk in a glass Amount of sand Height Number of cookies on a plate Distance to the moon Grains of sand Number of kids in classroom Number of textbooks required for class
 - a set of")
Categorical versus Numerical data Categorical data (also called qualitative data) - a set of observations where any single observation is a word or a number that represents a class or category Numerical data (also called quantitative data) - a set of observations where any single observation is a number that represents an amount or count
 - a set of observations where any single")
Categorical data (also called qualitative data) - a set of observations where any single observation is a word or a number that represents a class or category Numerical data (also called quantitative data) - a set of observations where any single observation is a number that represents an amount or count Handedness - right handed or left handed Family size Hair color GPA Ethnic group Age (Time since birth) Breed of dog Temperature (Kelvin) Yearly salary Temperature (Fahrenheit) Gender - male or female Please note this is a binary variable
 - a set of observations where any single")
Categorical data (also called qualitative data) - a set of observations where any single observation is a word or a number that represents a class or category Numerical data (also called quantitative data) - a set of observations where any single observation is a number that represents an amount or count On a the top half of a writing assignment form please generate two examples of categorical data and two examples of numerical data Please note we’ll use the bottom half for something else

What are the four “levels of measurement”? Ratio ute Absol o zer s c insi Intr ring e ord e gori e t a C es Nam Most ric nume s d Unit l l size s a u u f Eq erval ning a e int m s c insi r t n I g erin ord ries st Lea ric e num rie tego Ca es ego Nam Cat aching Appro ric Nume est ak We Interval Ordinal Nominal

What are the four “levels of measurement”? Categorical data • Nominal data - classification, differences in kind, names of categories • Ordinal data - order, rankings, differences in degree Numerical data • Interval data - measurable differences in amount, equal intervals • Ratio data - measurable differences in amount with a “true zero” Gender - male or female Family size Jersey number Place in a foot race (1 st, 2 nd, 3 rd, etc) Handedness - right handed or left handed

What are the four “levels of measurement”? Categorical data • Nominal data - classification, differences in kind, names of categories • Ordinal data - order, rankings, differences in degree Numerical data • Interval data - measurable differences in amount, equal intervals • Ratio data - measurable differences in amount with a “true zero” Age Ethnic group Temperature Yearly salary Hair color Telephone number Breed of dog

Please note : page 29 in text
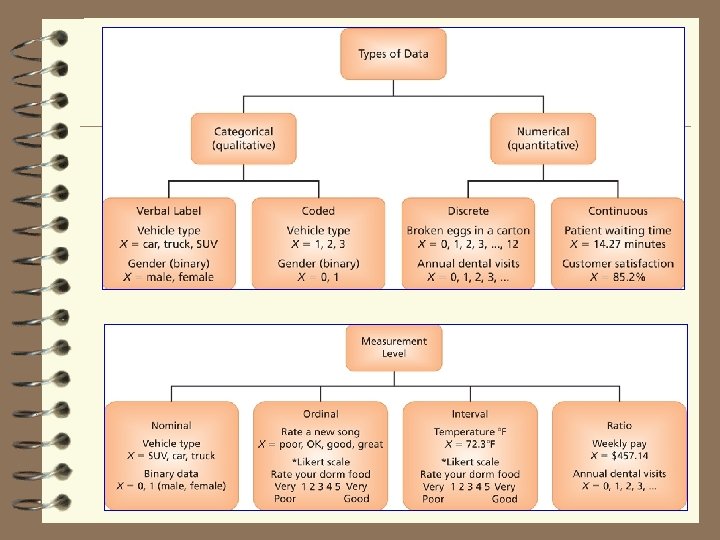

What are the four “levels of measurement”? Categorical data • Nominal data - classification, differences in kind, names of categories • Ordinal data - order, rankings, differences in degree Numerical data • Interval data - measurable differences in amount, equal intervals • Ratio data - measurable differences in amount with a “true zero” Look at your examples of qualitative and quantitative data. Which levels of measurement are they?

- Slides: 26