Introduction to Statistics for the Social Sciences SBS

Introduction to Statistics for the Social Sciences SBS 200 - Lecture Section 001, Fall 2016 Room 150 Harvill Building 10: 00 - 10: 50 Mondays, Wednesdays & Fridays. http: //www. youtube. com/watch? v=o. SQJP 40 Pc. GI

Everyone will want to be enrolled in one of the lab sessions No Labs this week
 Please read chapters 1 -")
Schedule of readings Before next exam (September 23 rd) Please read chapters 1 - 5 in Open. Stax textbook Please read Appendix D, E & F online On syllabus this is referred to as online readings 1, 2 & 3 Please read Chapters 1, 5, 6 and 13 in. Plous Chapter 1: Selective Perception Chapter 5: Plasticity Chapter 6: Effects of Question Wording and Framing Chapter 13: Anchoring and Adjustment

Homework Assignment 4 Integrating Methodologies and Graphing with Excel Please print out and complete this homeworksheet And hand it in during class on Friday Due: Friday, September 9 th This worksheet can be found on our regular class website and printed out to be completed (not on D 2 L)

Use this as your study guide By the end of lecture today 9/7/16 Frequency distributions and Frequency tables Guidelines for constructing frequency distributions 1. Classes should be mutually exclusive 2. Set of classes should be exhaustive 3. All classes should have equal intervals 4. Selecting number of classes is subjective (5 -15 will often work) 5. Class width should be round (easy) numbers 6. Try to avoid open ended classes Cumulative Frequency Relative Frequency and percentages Predicting frequency of larger sample based on relative frequency Pie Charts Relative Cumulative Frequency

Let’s try one When Martiza was preparing her experiment, she knew it was important that the participants not know which condition they were in, to avoid bias from the subjects. This is called a _____ study. She also was careful that the experimenters who were interacting with the participants did not know which condition those participants were in. This is called a ____ study. a. between participant; within participant b. within participant; between participant c. double blind design; single blind d. single blind; double blind design

Let’s try one A measurement that has high validity is one that a. measures what it intends to measure b. will give you similar results with each replication c. will compare the performance of the same subjects in each experimental condition d. will compare the performance of different subjects in each experimental condition

Let’s try one A study explored whether conservatives or liberals had more bumper stickers on their cars. The researchers ask 100 activists to complete a conservative/liberal values test, then used those results to categorize them as liberal or conservative. Then they identified the 30 most conservative activists and the 30 most liberal activists and measured how many bumper stickers each activist had on their car. The independent variable in this study was a. the performance of the activists b. the number of bumper stickers found on their car c. political status of participant (liberal versus conservative) as c. determined by their performance on the liberal/conservative test d. whether or not the subjects had bumper stickers on their car

Let’s try one A study explored whether conservatives or liberals had more bumper stickers on their cars. The researchers asked 100 activists to complete a conservative/liberal values test, then used those results to categorize them as liberal or conservative. Then they identified the 30 most conservative activists and the 30 most liberal activists and measured how many bumper stickers each activist had on their car. The dependent variable in this study was a. the performance of the activists b. the number of bumper stickers found on their car b. c. political status of participant (liberal versus conservative) as determined by their performance on the liberal/conservative test d. whether or not the subjects had bumper stickers on their car

Let’s try one A study explored whether conservatives or liberals had more bumper stickers on their cars. The researchers 100 activists to complete a conservative/liberal values test, then used those results to categorize them as liberal or conservative. Then they identified the 30 most conservative activists and the 30 most liberal activists and measured how many bumper stickers each activist had on their car. This study was a a. within participant experiment b. between participant experiment b. c. mixed participant experiment d. non-participant experiment

Let’s try one A study explored whether conservatives or liberals had more bumper stickers on their cars. They had 100 activists complete liberal/conservative test. Then, they split the 100 activists into 2 groups (conservatives and liberals). They then measured how many bumper stickers each activist had on their car. This study used a a. true experimental design b. quasi-experiment design b. c. correlational design d. mixed design

Writing Assignment – Pop Quiz Ari conducted a watermelon seed spitting experiment. She wanted to know if people can spit farther if they get a running start. She tested 100 people. She randomly assigned them into one of two groups. One group stood still on the starting line and spit their watermelon seeds as far as they could. The second group was allowed to run up to the starting line before they spit their watermelon seeds. She measured how far each person spit their watermelon seeds. Please answer the following questions 1. What is the independent variable? 2. The independent variable: Is it continuous or discrete? 3. The independent variable: Is it nominal, ordinal, interval or ratio? 4. What is the dependent variable? 5. The dependent variable: Is it continuous or discrete? 6. The dependent variable: Is it nominal, ordinal, interval or ratio? 7. Is this a quasi or true experiment? 8. Is this a within or between participant design 9. Is this a single blind, double blind or not at all blind experiment? 10. Be sure to put your name and CID on this page

Writing Assignment – Pop Quiz Ari conducted a watermelon seed spitting experiment. She wanted to know if people can spit farther if they get a running start. She tested 100 people. She randomly assigned them into one of two groups. One group stood still on the starting line and spit their watermelon seeds as far as they could. The second group was allowed to run up to the starting line before they spit their watermelon seeds. She measured how far each person spit their watermelon seeds. Please answer the following questions Running versus 1. What is the independent variable? standing still rete 2. The independent variable: Is it continuous or discrete? Disc l Nomina e th t a th e 3. The independent variable: Is it nominal, ordinal, interval or ratio? Distanc it seed was sp 4. What is the dependent variable? us 5. The dependent variable: Is it continuous or discrete? Continuo 6. The dependent variable: Is it nominal, ordinal, interval or ratio? ment 7. Is this a quasi or true experiment? True Experi Rati o een w t e B 8. Is this a within or between participant design 9. Is this a single blind, double blind or not at all blind experiment? 10. Be sure to put your name and CID on this page Not a t all

You’ve gathered your data…what’s the best way to display it? ?

14 16 Lists of numbers 11 too hard to see 20 patterns 14 Describing Data Visually 11 16 11 8 11 14 14 8 12 14 10 9 12 15 10 13 15 11 13 16 11 14 16 17 25 21 28 16 14 12 14 17 18 17 13 17 17 18 18 18 19 20 27 19 16 8 17 25 16 19 23 20 15 20 20 20 21 21 22 23 24 25 18 24 13 17 19 9 18 24 12 25 11 25 25 27 28 29 21 16 20 17 17 24 20 22 15 11 Organizing numbers helps Graphical representation even more clear This is a dot plot 29 13 11 14 11 8 17

Describing Data Visually 8 8 9 10 11 11 11 12 12 13 13 14 14 We’ve got to put these data into groups (“bins”) 14 14 15 15 16 16 16 17 17 17 18 18 18 19 19 20 20 21 21 22 23 24 24 25 25 25 27 28 29 Measuring the “frequency of occurrence” Then figure “frequency of occurrence” for the bins

Frequency distributions an organized list of observations and their frequency of occurrence How many kids are in your family? What is the most common family size?

Another example: How many kids in your family? Number of kids in family 1 3 1 4 2 8 2 14 14 4 2 1 4 2 2 3 1 8

How many kids are in your family? What is the most common family size? Frequency distributions Crucial guidelines for constructing frequency distributions: Number of kids in family 1 3 1 4 2 8 2 14 1. Classes should be mutually exclusive: Each observation should be represented only once (no overlap between classes) Wrong 0 -5 5 - 10 10 - 15 Correct 0 -4 5 -9 10 - 14 Correct 0 - under 5 5 - under 10 10 - under 15 2. Set of classes should be exhaustive: Wrong Should include all possible data values 0 -4 (no data points should fall outside range) 8 - 11 12 - 15 No place for our families of 4, 5, 6 or 7 Correct 0 -3 4 -7 8 - 11 12 - 15

How many kids are in your family? What is the most common family size? Frequency distributions Crucial guidelines for constructing frequency distributions: Number of kids in family 1 3 1 4 2 8 2 14 3. All classes should have equal intervals (even if the frequency for that class is zero) Wrong 0 -1 2 - 12 14 - 15 Correct 0 -4 5 -9 10 - 14 Correct 0 - under 5 5 - under 10 10 - under 15

4. Selecting number of classes is subjective How about Generally 5 -15 will often work 6 classes? (“bins”) How about 8 classes? (“bins”) 8 8 9 10 11 11 11 12 12 13 13 14 14 14 15 15 16 16 16 17 17 17 18 18 18 19 19 20 20 21 21 22 23 24 How about 16 classes? (“bins”) 24 25 25 25 27 28 29
 numbers Remember: This is all about helping")
5. Class width should be round (easy) numbers Remember: This is all about helping readers understand quickly and clearly. Lower boundary can be multiple of interval size Round numbers: 5, 10, 15, 20 etc or 6. Try to avoid open ended 3, 6, 9, 12 classes For example etc • 10 and above • Greater than 100 • Less than 50 Clear & Easy 8 - 11 12 - 15 16 - 19 20 - 23 24 - 27 28 - 31 8 8 9 10 11 11 11 12 12 13 13 14 14 14 15 15 16 16 16 17 17 17 18 18 18 19 19 20 20 21 21 22 23 24 24 25 25 25 27 28 29

Scores on an exam 82 75 88 93 53 84 87 Let’s do one Step 1: List scores 58 72 94 69 84 61 91 Step 2: List scores in order Step 3: Decide whether grouped or ungrouped If less than 10 groups, “ungrouped” is fine If more than 10 groups, “grouped” might be better How to figure how many values Largest number - smallest number + 1 99 - 53 + 1 = 47 Step 4: Generate number and size of intervals (or size of bins) If we have 6 bins – we’d have intervals of 8 Whaddya think? Would intervals of 5 Sample size (n) 10 – 16 17 – 32 33 – 64 65 – 128 129 - 255 256 – 511 512 – 1, 024 Number of classes 5 6 7 8 9 10 11 Let’s just try it and see which we prefer… 64 87 84 70 76 89 75 53 58 60 61 64 69 70 72 73 75 75 76 78 80 82 84 84 84 87 87 87 88 89 91 93 94 95 99 80 73 78 60 87 95 99

Scores on an exam Score Frequency 93 - 100 4 85 - 92 6 77 - 84 6 69 - 76 7 61 - 68 2 53 - 60 3 Scores on an exam Score Frequency 95 - 99 2 90 - 94 3 85 - 89 5 80 – 84 5 75 - 79 4 70 - 74 3 65 - 69 1 Let’s just try 60 - 64 3 it and see 55 - 59 1 which we 50 - 54 1 prefer… 10 bins Interval of 5 Remember: This is all about helping readers understand quickly and clearly. Scores on an exam 82 75 88 93 53 84 87 6 bins Interval of 8 Scores on an exam Score Frequency 95 - 99 2 90 - 94 3 85 - 89 5 80 – 84 5 75 - 79 4 70 - 74 3 65 - 69 1 60 - 64 3 55 - 59 1 50 - 54 1 58 72 94 69 84 61 91 64 87 84 70 76 89 75 53 58 60 61 64 69 70 72 73 75 75 76 78 80 82 84 84 84 87 87 87 88 89 91 93 94 95 99 80 73 78 60 87 95 99

Scores on an exam 82 75 88 93 53 84 87 Let’s make a frequency histogram using 10 bins and bin width of 5!! 58 72 94 69 84 61 91 64 87 84 70 76 89 75 80 73 78 60 87 95 99 Scores on an exam Score Frequency 95 - 99 2 90 - 94 3 85 - 89 5 80 – 84 5 75 - 79 4 70 - 74 3 65 - 69 1 60 - 64 3 55 - 59 1 50 - 54 1

Scores on an exam Step 6: Complete the Frequency Table Scores on an exam Relative Cumulative Score Frequency 95 - 99 2. 0715 28 1. 0000 90 - 94 3. 1071 26. 9285 85 - 89 5. 1786 23. 8214 80 – 84 5. 1786 18. 6428 75 - 79 4. 1429 13. 4642 70 - 74 3. 1071 9. 3213 65 - 69 1. 0357 6. 2142 60 - 64 3. 1071 5. 1785 55 - 59 1. 0357 2. 0714 50 - 54 1. 0357 6 bins Just adding Interval of 8 up the frequency data from the smallest to largest numbers Just dividing each frequency by total number to get a ratio (like a percent) 82 75 88 93 53 84 87 Please note: 1 /28 =. 0357 3/ 28 =. 1071 4/28 =. 1429 58 64 80 72 87 73 94 84 78 69 70 60 84 76 87 Just adding 61 89 95 up the 91 75 99 relative frequency data from the smallest to. Please largestnote: numbers Also just dividing cumulative frequency by total number 1/28 =. 0357 2/28 =. 0714 5/28 =. 1786

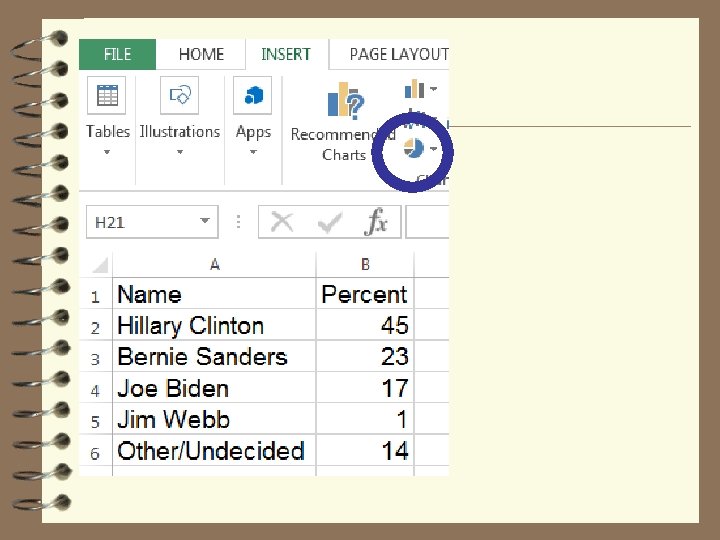
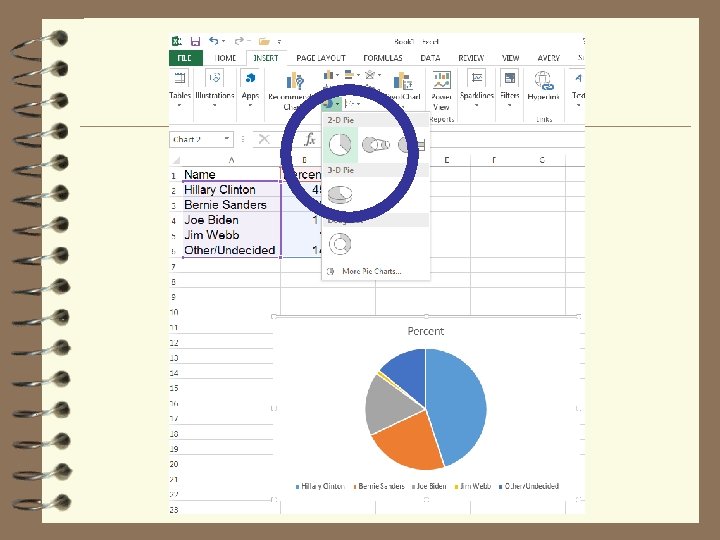
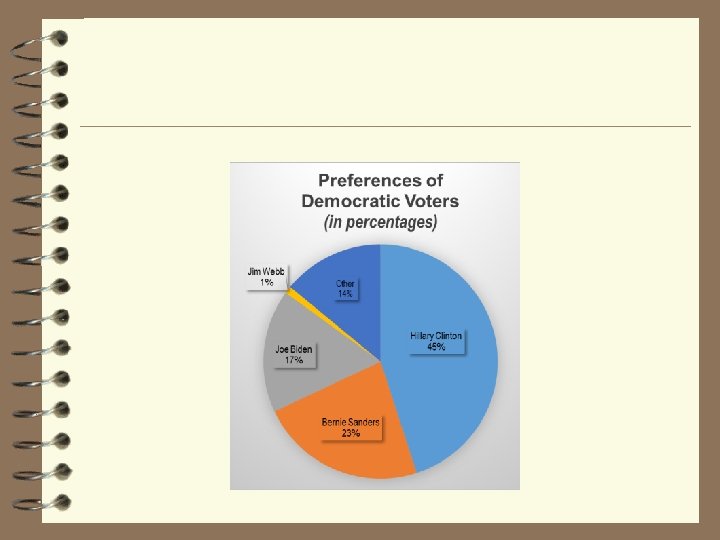
Simple Frequency Table – Qualitative Data Who is your favorite candidate Candidate Frequency Hillary Clinton 45 Bernie Sanders 23 Joe Biden 17 Jim Webb 1 Other/Undecided 14 Relative Frequency. 4500. 2300. 1700. 0100. 1400 Just divide each frequency by total number Please note: 45 /100 =. 4500 23 /100 =. 2300 17 /100 =. 1700 1 /100 =. 0100 Percent 45% 23% 17% 1% 14% Number expected to vote 9, 900, 000 5, 060, 000 3, 740, 000 220, 000 3, 080, 000 Just multiply each relative frequency by 100 Please note: . 4500 x 100 = 45%. 2300 x 100 = 23%. 1700 x 100 = 17%. 0100 x 100 = 1% We asked 100 Democrats “Who is your favorite candidate? ” If 22 million Democrats voted today how many would vote for each candidate? Just multiply each relative frequency by 22 million Please note: . 4500 x 22 m = 9, 900 k. 2300 x 22 m = 35, 060 k. 1700 x 22 m = 23, 740 k. 0100 x 22 m= 220 k Data based on Gallup poll on 8/24/11

- Slides: 31