
Introduction to SPSS Graphingt Test Procedures Graphing Bar
Introduction to SPSS Graphing/t Test Procedures
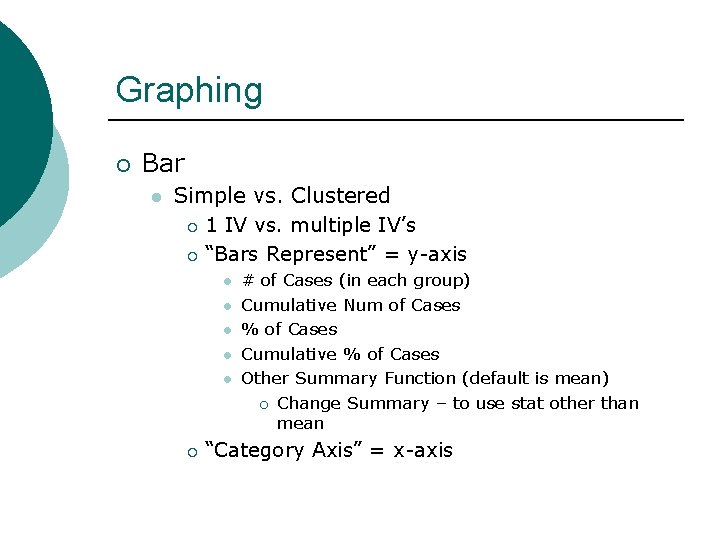
Graphing ¡ Bar l Simple vs. Clustered ¡ 1 IV vs. multiple IV’s ¡ “Bars Represent” = y-axis l l l ¡ # of Cases (in each group) Cumulative Num of Cases % of Cases Cumulative % of Cases Other Summary Function (default is mean) ¡ Change Summary – to use stat other than mean “Category Axis” = x-axis
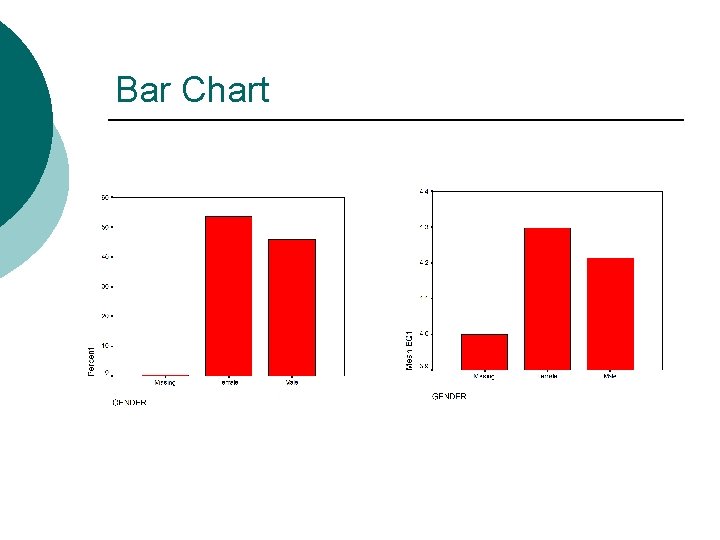
Bar Chart
Line Chart ¡ Line l l l Basically, same as Bar More accurate if IV groups form continuum (polychotomized artificially) Simple vs. Multiple ¡ Same as Simple vs. Clustered

Line Chart

Area Chart ¡ Area l Same as Line and Bar
Pie Chart ¡ Pie l l l “Summaries for Groups of Cases” ¡ Choose one discrete variable (with multiple groups) ¡ Same as Bar, Line, Area charts “Summaries of Separate Variables” ¡ Choose several dimensional variables (without subgroups) and SPSS combines them for you “Values of Individual Cases” ¡ Don’t worry about this one
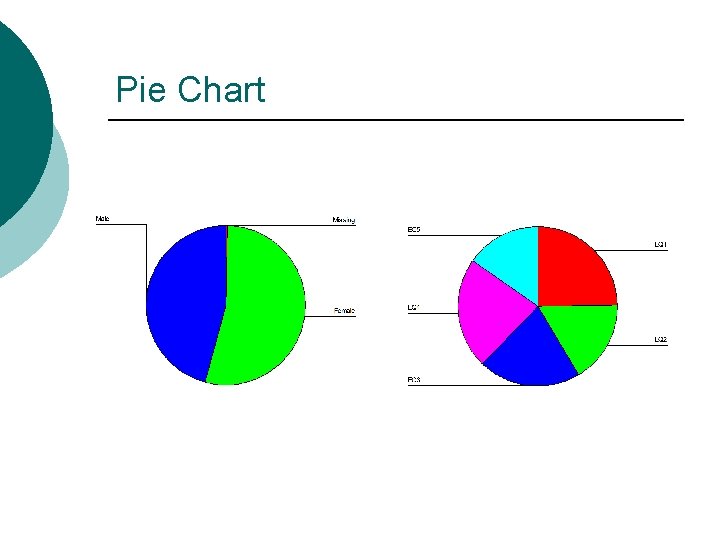
Pie Chart
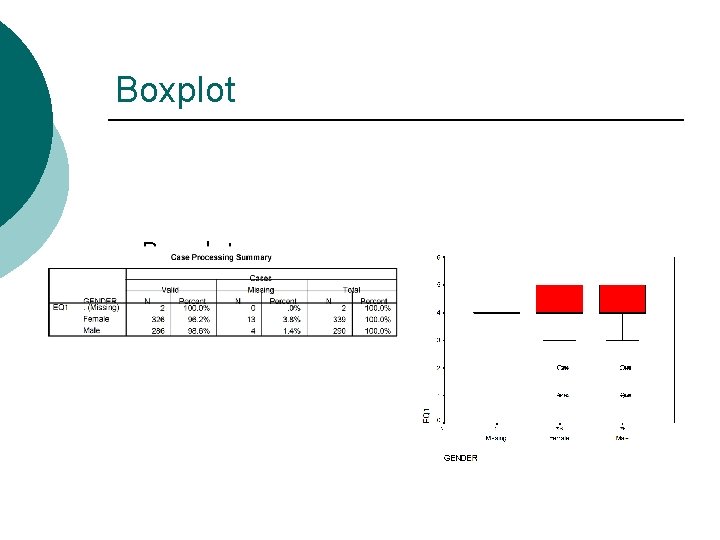
Boxplot ¡ Boxplot l Simple vs. Clustered
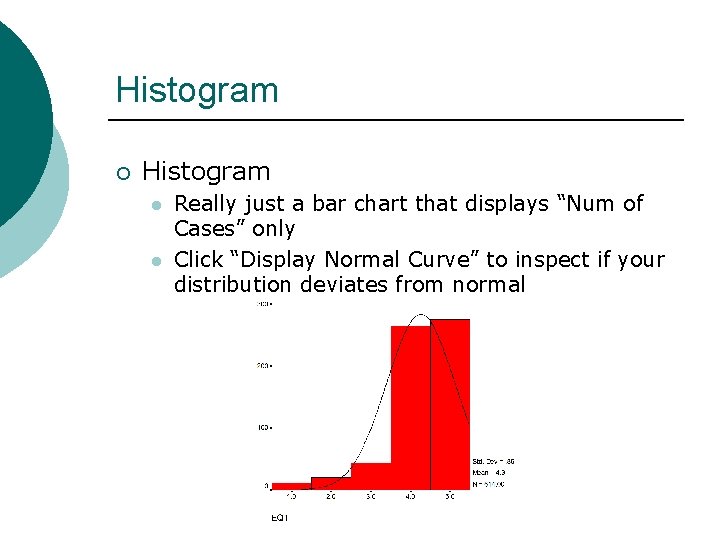
Histogram ¡ Histogram l l Really just a bar chart that displays “Num of Cases” only Click “Display Normal Curve” to inspect if your distribution deviates from normal
One-Sample t Test ¡ Tests for difference between sample mean and pre-determined population mean l l l Click “Analyze” “Compare Means” “One. Sample T Test…” “Test Value” = Predetermined population mean Options: ¡ Exclude Cases Listwise = If multiple variables used, only use cases that have values on ALL variables ¡ Exclude Cases Analysis by Analysis
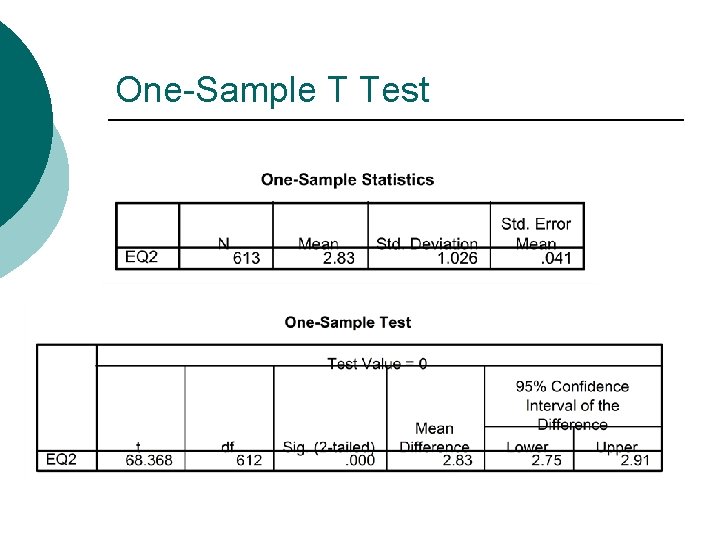
One-Sample T Test
Paired-Samples t Test ¡ Tests if two related samples differ significantly from one another l Click “Analyze” “Compare Means” “Paired-Samples T Test…”
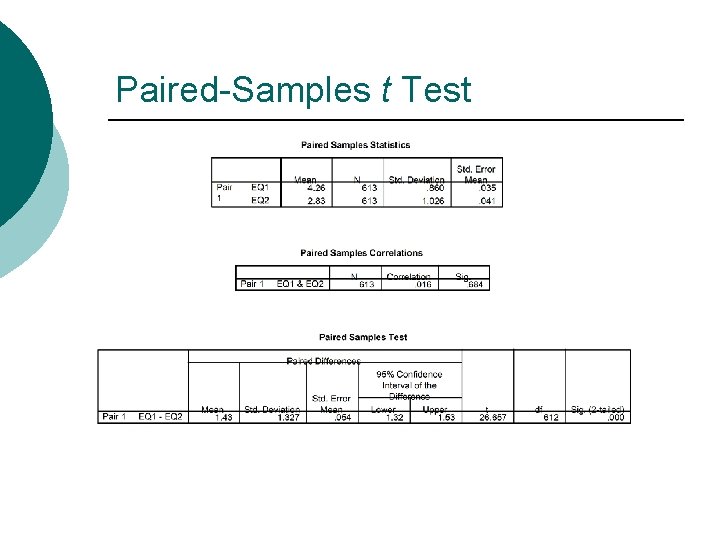
Paired-Samples t Test
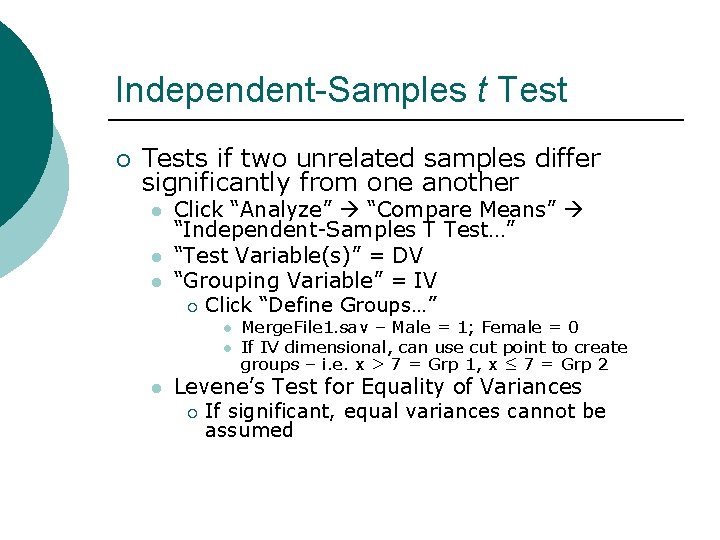
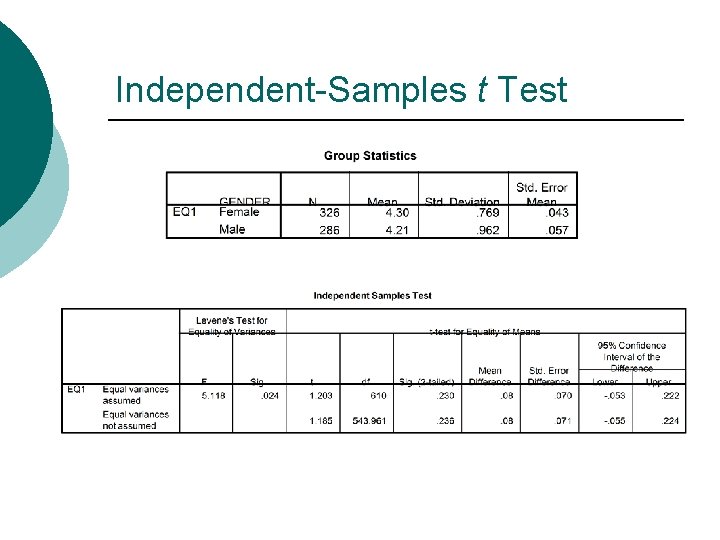
Independent-Samples t Test ¡ Tests if two unrelated samples differ significantly from one another l l l Click “Analyze” “Compare Means” “Independent-Samples T Test…” “Test Variable(s)” = DV “Grouping Variable” = IV ¡ Click “Define Groups…” l l l Merge. File 1. sav – Male = 1; Female = 0 If IV dimensional, can use cut point to create groups – i. e. x > 7 = Grp 1, x ≤ 7 = Grp 2 Levene’s Test for Equality of Variances ¡ If significant, equal variances cannot be assumed
Independent-Samples t Test
- Slides: 16