
Introduction to Reliability in Mechanical Engineering Project 1

Introduction to Reliability in Mechanical Engineering Project 1 송민호 Morkache Zinelabidine
Project instruction • Step 1 : Linearity check and R comparison • Step 2 : Goodness of fit test (Kolomogorov -Smirnov test) • Step 3 : Conclusion
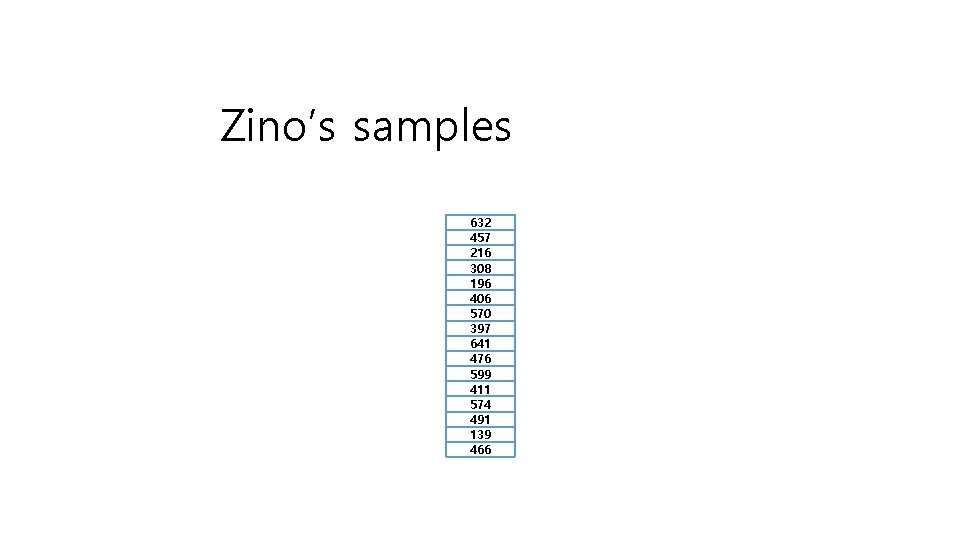
Zino’s samples 632 457 216 308 196 406 570 397 641 476 599 411 574 491 139 466
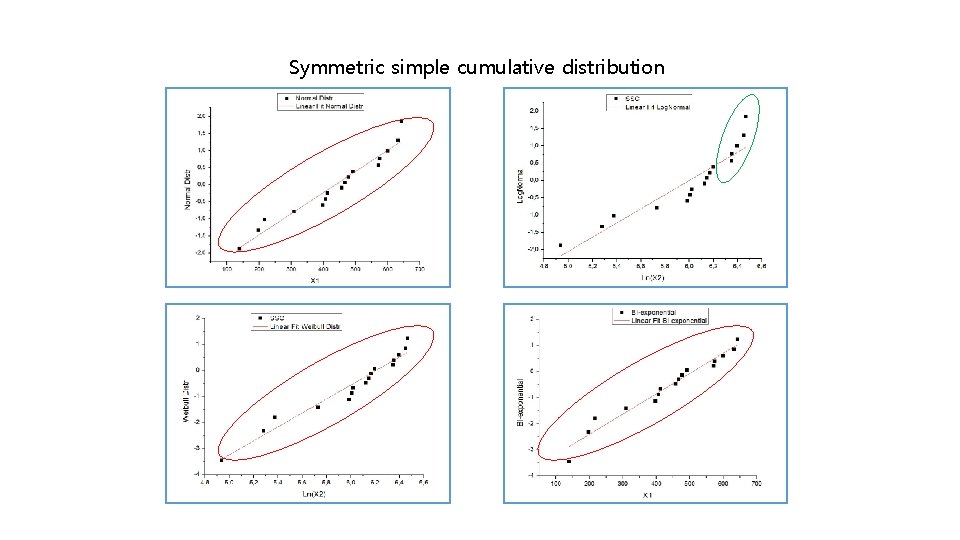
Symmetric simple cumulative distribution
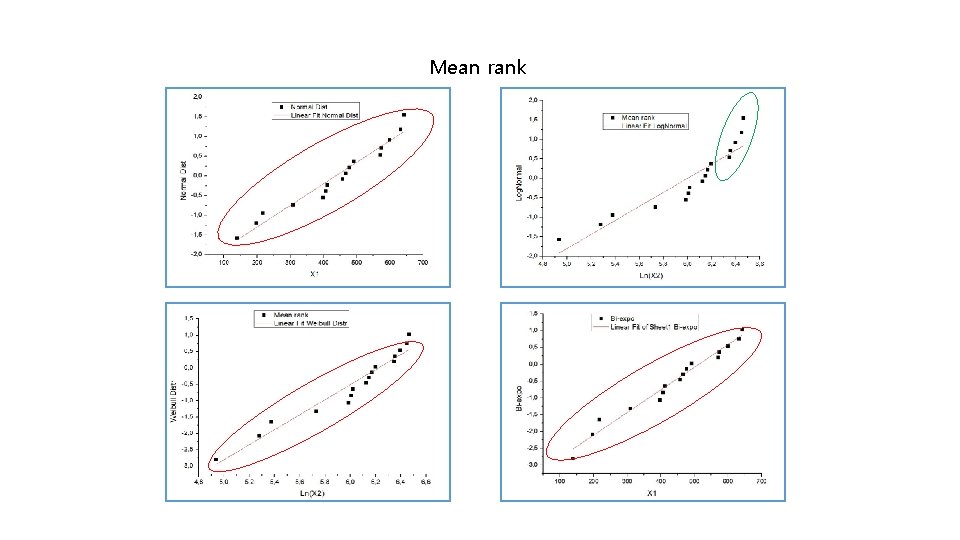
Mean rank

Median rank

The rest Method
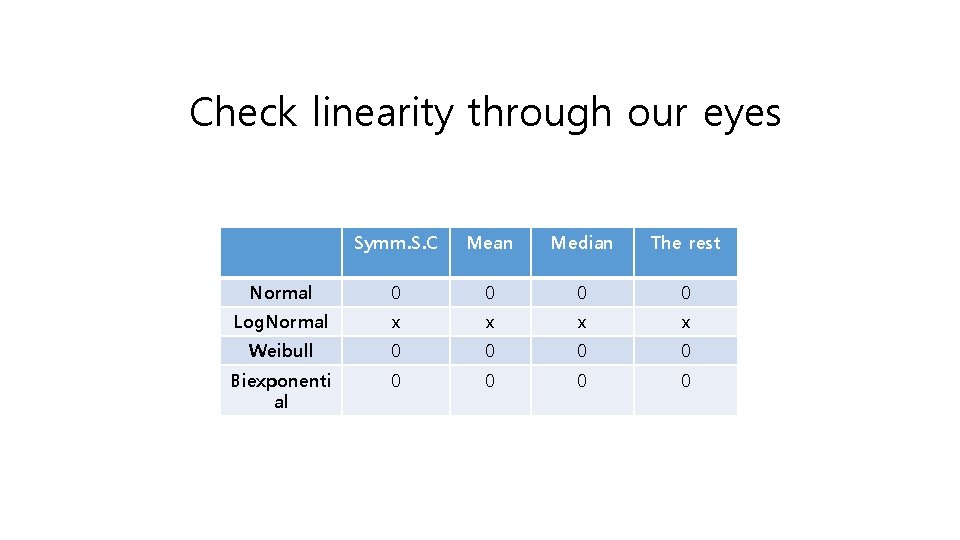
Check linearity through our eyes Symm. S. C Mean Median The rest Normal 0 0 Log. Normal x x Weibull 0 0 Biexponenti al 0 0
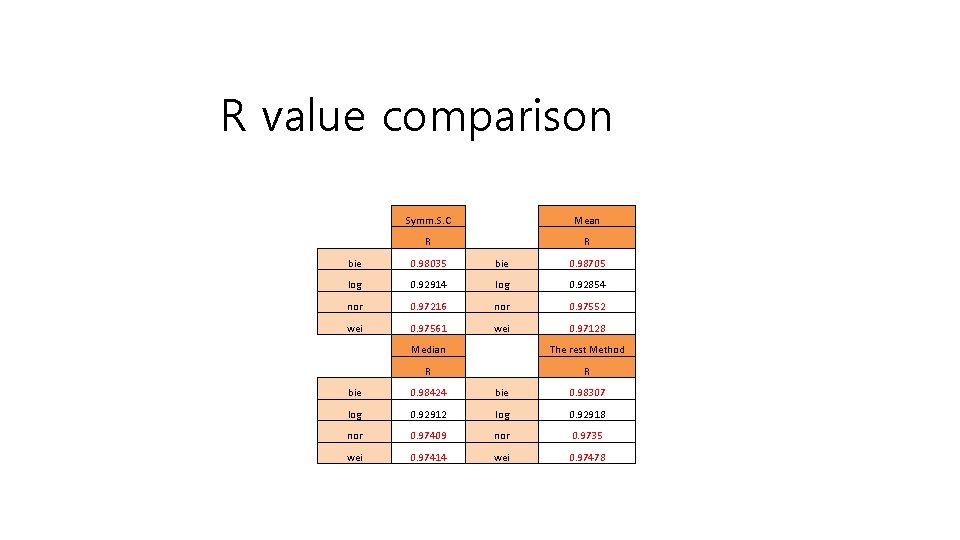
R value comparison Symm. S. C Mean R R bie 0. 98035 bie 0. 98705 log 0. 92914 log 0. 92854 nor 0. 97216 nor 0. 97552 wei 0. 97561 wei 0. 97128 Median The rest Method R R bie 0. 98424 bie 0. 98307 log 0. 92912 log 0. 92918 nor 0. 97409 nor 0. 9735 wei 0. 97414 wei 0. 97478
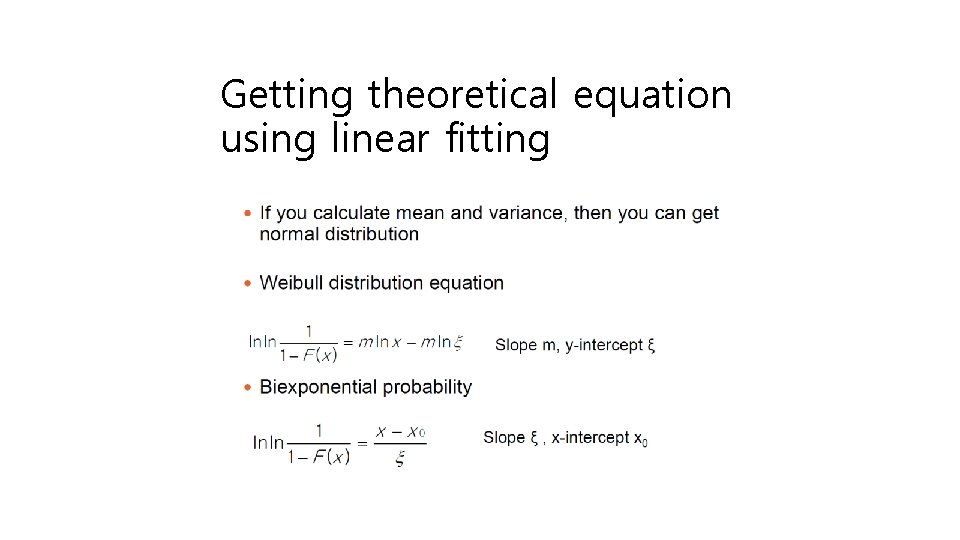
Getting theoretical equation using linear fitting
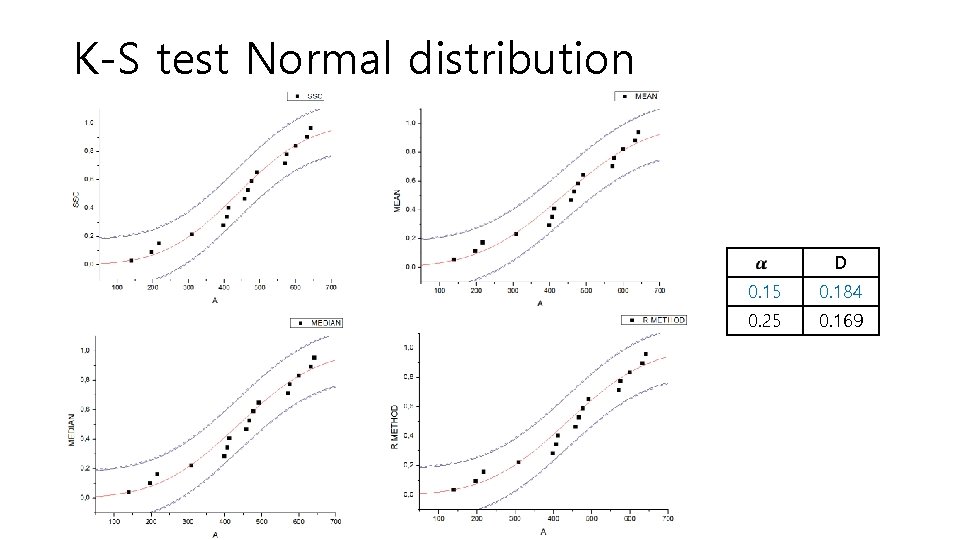
K-S test Normal distribution D 0. 15 0. 184 0. 25 0. 169
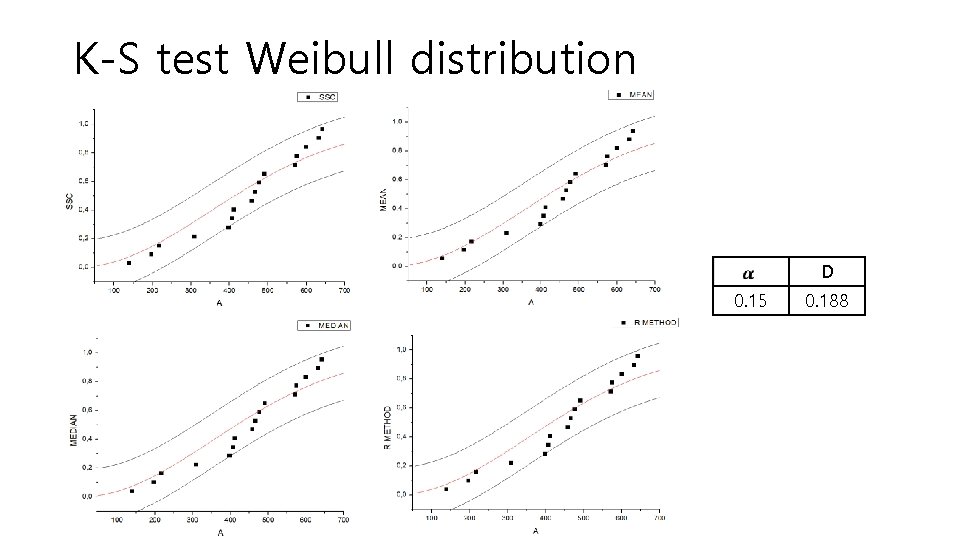
K-S test Weibull distribution D 0. 15 0. 188
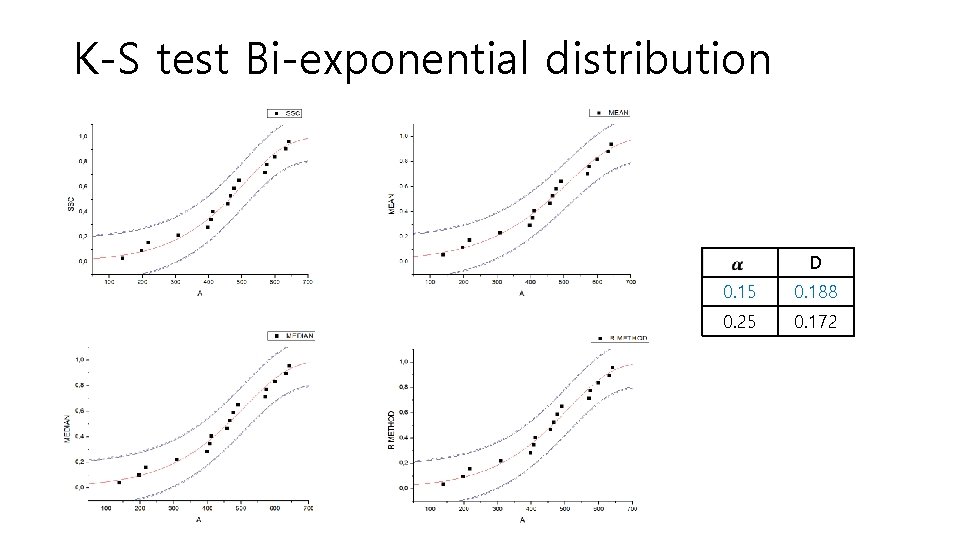
K-S test Bi-exponential distribution D 0. 15 0. 188 0. 25 0. 172
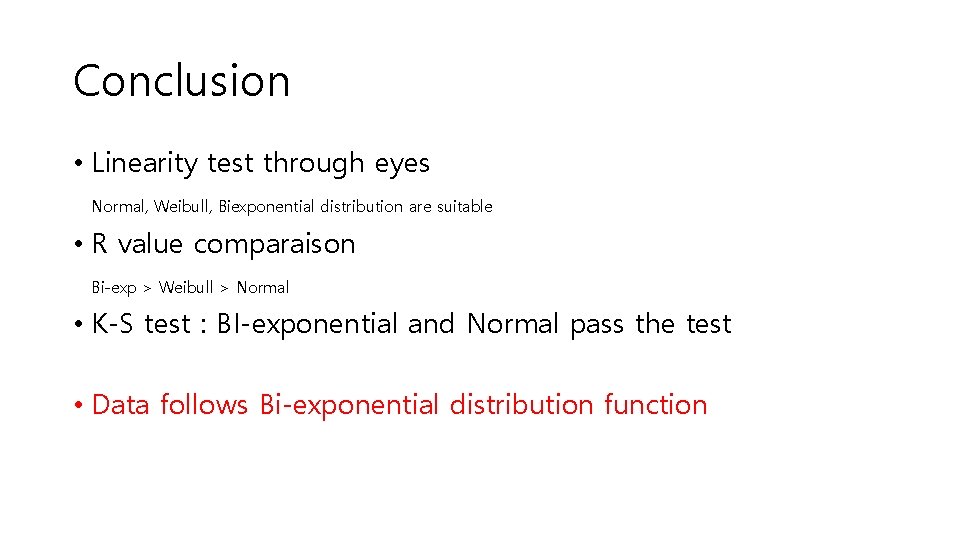
Conclusion • Linearity test through eyes Normal, Weibull, Biexponential distribution are suitable • R value comparaison Bi-exp > Weibull > Normal • K-S test : BI-exponential and Normal pass the test • Data follows Bi-exponential distribution function
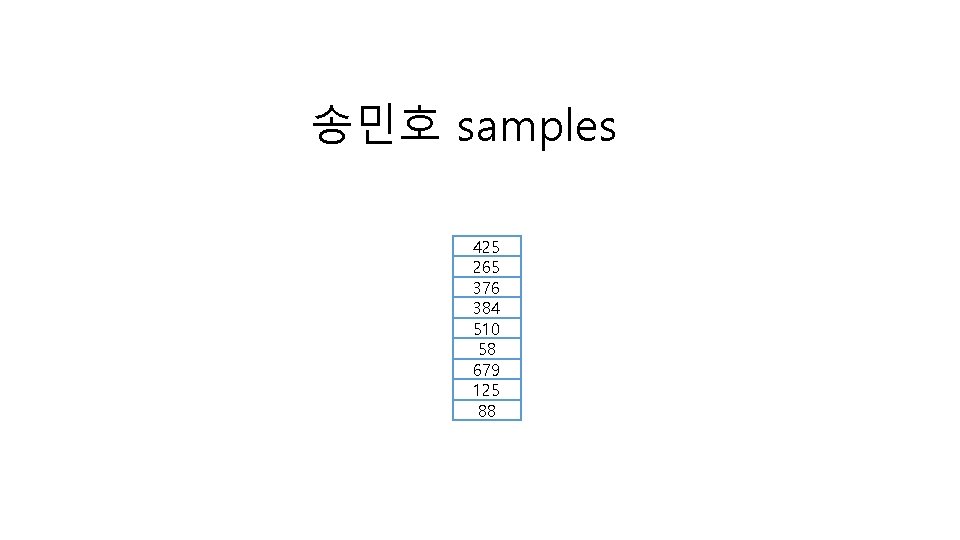
송민호 samples 425 265 376 384 510 58 679 125 88
Symmetric sample cumulative Normal Log-normal Weibull Bi-exponential
Normal Weibull Mean rank Log-normal Bi-exponential
Normal Weibull Median rank Log-normal Bi-exponential
Normal Weibull The rest method Log-normal Bi-exponential
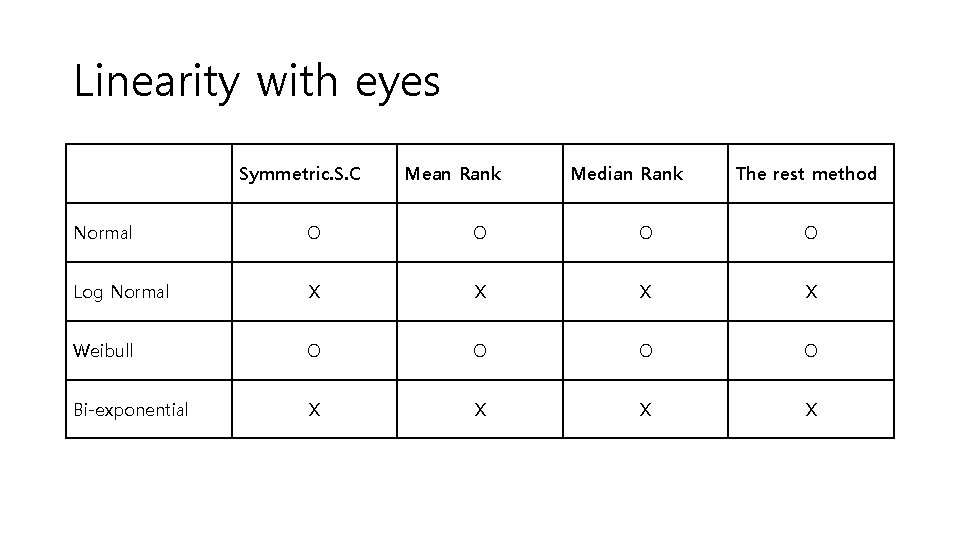
Linearity with eyes Symmetric. S. C Mean Rank Median Rank The rest method Normal O O Log Normal X X Weibull O O Bi-exponential X X
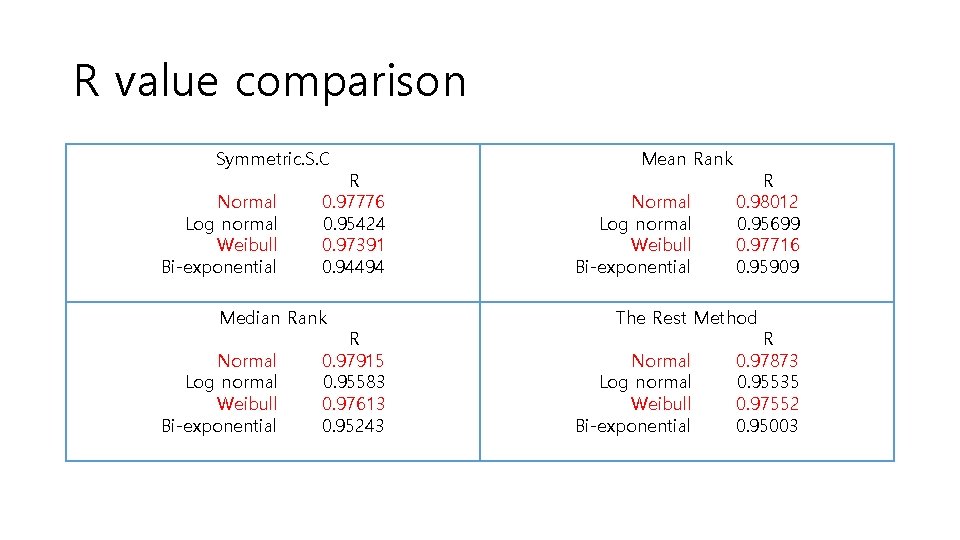
R value comparison Symmetric. S. C Normal Log normal Weibull Bi-exponential R 0. 97776 0. 95424 0. 97391 0. 94494 Median Rank Normal Log normal Weibull Bi-exponential R 0. 97915 0. 95583 0. 97613 0. 95243 Mean Rank Normal Log normal Weibull Bi-exponential R 0. 98012 0. 95699 0. 97716 0. 95909 The Rest Method Normal Log normal Weibull Bi-exponential R 0. 97873 0. 95535 0. 97552 0. 95003
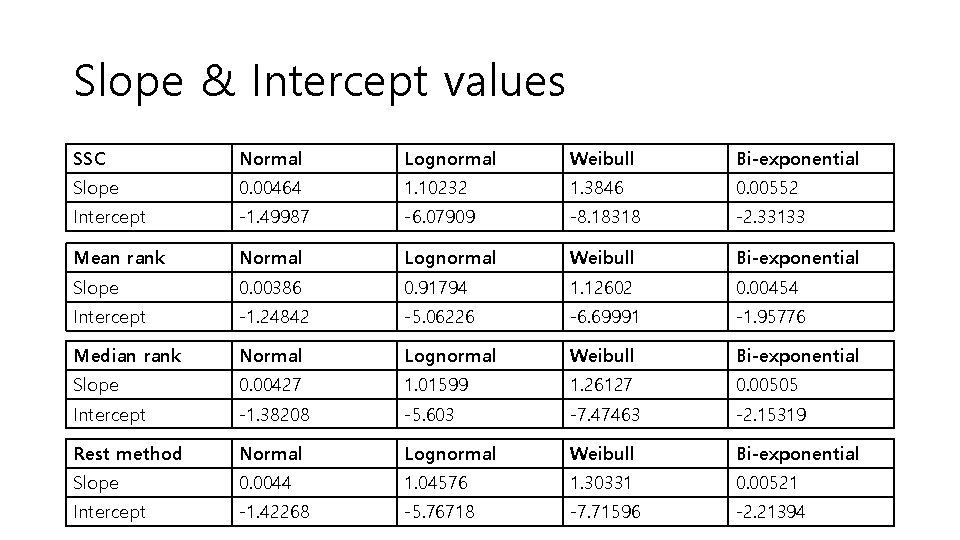
Slope & Intercept values SSC Normal Lognormal Weibull Bi-exponential Slope 0. 00464 1. 10232 1. 3846 0. 00552 Intercept -1. 49987 -6. 07909 -8. 18318 -2. 33133 Mean rank Normal Lognormal Weibull Bi-exponential Slope 0. 00386 0. 91794 1. 12602 0. 00454 Intercept -1. 24842 -5. 06226 -6. 69991 -1. 95776 Median rank Normal Lognormal Weibull Bi-exponential Slope 0. 00427 1. 01599 1. 26127 0. 00505 Intercept -1. 38208 -5. 603 -7. 47463 -2. 15319 Rest method Normal Lognormal Weibull Bi-exponential Slope 0. 0044 1. 04576 1. 30331 0. 00521 Intercept -1. 42268 -5. 76718 -7. 71596 -2. 21394
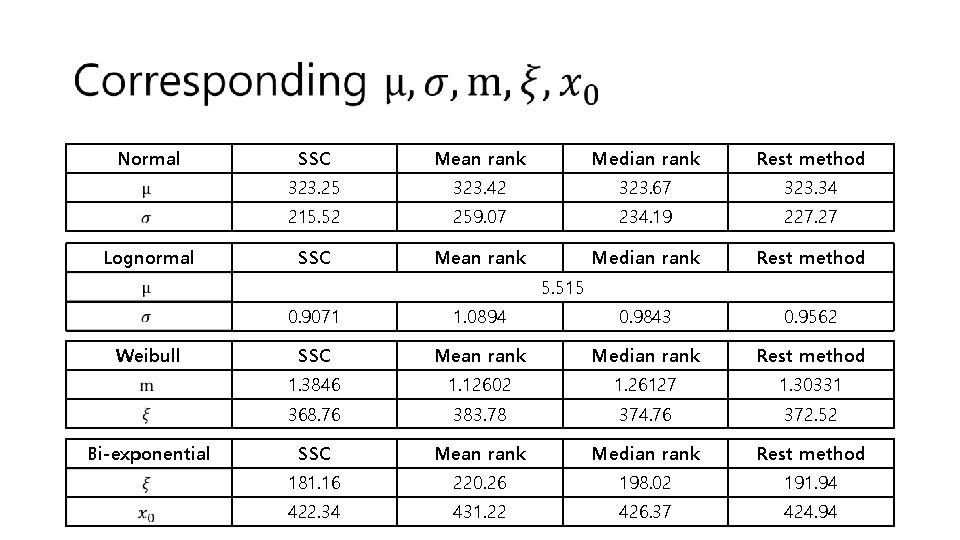
Normal Lognormal SSC Mean rank Median rank Rest method 323. 25 323. 42 323. 67 323. 34 215. 52 259. 07 234. 19 227. 27 SSC Mean rank Median rank Rest method 5. 515 Weibull Bi-exponential 0. 9071 1. 0894 0. 9843 0. 9562 SSC Mean rank Median rank Rest method 1. 3846 1. 12602 1. 26127 1. 30331 368. 76 383. 78 374. 76 372. 52 SSC Mean rank Median rank Rest method 181. 16 220. 26 198. 02 191. 94 422. 34 431. 22 426. 37 424. 94
Normal distribution(Symmetric S. C) SSC Mean rank D Median rank Rest method 0. 25 0. 218 0. 20 0. 227
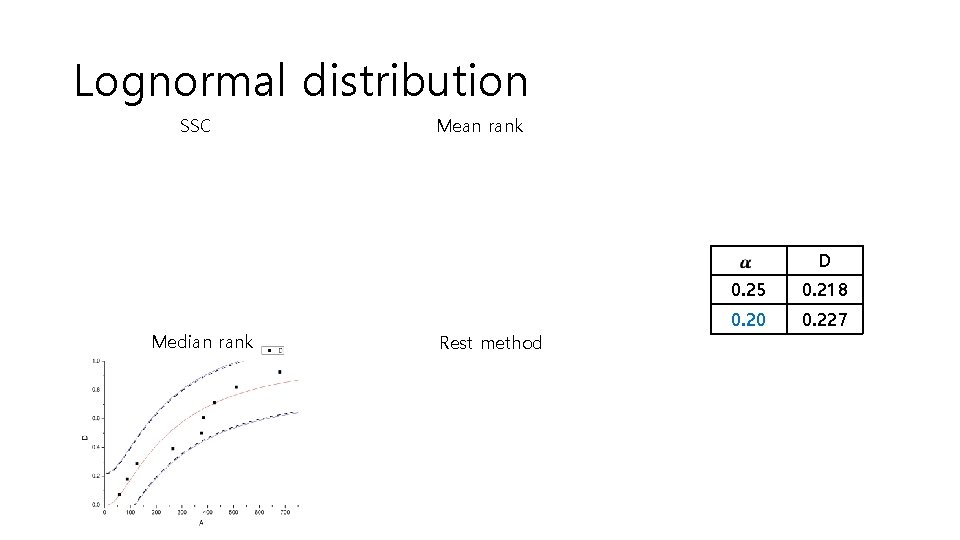
Lognormal distribution SSC Mean rank D Median rank Rest method 0. 25 0. 218 0. 20 0. 227
Weibull distribution SSC Mean rank D Median rank Rest method 0. 25 0. 220 0. 229
Bi-exponential distribution SSC Mean rank D Median rank Rest method 0. 25 0. 220 0. 229
Conclusion • R values show normal and Weibull as the most appropriate cumulative probability distribution function for the data given • K-S test • All distribution functions passed the test. • However normal and bi-exponential cumulative distribution functions fit better to the formulated function line • As normal distribution satisfy both tests and have the highest R value we concluded that the data given follow normal distribution
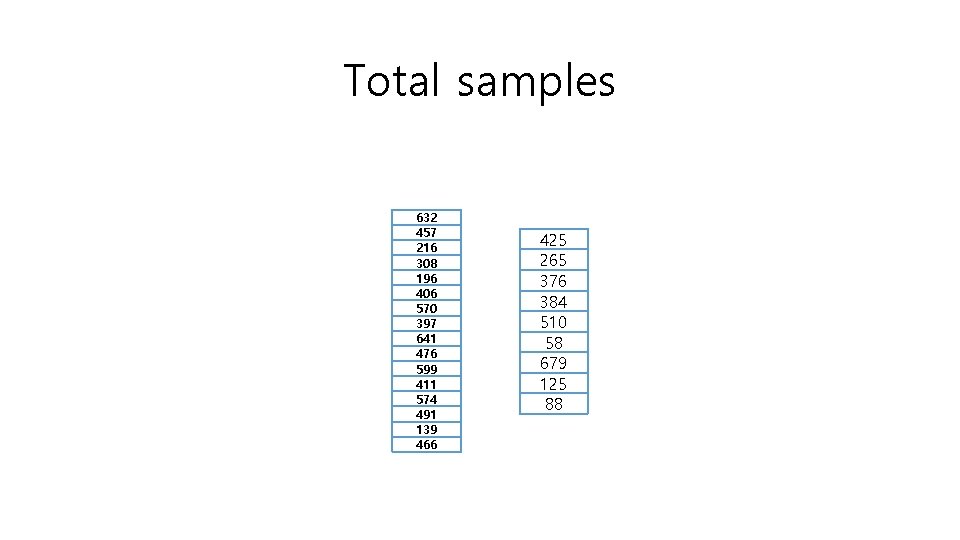
Total samples 632 457 216 308 196 406 570 397 641 476 599 411 574 491 139 466 425 265 376 384 510 58 679 125 88
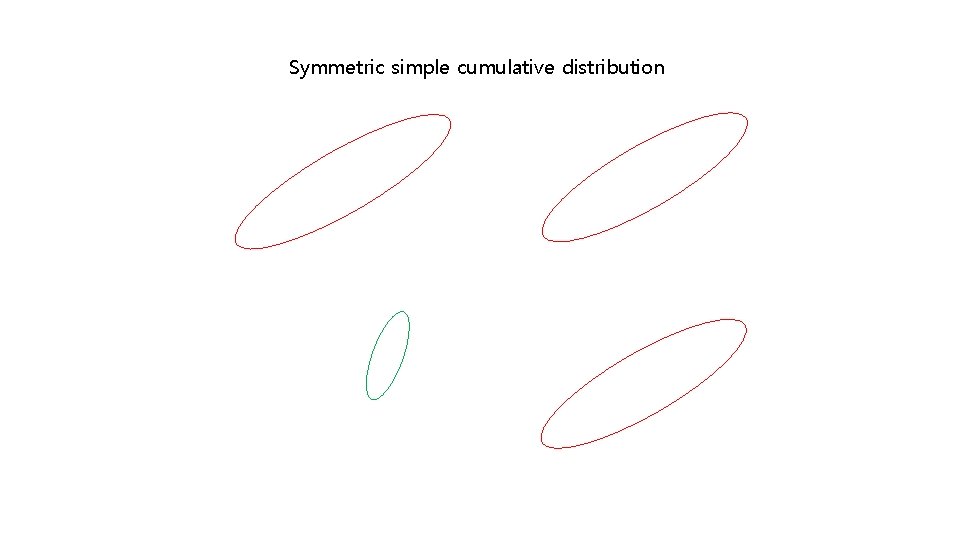
Symmetric simple cumulative distribution
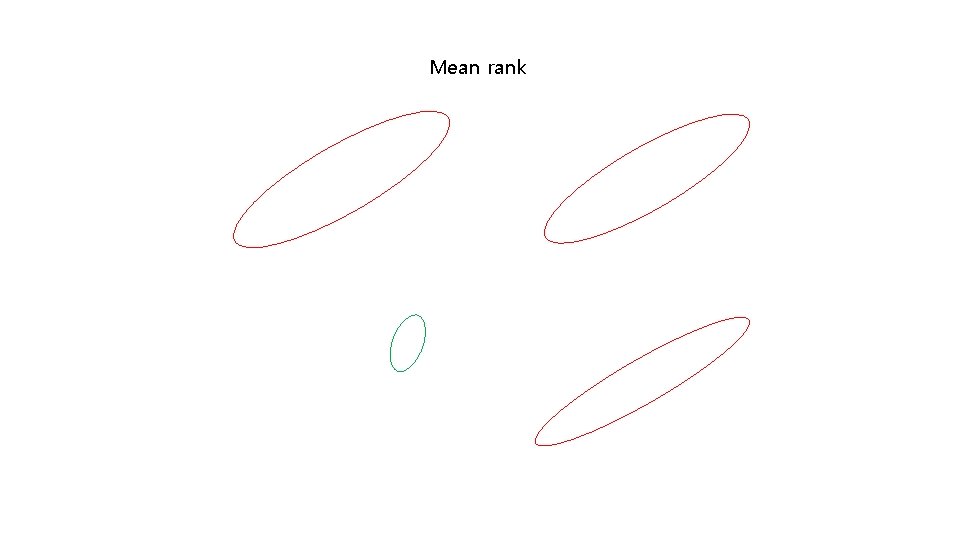
Mean rank

Median rank

The rest Method
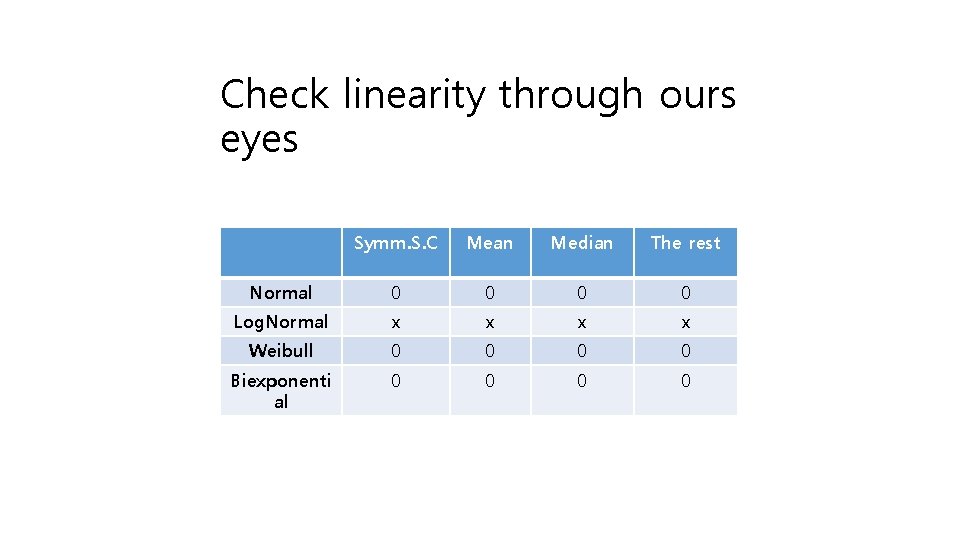
Check linearity through ours eyes Symm. S. C Mean Median The rest Normal 0 0 Log. Normal x x Weibull 0 0 Biexponenti al 0 0
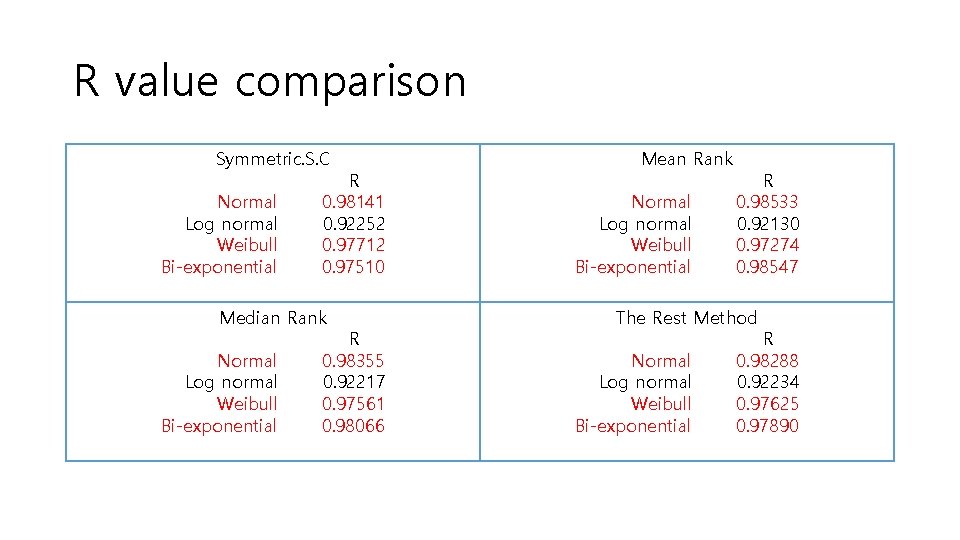
R value comparison Symmetric. S. C Normal Log normal Weibull Bi-exponential R 0. 98141 0. 92252 0. 97712 0. 97510 Median Rank Normal Log normal Weibull Bi-exponential R 0. 98355 0. 92217 0. 97561 0. 98066 Mean Rank Normal Log normal Weibull Bi-exponential R 0. 98533 0. 92130 0. 97274 0. 98547 The Rest Method Normal Log normal Weibull Bi-exponential R 0. 98288 0. 92234 0. 97625 0. 97890
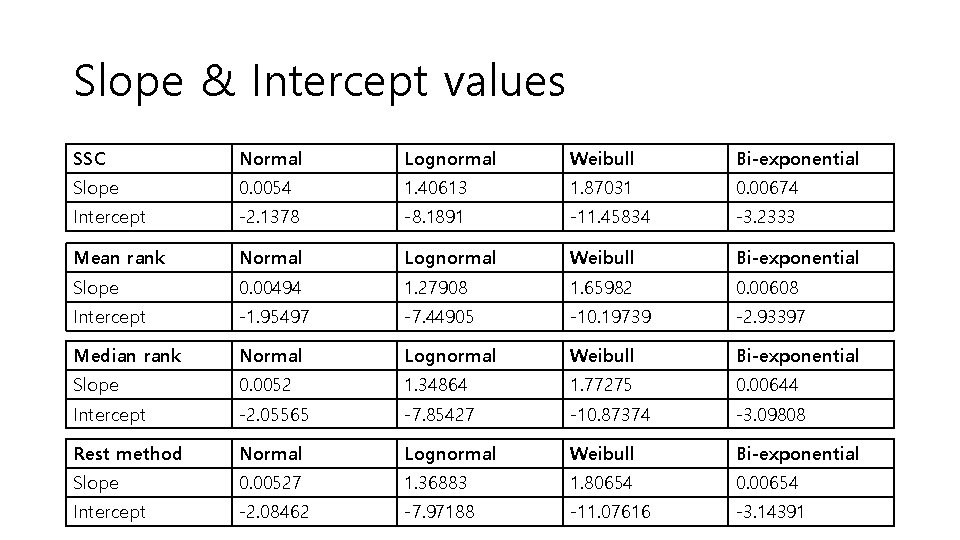
Slope & Intercept values SSC Normal Lognormal Weibull Bi-exponential Slope 0. 0054 1. 40613 1. 87031 0. 00674 Intercept -2. 1378 -8. 1891 -11. 45834 -3. 2333 Mean rank Normal Lognormal Weibull Bi-exponential Slope 0. 00494 1. 27908 1. 65982 0. 00608 Intercept -1. 95497 -7. 44905 -10. 19739 -2. 93397 Median rank Normal Lognormal Weibull Bi-exponential Slope 0. 0052 1. 34864 1. 77275 0. 00644 Intercept -2. 05565 -7. 85427 -10. 87374 -3. 09808 Rest method Normal Lognormal Weibull Bi-exponential Slope 0. 00527 1. 36883 1. 80654 0. 00654 Intercept -2. 08462 -7. 97188 -11. 07616 -3. 14391
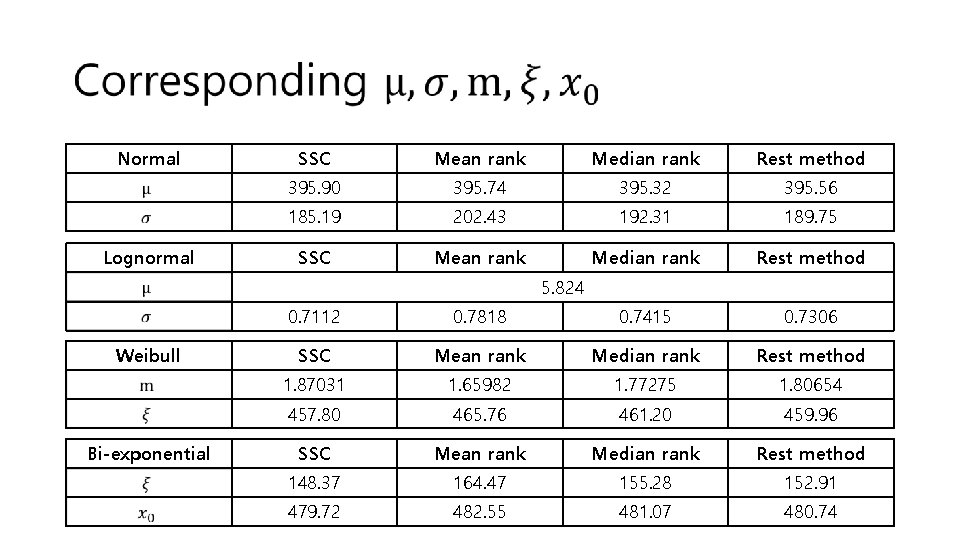
Normal Lognormal SSC Mean rank Median rank Rest method 395. 90 395. 74 395. 32 395. 56 185. 19 202. 43 192. 31 189. 75 SSC Mean rank Median rank Rest method 5. 824 Weibull Bi-exponential 0. 7112 0. 7818 0. 7415 0. 7306 SSC Mean rank Median rank Rest method 1. 87031 1. 65982 1. 77275 1. 80654 457. 80 465. 76 461. 20 459. 96 SSC Mean rank Median rank Rest method 148. 37 164. 47 155. 28 152. 91 479. 72 482. 55 481. 07 480. 74
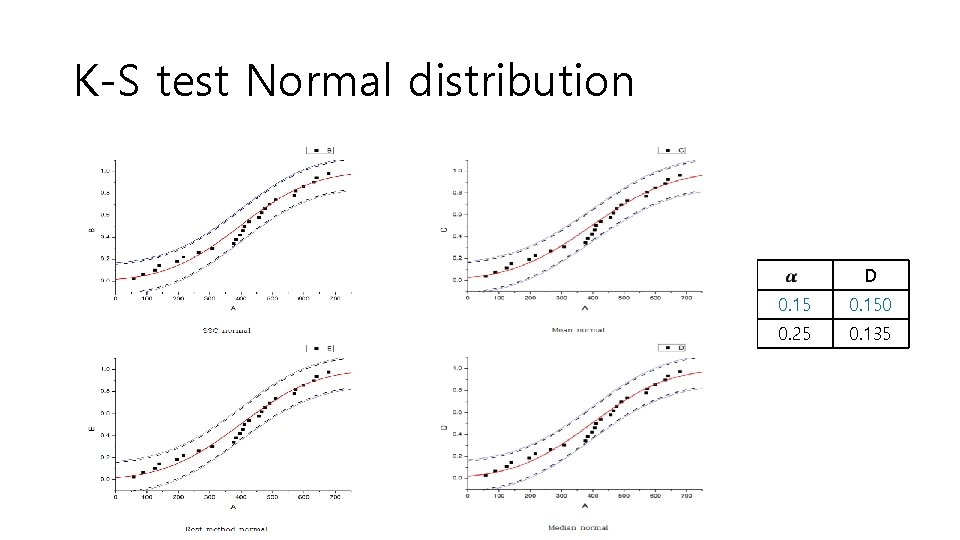
K-S test Normal distribution D 0. 150 0. 25 0. 135
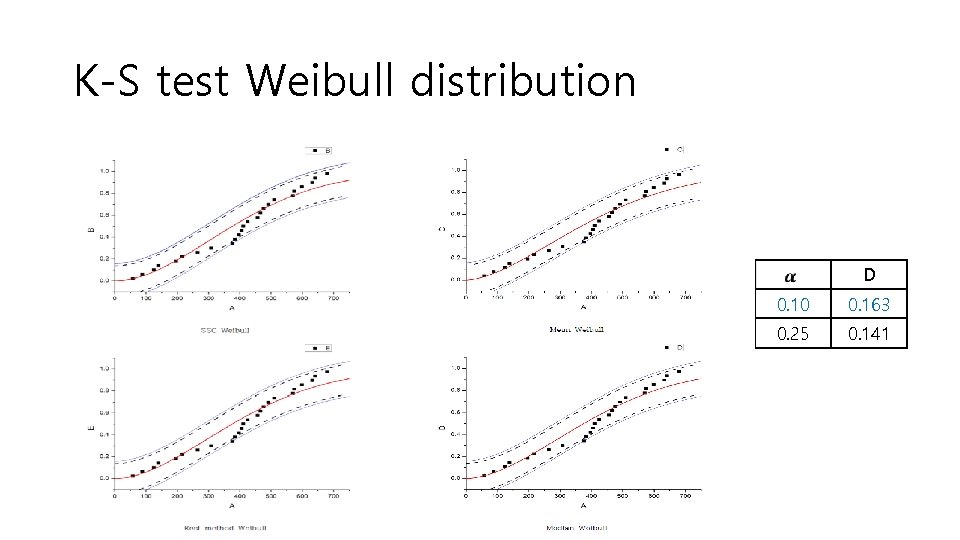
K-S test Weibull distribution D 0. 10 0. 163 0. 25 0. 141
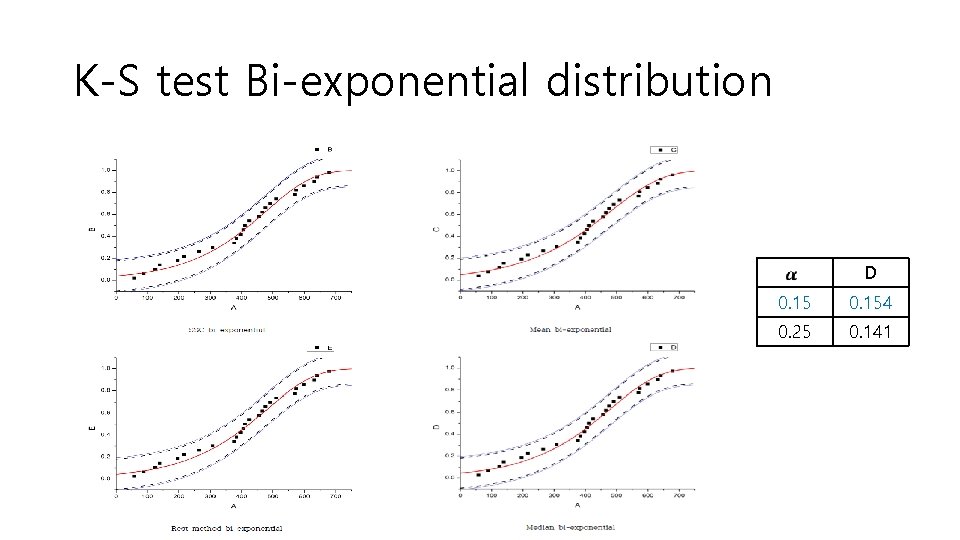
K-S test Bi-exponential distribution D 0. 154 0. 25 0. 141
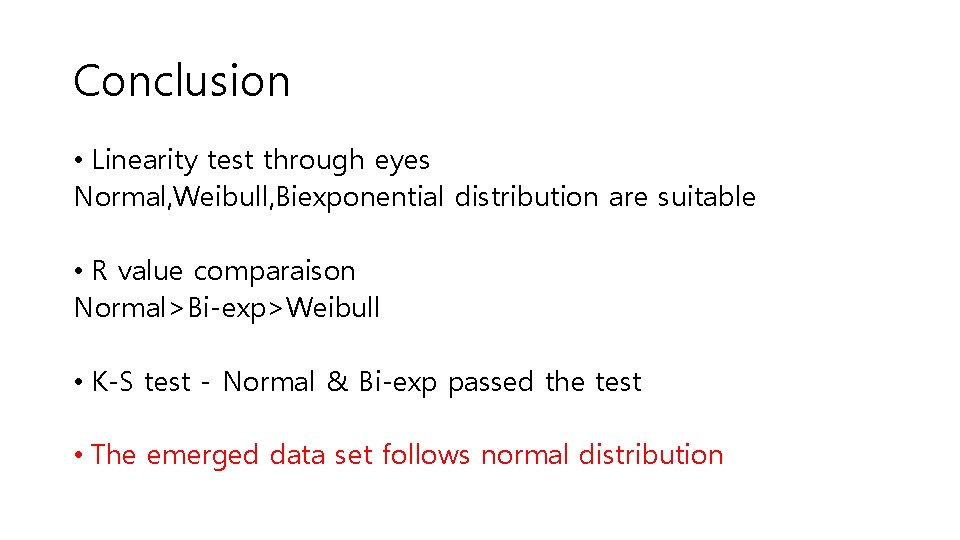
Conclusion • Linearity test through eyes Normal, Weibull, Biexponential distribution are suitable • R value comparaison Normal>Bi-exp>Weibull • K-S test - Normal & Bi-exp passed the test • The emerged data set follows normal distribution

Q&A
- Slides: 42