
Introduction to Reliability in Mechanical Engineering Project 1

Introduction to Reliability in Mechanical Engineering Project 1 Group 5 정대문 Tsung Heng Tsai 19/11/2015 1
Data Set 1 n = 22 2
Data Set 2 n = 23 3
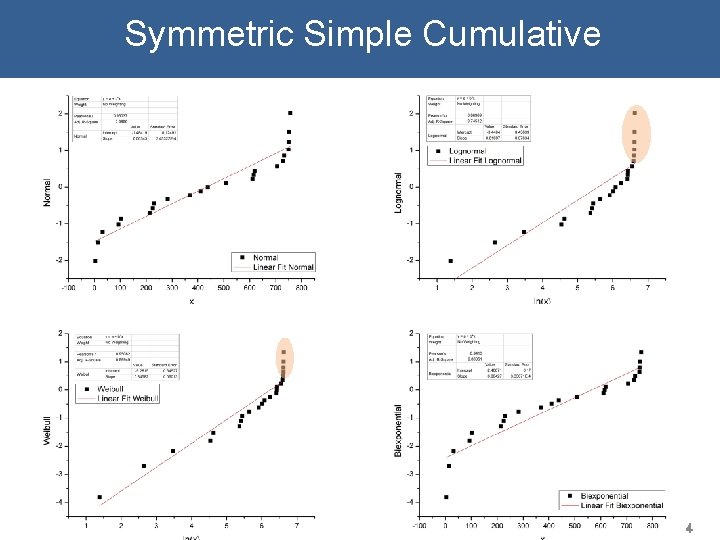
Symmetric Simple Cumulative 4
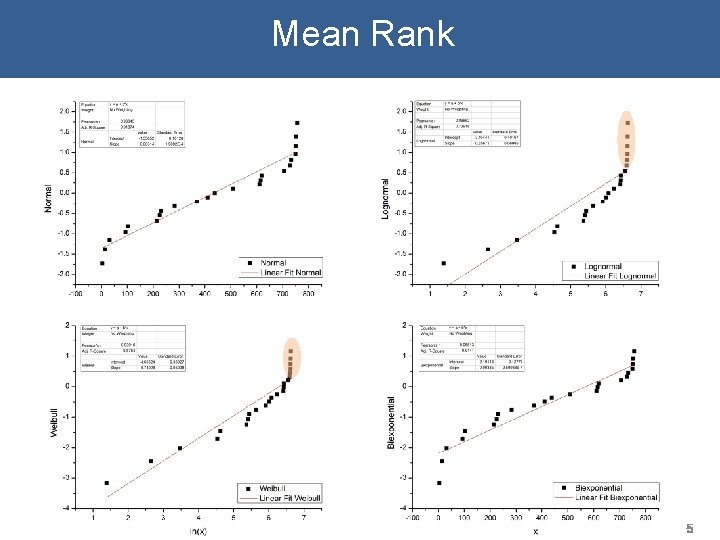
Mean Rank 5

Median Rank 6

The Rest Method 7
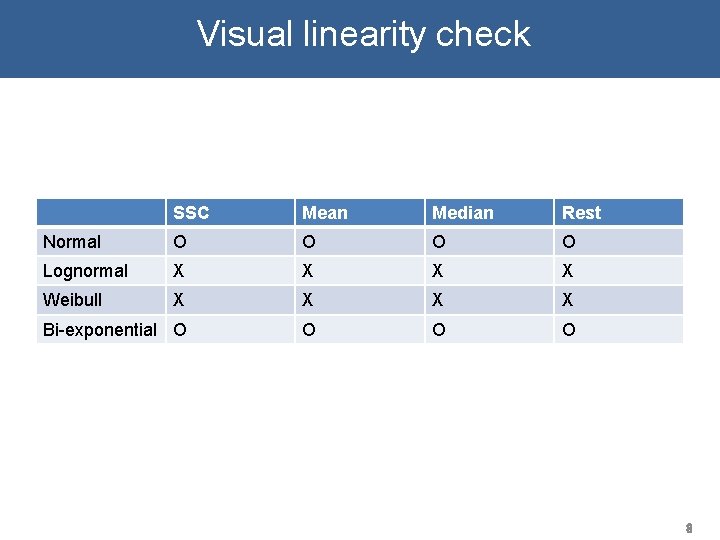
Visual linearity check SSC Mean Median Rest Normal O O Lognormal X X Weibull X X Bi-exponential O O 8
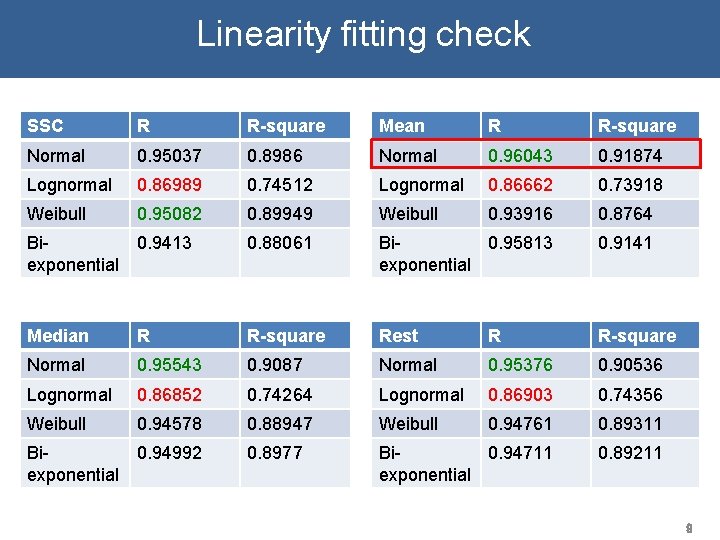
Linearity fitting check SSC R R-square Mean R R-square Normal 0. 95037 0. 8986 Normal 0. 96043 0. 91874 Lognormal 0. 86989 0. 74512 Lognormal 0. 86662 0. 73918 Weibull 0. 95082 0. 89949 Weibull 0. 93916 0. 8764 Biexponential 0. 9413 0. 88061 Bi 0. 95813 exponential 0. 9141 Median R R-square Rest R R-square Normal 0. 95543 0. 9087 Normal 0. 95376 0. 90536 Lognormal 0. 86852 0. 74264 Lognormal 0. 86903 0. 74356 Weibull 0. 94578 0. 88947 Weibull 0. 94761 0. 89311 Biexponential 0. 94992 0. 8977 Bi 0. 94711 exponential 0. 89211 9
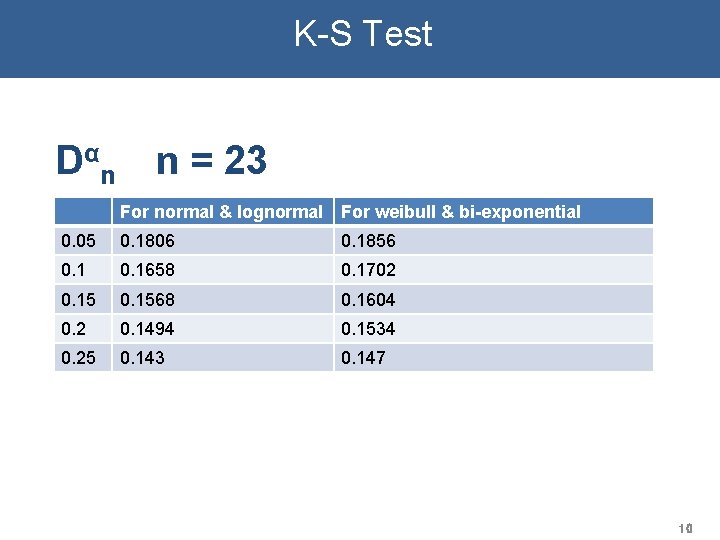
K-S Test Dαn n = 23 For normal & lognormal For weibull & bi-exponential 0. 05 0. 1806 0. 1856 0. 1658 0. 1702 0. 1568 0. 1604 0. 2 0. 1494 0. 1534 0. 25 0. 143 0. 147 10
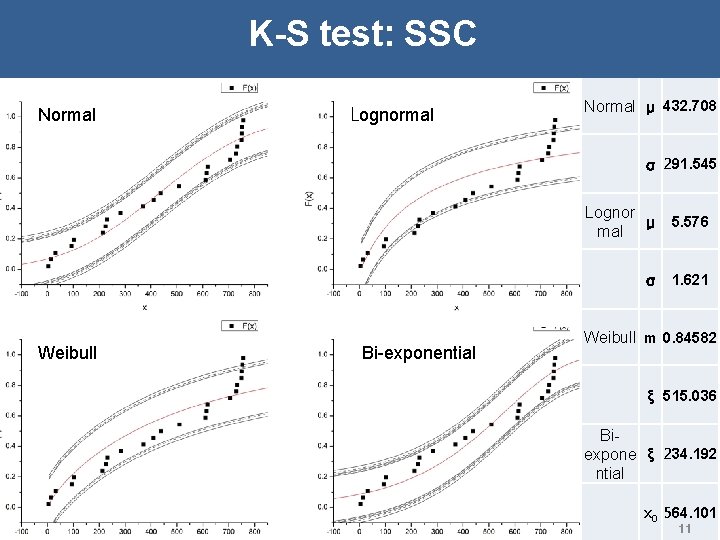
K-S test: SSC Normal Lognormal Normal μ 432. 708 σ 291. 545 Weibull Bi-exponential Lognor μ mal 5. 576 σ 1. 621 Weibull m 0. 84582 ξ 515. 036 Biexpone ξ 234. 192 ntial x 0 564. 101 11
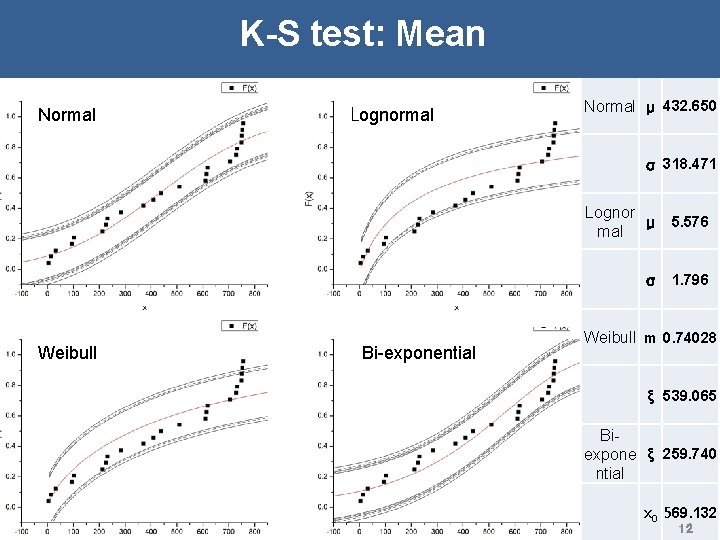
K-S test: Mean Normal Lognormal Normal μ 432. 650 σ 318. 471 Weibull Bi-exponential Lognor μ mal 5. 576 σ 1. 796 Weibull m 0. 74028 ξ 539. 065 Biexpone ξ 259. 740 ntial x 0 569. 132 12
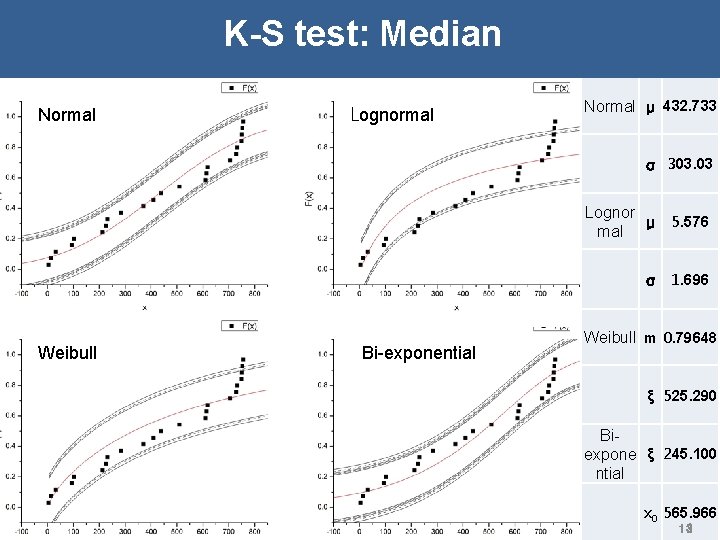
K-S test: Median Normal Lognormal Normal μ 432. 733 σ 303. 03 Weibull Bi-exponential Lognor μ mal 5. 576 σ 1. 696 Weibull m 0. 79648 ξ 525. 290 Biexpone ξ 245. 100 ntial x 0 565. 966 13
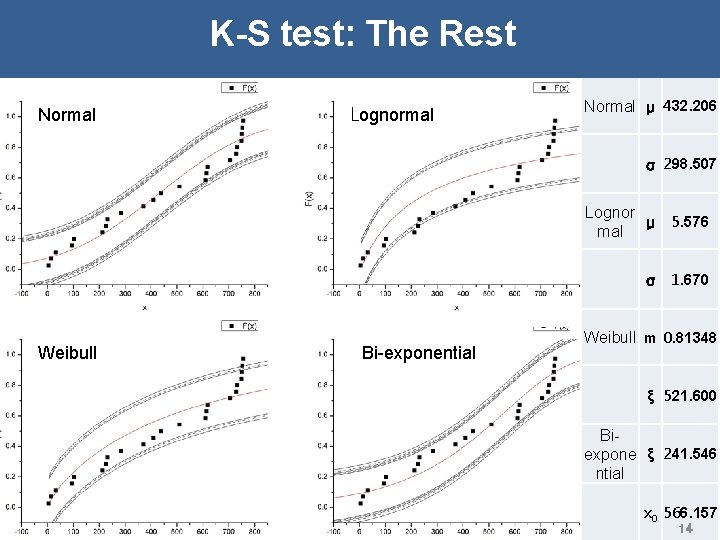
K-S test: The Rest Normal Lognormal Normal μ 432. 206 σ 298. 507 Weibull Bi-exponential Lognor μ mal 5. 576 σ 1. 670 Weibull m 0. 81348 ξ 521. 600 Biexpone ξ 241. 546 ntial x 0 566. 157 14
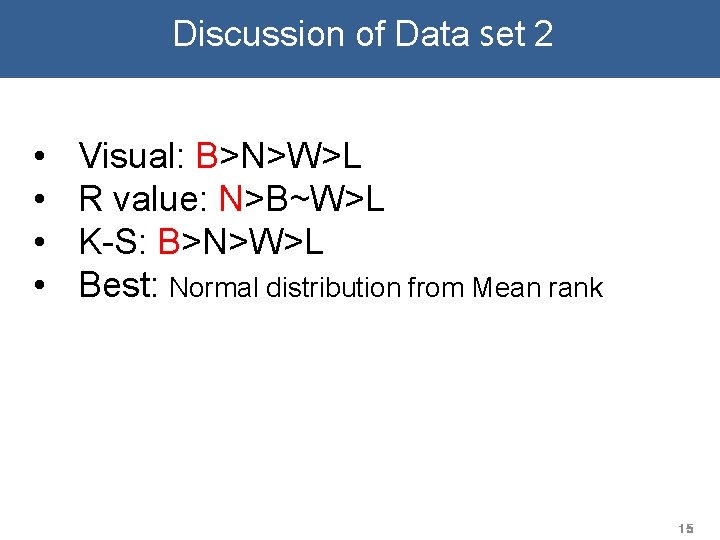
Discussion of Data set 2 • • Visual: B>N>W>L R value: N>B~W>L K-S: B>N>W>L Best: Normal distribution from Mean rank 15

Merged Data n = 23 + 22 = 45 16
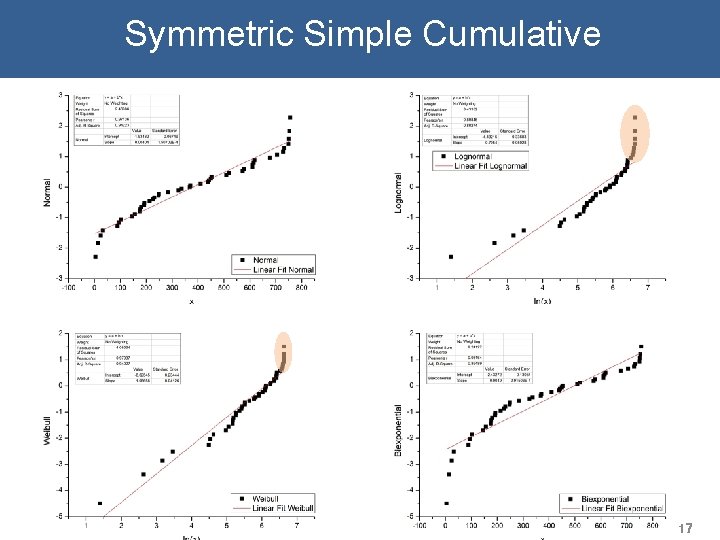
Symmetric Simple Cumulative 17

Mean Rank 18
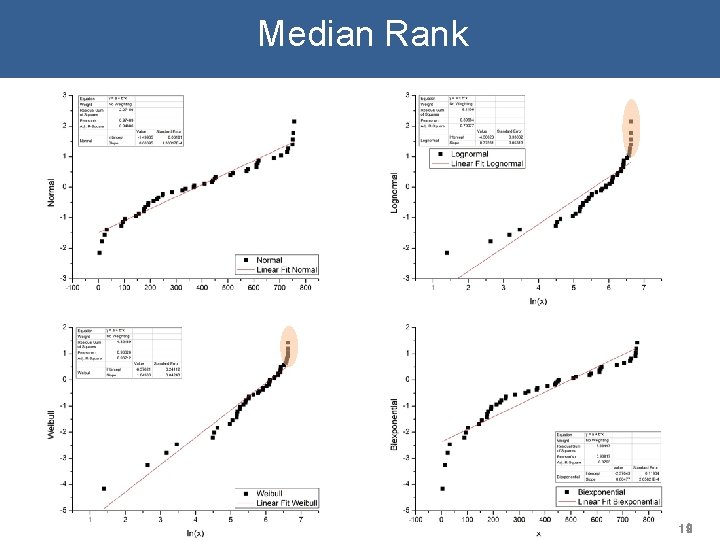
Median Rank 19
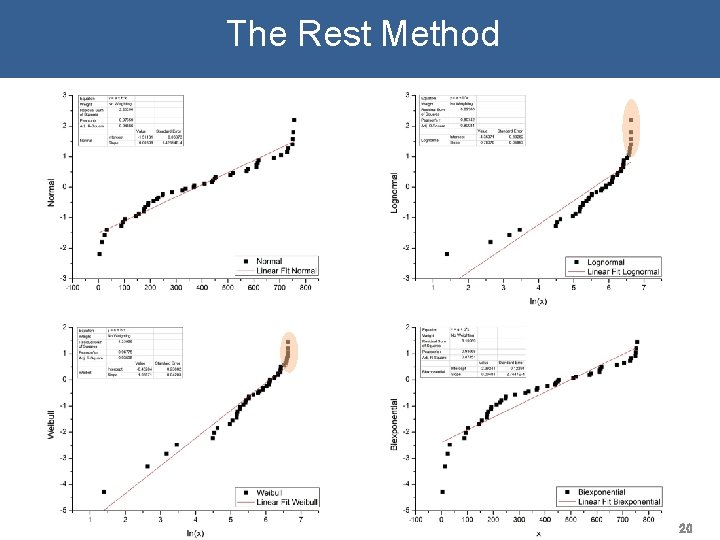
The Rest Method 20
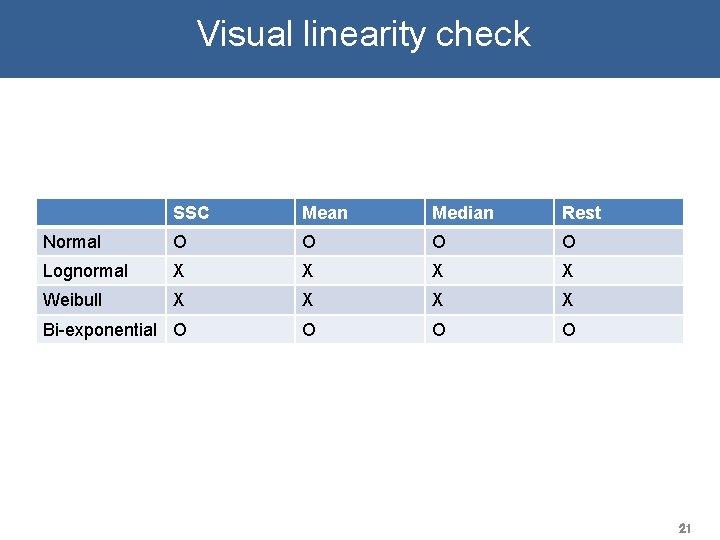
Visual linearity check SSC Mean Median Rest Normal O O Lognormal X X Weibull X X Bi-exponential O O 21
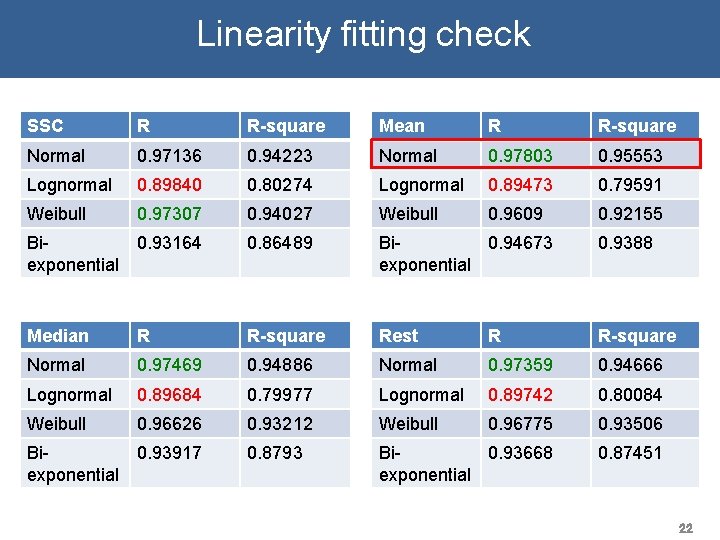
Linearity fitting check SSC R R-square Mean R R-square Normal 0. 97136 0. 94223 Normal 0. 97803 0. 95553 Lognormal 0. 89840 0. 80274 Lognormal 0. 89473 0. 79591 Weibull 0. 97307 0. 94027 Weibull 0. 9609 0. 92155 Biexponential 0. 93164 0. 86489 Bi 0. 94673 exponential 0. 9388 Median R R-square Rest R R-square Normal 0. 97469 0. 94886 Normal 0. 97359 0. 94666 Lognormal 0. 89684 0. 79977 Lognormal 0. 89742 0. 80084 Weibull 0. 96626 0. 93212 Weibull 0. 96775 0. 93506 Biexponential 0. 93917 0. 8793 Bi 0. 93668 exponential 0. 87451 22
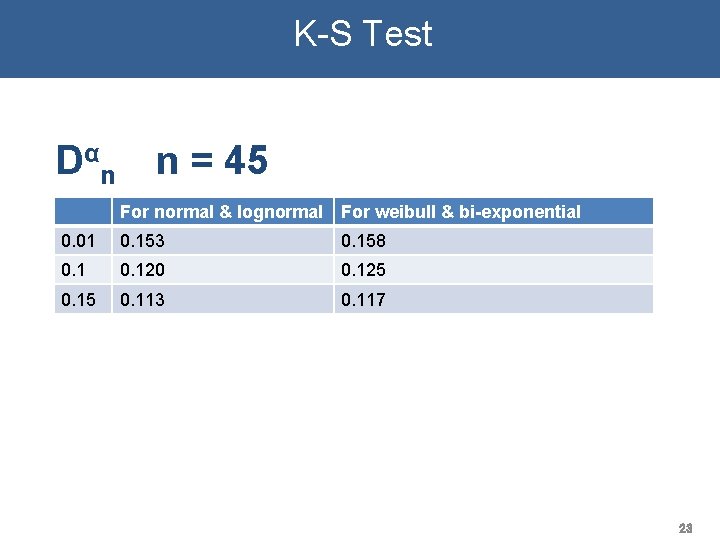
K-S Test Dαn n = 45 For normal & lognormal For weibull & bi-exponential 0. 01 0. 153 0. 158 0. 120 0. 125 0. 113 0. 117 23
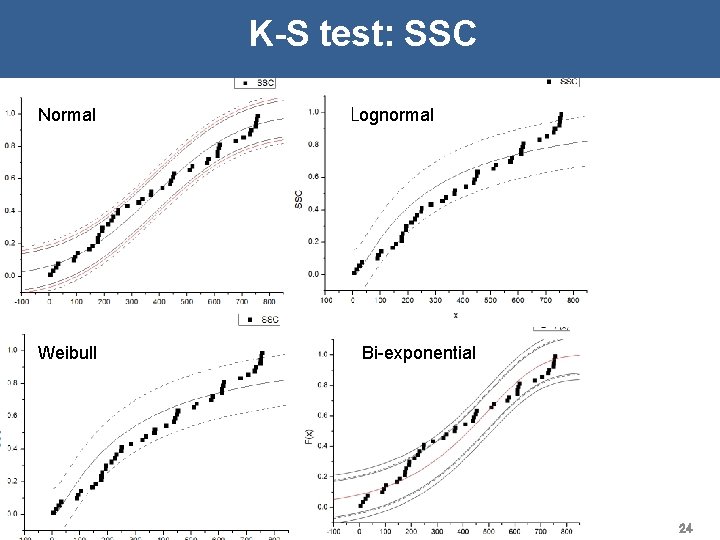
K-S test: SSC Normal Weibull Lognormal Bi-exponential 24
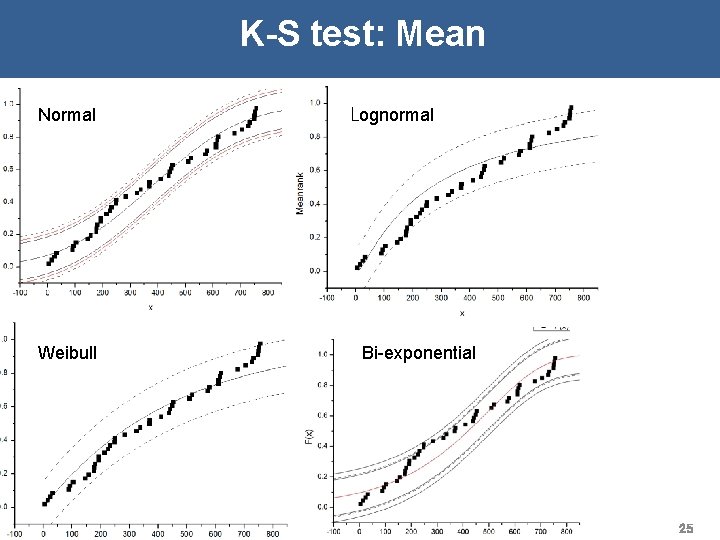
K-S test: Mean Normal Weibull Lognormal Bi-exponential 25
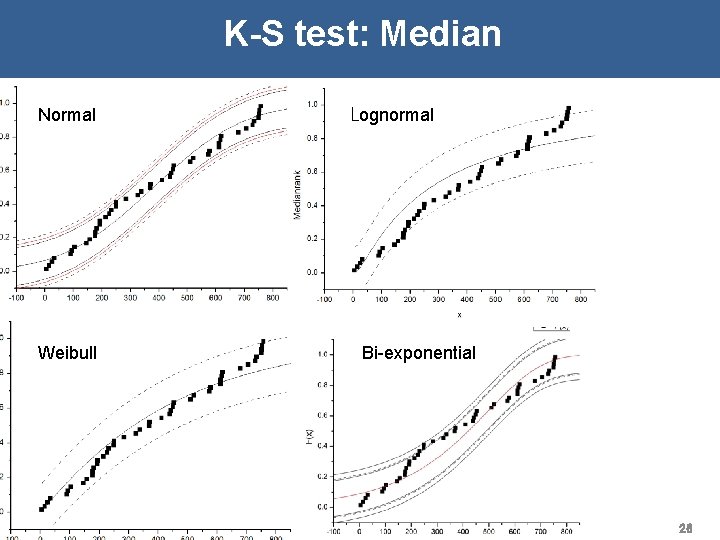
K-S test: Median Normal Weibull Lognormal Bi-exponential 26
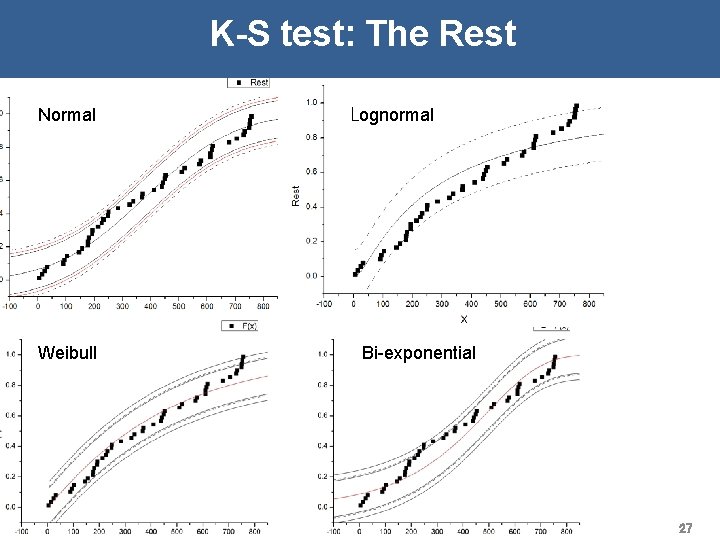
K-S test: The Rest Normal Weibull Lognormal Bi-exponential 27
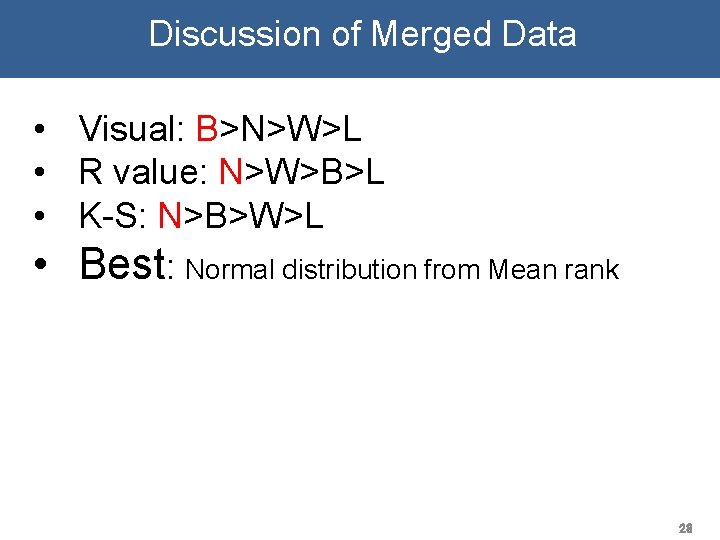
Discussion of Merged Data • Visual: B>N>W>L • R value: N>W>B>L • K-S: N>B>W>L • Best: Normal distribution from Mean rank 28
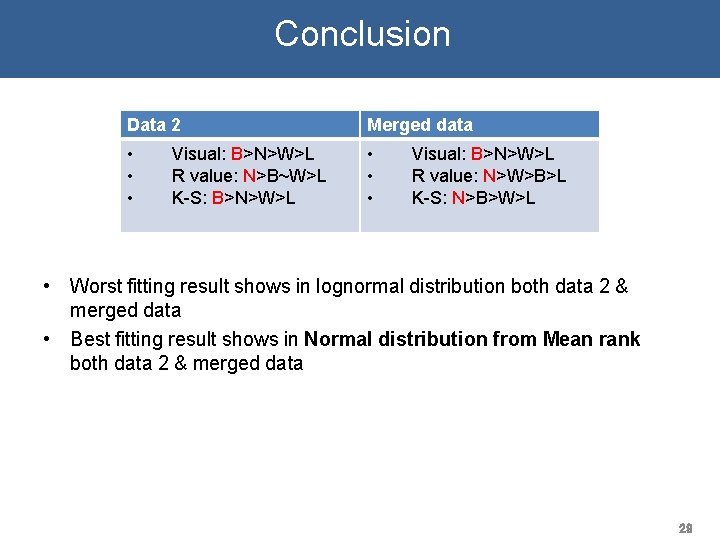
Conclusion Data 2 Merged data • • • Visual: B>N>W>L R value: N>B~W>L K-S: B>N>W>L Visual: B>N>W>L R value: N>W>B>L K-S: N>B>W>L • Worst fitting result shows in lognormal distribution both data 2 & merged data • Best fitting result shows in Normal distribution from Mean rank both data 2 & merged data 29

Thanks for your attention! Q&A 30
- Slides: 30