Introduction to population genetics Katya Mack What forces


 posit that most evolution is")


 • Ne is the size of an ideal population that")


 is the statistical association between alleles at different")


- Slides: 35
Introduction to population genetics Katya Mack
What forces and factors that shape variation within populations?
The great neutralist–selectionist debate What describes patterns of variation… Neutral processes? or Selection?
The Neutral Theory vs. selection Kimura and Ohta (1958) posit that most evolution is driven by neutral processes not selection
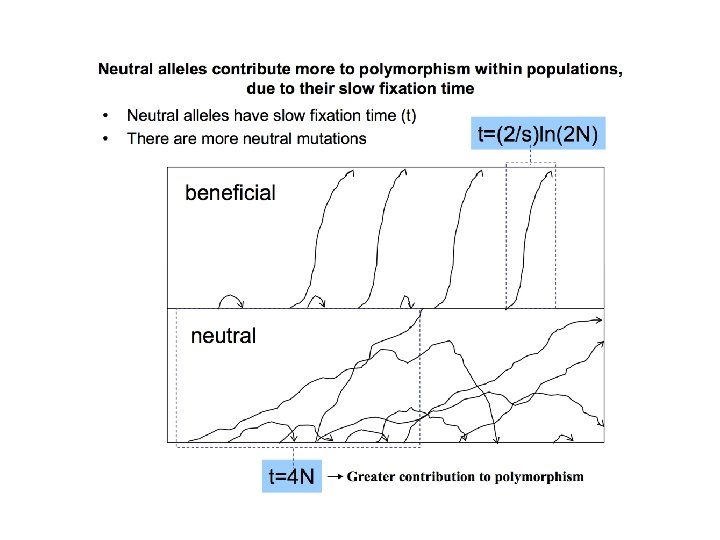
Neutral theory: major ideas 1. Most of the mutations that we observe are neutral with respect to fitness; i. e. they are functionally equivalent. These are the vast majority of mutations that contribute to polymorphism and to substitution. 2. In fact, most mutations are deleterious (not neutral) Deleterious alleles are rapidly eliminated by selection and thus do not contribute to either polymorphism or fixation. We do not see these mutations in our samples of polymorphism or divergence. 3. Fate of neutral mutations is governed solely by random genetic drift. Thus mutation rate and population size alone determine patterns of variation. 4. A vanishingly small fraction of new mutations are advantageous. Neutral theory does not deny the existence of beneficial mutations; it states that they sweep through populations quickly and contribute nothing to polymorphism.
Mutations under the Neutral Theory
The Neutral Theory • Most mutations do not impact fitness • Genetic variation is mostly a consequence of genetic drift • In a diploid population: Population size = N Neutral mutation rate = Probability of fixation by drift = initial frequency, or 1/(2 N) Number of new mutations per generation =
Simulations of drift Drift has bigger effect in smaller populations
The Neutral Theory • Most mutations do not impact fitness • Variation is mostly a consequence of genetic drift Number of new mutations / generation Fixation rate = Probability of fixation by drift So, rate of substitution = rate of mutation Substitution rate is independent of population size
The Neutral Theory Moderate population size • Probability of fixation of a new mutation = 1/2 N Sojourn time: new mutations spend an average of 4 N generations as polymorphisms in the population Higher mutation rate Smaller population size Time between successive fixations = 1/
Human population Back of the envelope calculation: • Human mutation rate = ~1. 1× 10− 8 per site per generation* • Number of humans on the planet = 7. 6 billion • What is the probability of fixation of a new mutation? • What is the sojourn time? BUT - we’ve made a few simplifying assumptions about the human population size *Mutation rates can be surprising hard to estimate
Effective population size (Ne) • Ne is the size of an ideal population that has the same magnitude of drift as the actual population. Effective population size rarely equals census size (total number of reproductive individuals) in the population
Factors that reduce the effective population size • Unequal number of breeding males or females • Unequal reproductive success • Changes in population size through time – Bottlenecks – Founder events
Effective population size of human populations Effective population size has varied throughout our evolutionary history and differs across different human populations
Natural selection
When is natural selection more powerful than drift? • Selection coefficient = s, where s = 1 - the relative fitness (measure of disadvantage) • Selection is stronger than drift when s > 1/N Example: In a population of Ne = 20, drift will be predominant for alleles where s < 0. 05 (i. e. , a 5% advantage over another allele) Selection should be most efficient in infinitely large population sizes
Probability of fixation under selection (2 s for positive small values of s and large N) Consider: 1. For a new neutral mutation in a population of 1, 000, chance of fixation is 1/2, 000 2. For a new beneficial mutation with a 5% advantage, chance of fixation is. 1/10
Rate of substitution under selection • For neutral mutations: • For advantageous mutations: 2 N x 2 s x = 4 Ns Again, note that rate of substitution is independent of N for neutral mutations, but not for advantageous mutations
Time to fixation for beneficial mutations • For neutral mutations, sojourn time = 4 N • For selected mutations, sojourn time = (2/s)ln(2 N) Consider: • A new neutral mutation in a population of 1, 000: fixation time is 4000 generations. • A new beneficial mutation in a population of 1, 000 with a 5% advantage: fixation time 276 generations
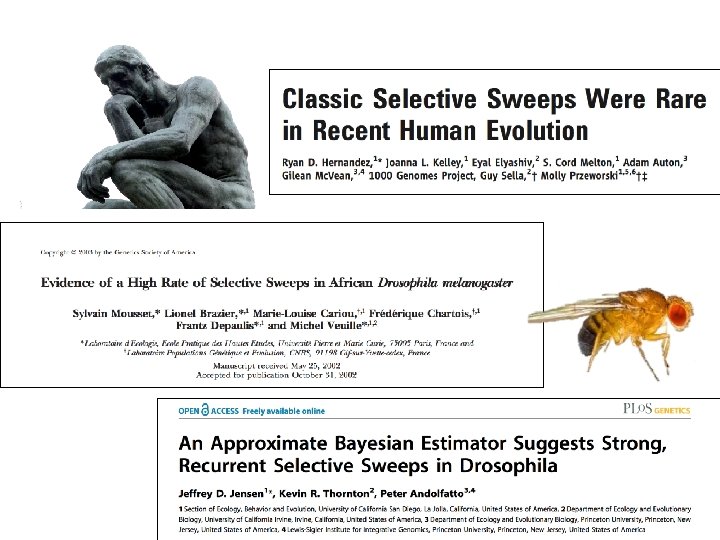
Natural selection in flies and humans • Humans have a relatively small Ne (approximately 10, 000) • Drosophila fruit flies have very large Ne, 10100 x greater than the human effective population size
Linkage disequilibrium • Linkage disequilibrium (LD) is the statistical association between alleles at different loci • Non-random association typically decays with physical distance • Recombination rate, selection, drift, and admixture can affect LD
r 2 0 1 Correlation between two alleles 1 = Alleles give identical information Laurie et al. 2007, Plo. S Genetics
Linked selection • The change in frequency of neutral alleles because of LD with selected allele • i. e. , selection at locus A will change frequency of proximal locus B A B Selected allele Neutral allele
Selective sweeps
Hard and soft sweeps
Genetic hitchhiking vs. background selection • Genetic hitchhiking: allele changes frequency because it is near another gene that is undergoing a selective sweep • Background selection: loss of genetic diversity at a non-deleterious locus due to negative selection against linked deleterious alleles The relative importance of background selection vs. genetic hitchhiking in explaining patterns of nucleotide variation in natural populations is a matter of some debate!
Deleterious mutations Comeron et al. 2017 New beneficial mutations
Selection is often dependent on local environment Fya→Fyb antigen polymorphism reduces susceptibility P. vivax malaria
Identifying local adaptation with clinal approaches • Sample individuals along geographic transects (e. g. , latitude, longitude, or altitude) that vary predictably in abiotic or biotic conditions • Identify clines (gradual changes) in allele frequencies • These clines are likely a consequence of spatially varying selection
Allele Frequency shift Environmental gradient Identifying clinal genetic variation C T
Examples: classic clines in fruit flies
Genomic scans
Population genetics introduction summary • Population genetics predicts how genetic variation should look under simplifying assumptions • Many open questions!